GS/PA trade ideas

Bonds soaring!..Probably signs of some serious instability.The rally in TLT is probably due to some instability in the system. Big banks have been weak all year. Look for a big washout this year , that takes them to areas of major support.

GS bear flag/triangleI like Short idea in Goldman Sachs (GS) here:
1) while the Dow and S&P have been trading nea rhighs I have seen a lot of divergences in the market. Weakness not only in tech but the banks also been an area of major concern. New regulation seems to have affected aspects of their business, and the future isn't looking as bright for the industry.
2) Bear flag. The stock borke down sharply in early April, and basically formed a bear flag/triangle type pattern. This pattern looks like it could resolve to downside for another move lower.
Yeasterday, it was trying to fil the gap area but closed off the lows, reasonable price for SHORT ENTRY here, next resistance zone from $160 to $162. I am looking for move to $152-$154 (TARGET) support area and potential break down if market will show us some weakness. I will ADD if it will go through lows.

GS better hold 151.A break of 151 and GS could go all the way to it's early 2013 levels. In early 2013, SPY was 140 !


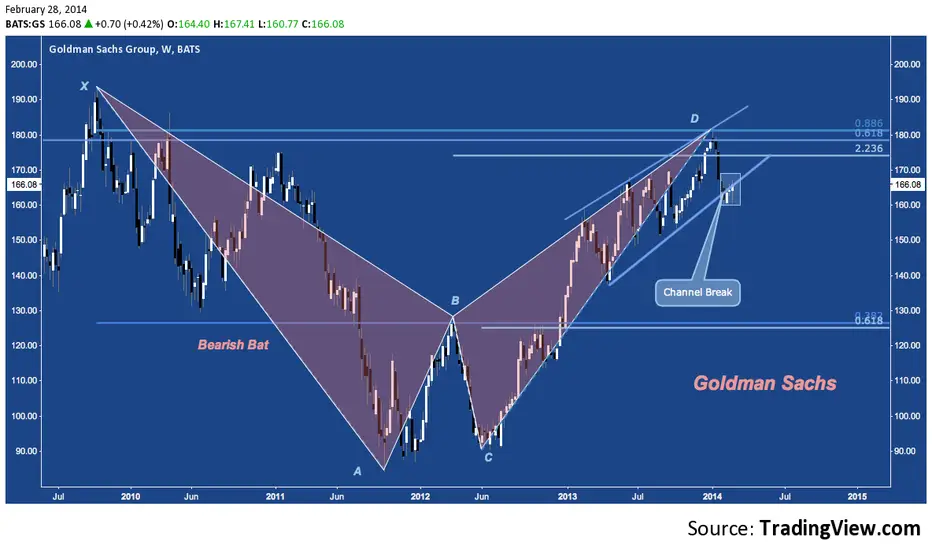

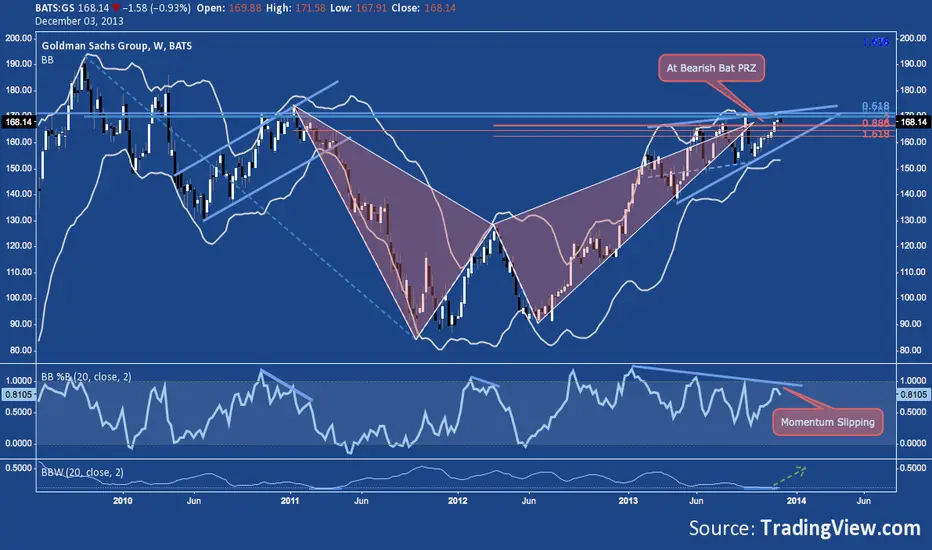
GS Weekly Analysis 1/4/13Looking to challenge (and break) the next resistance at $179 (4/10 high) in a couple of weeks. Medium term bullish.


Failed to break out over 170 this weekMay try to go next week. If it fails again, expect weakness to 165


GS coiling and ready to jumpJust like a frog getting ready to jump high in the air, I believe that Goldman Sachs is getting ready to join the direction of the overall market. The weekly and daily chart both provide good clues that GS is gathering energy. This daily chart clearly shows that GS is consolidating. It is almost exactly in the middle of its typical range confirming that it is consolidating. To determine which direction it is going next, let's look specifically at the EMA's and candlesticks.
A long trend may not be appearing yet, but since my overall market outlook is long (see my chart for ESZ2013) I believe GS will follow suit. There is potential brewing here to support a long trading assumption. The last three days are beginning to make higher highs showing the potential for its movement long. Even though the 21 EMA hasn't been able to hold up this stock, I believe the 100 EMA will hold and begin to help GS jump up. I will be watching GS this week to see if the 158 level holds as support, if it does then I will be jumping in.


