GS/PA trade ideas

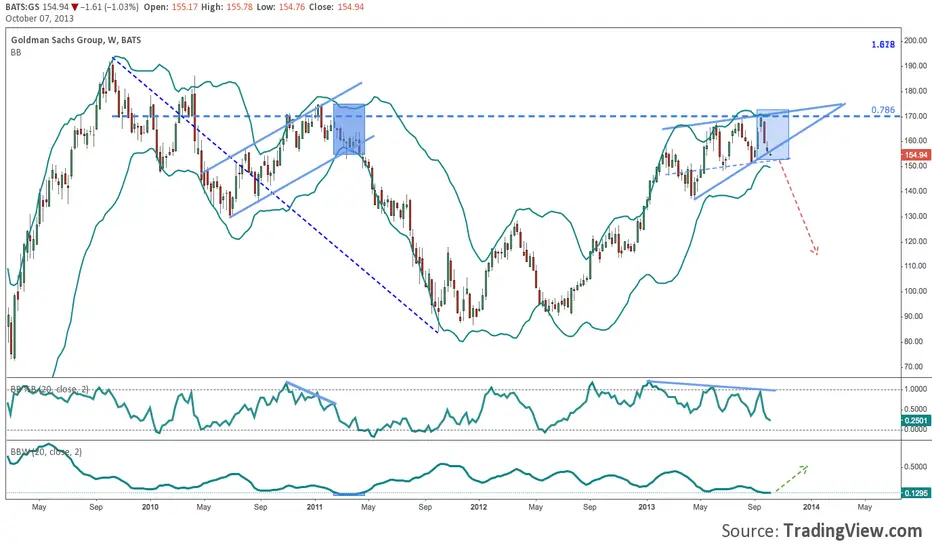
GS- bearish patternGS - beairsh pattern on weekly chart. However, the longterm pattern shows a bullish chart.


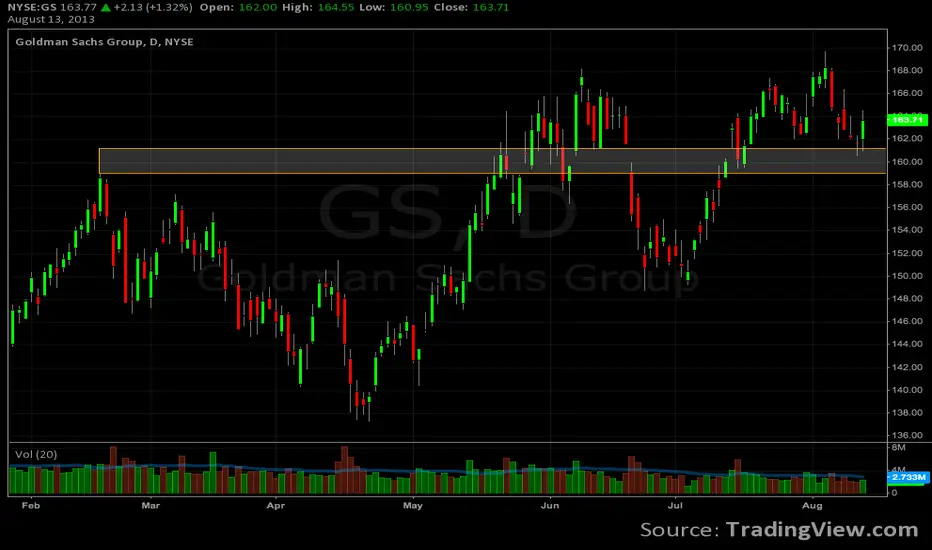
Potential Short Opportunity for GSClear Divergence forming as Goldman has been ranging for awhile now in the box. Nice clear double top. I think we see a reverse back to the resistance level at 158.28. Try and test and then a long way down to 120s-130s.
Please let me know your thoughts.

Goldman Sachs: Double Top from Bat PRZ? $GS at Bearish Bat PRZ resistance; double top activates below 148


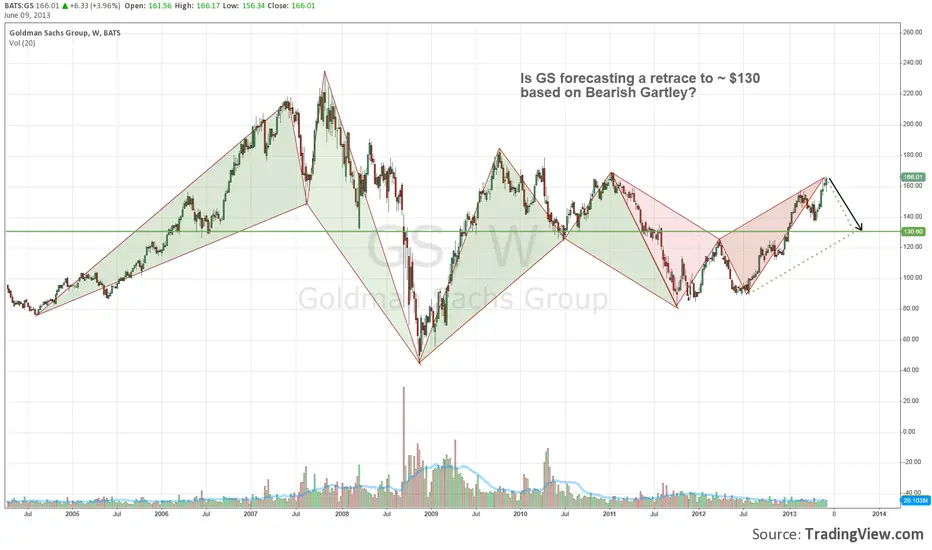
Goldman: HIgher Highs, Hollowing Out Beneath2-year Harmonic Bearish Bat at PRZ around $160, on higher highs grinding out over major negative momentum divergence

GS Daily to go along with MonthlyCould either be forming a Bullish Gartley or a Bearish AB=CD. price action next week will tell which one it is.

GS MonthlyI am bullish on the financials due to the massive blows they all received in 2008. Most retraced to their IPO price or even lower. I would look for GS to start blowing through the roof soon. Look at my daily GS chart to go along with this one.

Goldman Sachs - ST Bearish/LT Bullish, Riding the shortsOverall, GS looks bullish, in this Wolfe Wave (along with medianlines), there seems to be a potential trade to short GS into Wolfe Wave point 5. This region is also confirmed with using Median lines. From this point 5 on, we can expect to see price rally. If not confident, an alert can be set for the price levels in the target region, which will be a good point to Buy and hold GS.

GS - Long - Weekly MA Strength, Fibonacci Support- Bullish MA crossovers
- Trending RSI
- Price target of $18.03
- Buy above previous high
- Use previous high, after buying, as a stop position


GS short set upBear Flag on the daily. Two possible ways to play:
1. Short at the break of pennant, which is also the area of a rising trendline.
2. If price bounces, watch the top of the pennant, which coincides with the 50 SMA of 154.36. Failing to break above and hold the 50 day would provide a low risk opportunity to short with a stop at 155.

Bearish Gartley pattern in GS (Weekly?)Just eyeballing this it looks like GS may retrace to $130 $XLF $BKX


Bearish Head and shoulders' topLast call hit the target price $146.60 and price failed to hold now. Last few sessions it tried to reclaimed it but failed. It looks the price is heading to the South now and this pattern has a measured move to $134 area which can be achieved within 4 weeks. Option traders can consider May time line. Join us www.woowtrading.net
