ELI LILLY to soon start a correction towards $700.Eli Lilly (LLY) has made new All Time Highs (ATH) this month, extending the impressive rally since the August Low near the 1W MA200 (orange trend-line).
The multi-year trend remains bullish within a Fibonacci Channel Up but practically the stock hasn't gotten out of its range since the July 2024 Hi
Key facts today
Next report date
—
Report period
—
EPS estimate
—
Revenue estimate
—
20.25 USD
10.59 B USD
45.04 B USD
849.49 M
About Eli Lilly and Company
Sector
Industry
CEO
David A. Ricks
Website
Headquarters
Indianapolis
Founded
1876
ISIN
US5324571083
FIGI
BBG000BNBDC2
Eli Lilly & Co. engages in the discovery, development, manufacture, and sale of pharmaceutical products. The firm's products consist of diabetes, oncology, immunology, neuroscience, and other products and therapies. The company was founded by Eli Lilly in May 1876 and is headquartered in Indianapolis, IN.
Related stocks

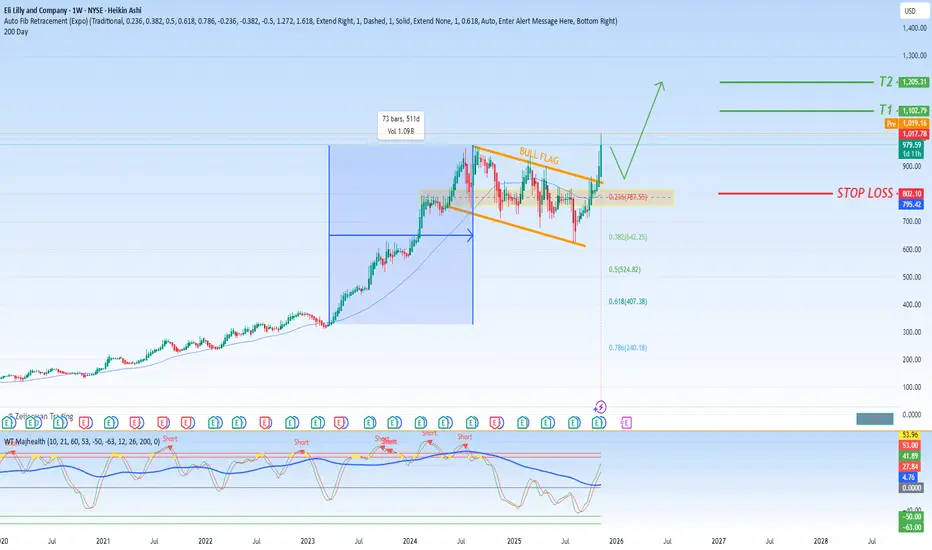
LLY - Massive Bullflag in a Multi-year uptrendLLY will absolutely outperform in the next couple of months.
Pair a technically flawless chart with a huge bullflag breakout with positive headwind "Google: Trump announces deals with Eli Lilly, Novo Nordisk to slash weight loss drug prices, offer some Medicare coverage" and coming QE and you have

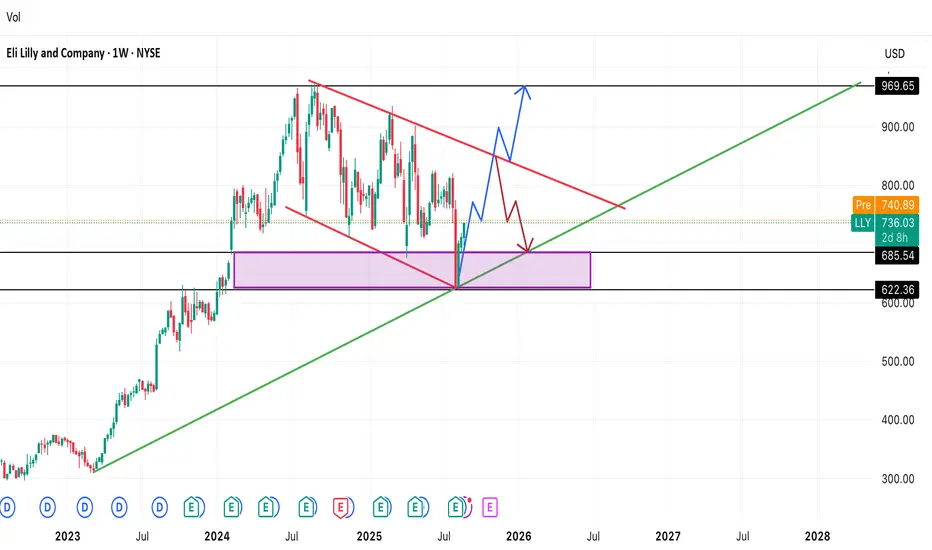
$LLY: Decision Zone — Wedge Breakout or Retest of 685Eli Lilly (LLY) rebounded off the long-term trendline and weekly demand box (≈622–686) and is compressing inside a descending wedge.
Bullish path (blue): a clean break and retest of wedge resistance opens room toward the prior extension/marker near ~970.
Bearish path (red): rejection at the
Eli Lilly Testing $1000 — Breakout or Fakeout?After consolidating for over a year inside a descending channel, LLY has rallied back to the top resistance zone around $1000.
Bullish Case:
• Breakout above $1000 = start of new uptrend.
• Targets: $1100 → $1200.
Bearish Case:
• Rejection at $1000 could pull price back to $850–$800, or eve

Imminent bullish breakoutThe price has been moving within a descending channel for several months, and following the recent earnings report, it's accelerating upward — now positioned just below the upper boundary.
A confirmed close above $880 would set the next target at $935, followed by a potential move beyond $1000.
Ke

"LLY's Bear Market Mode ON | Crash Incoming"“ LLY is gearing up for a sharp correction down to the $35–$17 zone — a critical reset that could flush out weak hands before the next explosive bull run. Stay sharp, this is where big opportunities form. ⚠️
🔥 Summary:
Eli Lilly (LLY) looks ready for a major market reset after completing a

LLY LOOKS BULLISH OCT 31 2025I have LLY from lower levels of 870ish which was trade 2. Trade 1 was initiated at 637. Now again it looks ready to go to 890
I am long since $815 yesterday.
Trade as per your risk management and its a current price trade so SLs would be huge. But I can understand what price is trying to do here.

LLY | This Healthcare Co. Is a Great Pick | LONGEli Lilly & Co. engages in the discovery, development, manufacture, and sale of pharmaceutical products. The firm's products consist of diabetes, oncology, immunology, neuroscience, and other products and therapies. The company was founded by Eli Lilly in May 1876 and is headquartered in Indianapoli

LLY Bullish Breakout: Retest or Continuation Toward 950–1000Eli Lilly (LLY) just cleared the key ceiling at 865 with a wide-range bullish day, closing near 896.53 and printing a session high at 901.34. The breakout resolves an ascending triangle and comes with expanding volatility and volume—classic continuation behavior in a dominant uptrend. With price abo

$LLYThe technical structure for NYSE:SMR presents a compelling case of a strong, sustained uptrend, characterized by a rhythmic pattern of sharp advances followed by periods of consolidation. This behavior is the hallmark of a healthy, momentum-driven bull move.
1. Pattern Analysis: Sequential Bull F
See all ideas
Summarizing what the indicators are suggesting.
Neutral
SellBuy
Strong sellStrong buy
Strong sellSellNeutralBuyStrong buy
Neutral
SellBuy
Strong sellStrong buy
Strong sellSellNeutralBuyStrong buy
Neutral
SellBuy
Strong sellStrong buy
Strong sellSellNeutralBuyStrong buy
An aggregate view of professional's ratings.
Neutral
SellBuy
Strong sellStrong buy
Strong sellSellNeutralBuyStrong buy
Neutral
SellBuy
Strong sellStrong buy
Strong sellSellNeutralBuyStrong buy
Neutral
SellBuy
Strong sellStrong buy
Strong sellSellNeutralBuyStrong buy
Displays a symbol's price movements over previous years to identify recurring trends.
LLY4099975
Eli Lilly and Company 4.65% 15-JUN-2044Yield to maturity
5.65%
Maturity date
Jun 15, 2044
XS238628644
Eli Lilly and Company 1.625% 14-SEP-2043Yield to maturity
5.60%
Maturity date
Sep 14, 2043
LLY6003397
Eli Lilly and Company 5.6% 12-FEB-2065Yield to maturity
5.48%
Maturity date
Feb 12, 2065
LLY6153503
Eli Lilly and Company 5.65% 15-OCT-2065Yield to maturity
5.48%
Maturity date
Oct 15, 2065
US532457BU1
Eli Lilly and Company 4.15% 15-MAR-2059Yield to maturity
5.46%
Maturity date
Mar 15, 2059
LLY5547405
Eli Lilly and Company 4.95% 27-FEB-2063Yield to maturity
5.43%
Maturity date
Feb 27, 2063
LLY5750032
Eli Lilly and Company 5.1% 09-FEB-2064Yield to maturity
5.42%
Maturity date
Feb 9, 2064
LLY5871804
Eli Lilly and Company 5.2% 14-AUG-2064Yield to maturity
5.42%
Maturity date
Aug 14, 2064
US532457BT4
Eli Lilly and Company 3.95% 15-MAR-2049Yield to maturity
5.41%
Maturity date
Mar 15, 2049
LLY5871803
Eli Lilly and Company 5.05% 14-AUG-2054Yield to maturity
5.36%
Maturity date
Aug 14, 2054
LLY5547404
Eli Lilly and Company 4.875% 27-FEB-2053Yield to maturity
5.34%
Maturity date
Feb 27, 2053
See all LLY bonds
Curated watchlists where LLY is featured.


Frequently Asked Questions
The current price of LLY is 1,028.43 USD — it has increased by 2.95% in the past 24 hours. Watch Eli Lilly and Company stock price performance more closely on the chart.
Depending on the exchange, the stock ticker may vary. For instance, on NYSE exchange Eli Lilly and Company stocks are traded under the ticker LLY.
LLY stock has risen by 11.72% compared to the previous week, the month change is a 22.23% rise, over the last year Eli Lilly and Company has showed a 25.37% increase.
We've gathered analysts' opinions on Eli Lilly and Company future price: according to them, LLY price has a max estimate of 1,500.00 USD and a min estimate of 775.00 USD. Watch LLY chart and read a more detailed Eli Lilly and Company stock forecast: see what analysts think of Eli Lilly and Company and suggest that you do with its stocks.
LLY stock is 2.26% volatile and has beta coefficient of 0.57. Track Eli Lilly and Company stock price on the chart and check out the list of the most volatile stocks — is Eli Lilly and Company there?
Today Eli Lilly and Company has the market capitalization of 962.19 B, it has increased by 6.78% over the last week.
Yes, you can track Eli Lilly and Company financials in yearly and quarterly reports right on TradingView.
Eli Lilly and Company is going to release the next earnings report on Feb 11, 2026. Keep track of upcoming events with our Earnings Calendar.
LLY earnings for the last quarter are 7.02 USD per share, whereas the estimation was 5.69 USD resulting in a 23.33% surprise. The estimated earnings for the next quarter are 7.08 USD per share. See more details about Eli Lilly and Company earnings.
Eli Lilly and Company revenue for the last quarter amounts to 17.60 B USD, despite the estimated figure of 16.05 B USD. In the next quarter, revenue is expected to reach 17.57 B USD.
LLY net income for the last quarter is 5.58 B USD, while the quarter before that showed 5.66 B USD of net income which accounts for −1.38% change. Track more Eli Lilly and Company financial stats to get the full picture.
Yes, LLY dividends are paid quarterly. The last dividend per share was 1.50 USD. As of today, Dividend Yield (TTM)% is 0.57%. Tracking Eli Lilly and Company dividends might help you take more informed decisions.
Eli Lilly and Company dividend yield was 0.67% in 2024, and payout ratio reached 44.39%. The year before the numbers were 0.78% and 77.91% correspondingly. See high-dividend stocks and find more opportunities for your portfolio.
As of Nov 13, 2025, the company has 47 K employees. See our rating of the largest employees — is Eli Lilly and Company on this list?
EBITDA measures a company's operating performance, its growth signifies an improvement in the efficiency of a company. Eli Lilly and Company EBITDA is 28.29 B USD, and current EBITDA margin is 41.75%. See more stats in Eli Lilly and Company financial statements.
Like other stocks, LLY shares are traded on stock exchanges, e.g. Nasdaq, Nyse, Euronext, and the easiest way to buy them is through an online stock broker. To do this, you need to open an account and follow a broker's procedures, then start trading. You can trade Eli Lilly and Company stock right from TradingView charts — choose your broker and connect to your account.
Investing in stocks requires a comprehensive research: you should carefully study all the available data, e.g. company's financials, related news, and its technical analysis. So Eli Lilly and Company technincal analysis shows the buy rating today, and its 1 week rating is strong buy. Since market conditions are prone to changes, it's worth looking a bit further into the future — according to the 1 month rating Eli Lilly and Company stock shows the strong buy signal. See more of Eli Lilly and Company technicals for a more comprehensive analysis.
If you're still not sure, try looking for inspiration in our curated watchlists.
If you're still not sure, try looking for inspiration in our curated watchlists.