$MAA with a Bullish outlook following its earnings #Stocks The PEAD projected a bullish outlook for $MAA after a positive under reaction following its earnings release placing the stock in drift A with an expected accuracy of 50%.
Next report date
—
Report period
—
EPS estimate
—
Revenue estimate
—
4.77USD
552.58 MUSD
2.15 BUSD
116.01 M
About Mid-America Apartment Communities, Inc.
Sector
Industry
CEO
H. Eric Bolton
Website
Headquarters
Germantown
Employees (FY)
2.43 K
Founded
1994
FIGI
BBG000BLMY92
Mid-America Apartment Communities, Inc. is a real estate investment trust, which engages in the operation, acquisition, and development of apartment communities. It operates through the Same Store and Non-Same Store segments. The Same Store Communities segment represents those apartment communities that have been owned and stabilized for at least 12 months as of the first day of the calendar year. The Non-Same Store segment includes recent acquisitions, communities in development or lease-up. The company was founded in 1994 and is headquartered in Germantown, TN.

$MAA with a Bullish outlook following its earnings #Stocks The PEAD projected a Bullish outlook for $MAA after a Negative over reaction following its earnings release placing the stock in drift C with an expected accuracy of 83.33%.

MAA - Curved Uptrend ContinuationOn this 12H chart a curved uptrend is apparent
A breakdown of this curve is very possible, but if it has one more move up left the double curve is how it will likely play out
This isn't a log chart

MAA - Bearish Continuation H&SGreen trend lines are strong up trend lines
A H&S pattern is completing itself above the trend lines
This H&S will bring price back to a strong level of support at the horizontal white line
Daily Chart

MAA: mean reversion trade?A bullish trend direction is applicable above 205.
Crossing below this level will negate the bullish stance.
Upside price momentum supports the bullish trend direction.
A price action close to the lower range of the linear regression channel pattern increases the likelihood of a mean reversion trade

MAA showing strength in the Real Estate sector.* Good earnings
* Very strong up trend
* High 3-month relative strength in the Real Estate sector
* Breaking out of a base on base pattern
* The upper base was constructed over 6 weeks
* Breaking out with a lot of volume (130.2% above the 15 day average)
* The Real Estate sector has been consolidati

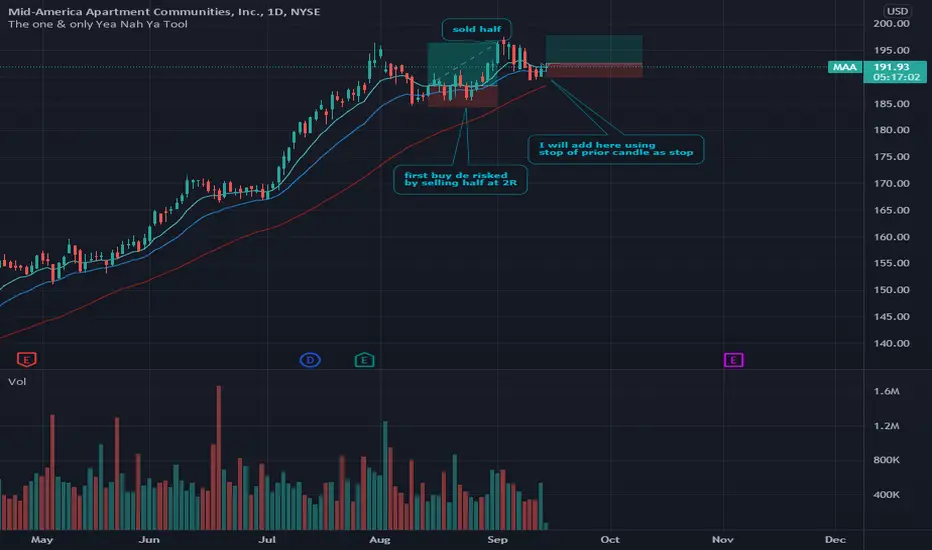
MAA, Second buy, Long Here is one of my stronger uptrends , slower mover but robust uptrend . Nice RS too .
Trying to add to position on this pop above 10ema vs prior candle low .
May be a good idea to give stop a bit more room than me and base it off the swing low instead ..
In 192.56
stop 189.86

MAA, Mid-America Apartment Communities - Trailing StopNYSE:MAA
We often read that technical analysis is foolish or that it's all bullshit and so on.
You know, at the end I started analyzing charts and graphs for months and at the end I realized that a statistic from the point of view of the realization of the trades is absolutely there.
What matters i

MAA: Sort opportunityAn intraday high potential, Back Tested Sort Analysis.
We ll try to enter into the correction of the uptrend movement tracking trend oscillators as below:
Price is likely to fluctuate within parallel channel's boundaries.
DETAILS ON THE CHART
NOTE: Entry range area above the entry point, is

See all ideas
An aggregate view of professional's ratings.
Curated watchlists where MAA is featured.
