Adidas AG (ADS) | Preparing for Wave 5 Rally Toward €500–€1,200Adidas AG (XETR:ADS) | Long-Term Elliott Wave & Structural Outlook
Adidas AG is completing a Wave 4 correction near key Fibonacci support, aligning technical structure and smart money accumulation for a potential long-term Wave 5 expansion toward €500–€1,200.
📊 Technical & Fundamental Confluen
adidas AG
No trades
Key facts today
Next report date
—
Report period
—
EPS estimate
—
Revenue estimate
—
8.01 USD
790.91 M USD
24.52 B USD
164.87 M
About adidas AG
Sector
Industry
CEO
Bjørn Gulden
Website
Headquarters
Herzogenaurach
Founded
1989
Identifiers
2
ISINDE000A1EWWW0
adidas AG engages in the design, distribution, and marketing of athletic and sporting lifestyle products. It operates through the following geographical segments: EMEA, North America, Greater China, Asia-Pacific, Latin America, and Other Businesses. The Other Businesses segment includes the activities of the Y-3 label and other subordinated businesses. The company was founded by Adolf Dassler in 1920 and is headquartered in Herzogenaurach, Germany.
Related stocks

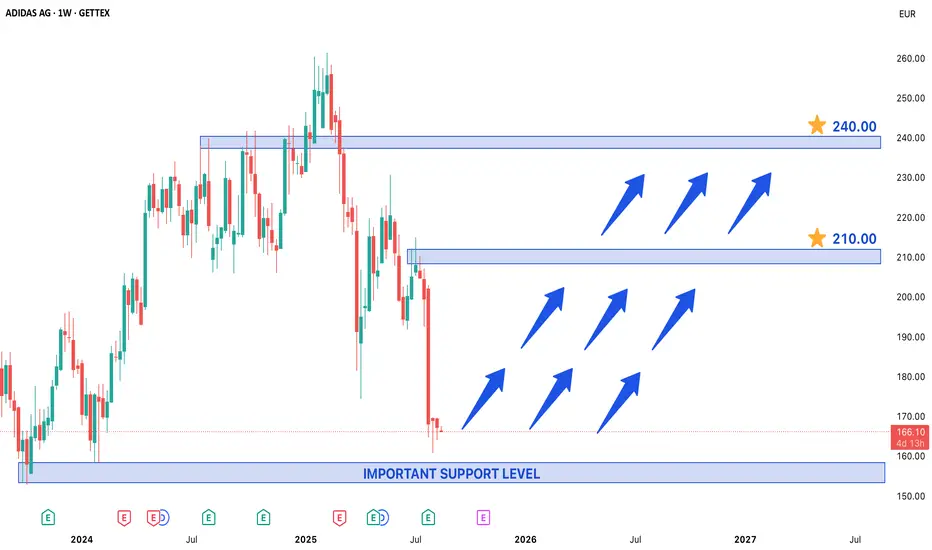
Adidas ADS Trading Near Important Support Level in Weekly ChartAdidas Stock Trading Near Important Support Level – A Potential Long-Term Entry Point
Adidas (ADS) stock is currently trading near a crucial support level, presenting a potential opportunity for long-term investors. Historically, this price level has acted as a strong base, with notable rejections
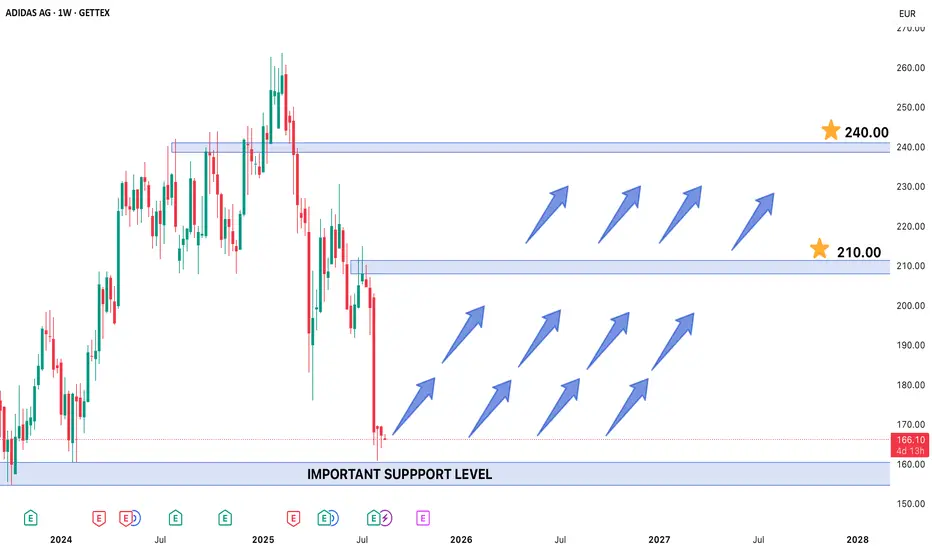
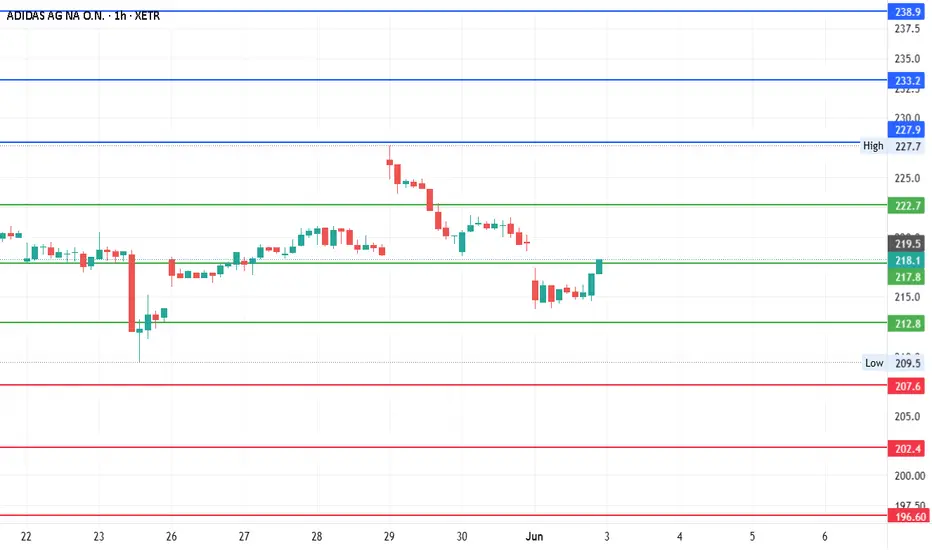
#ADIDAS - Pivot is 217.75Date: 03-06-2025
#ADIDAS
Pivot Point: 217.75 Support: 212.83 Resistance: 222.71
Upside Targets:
Target 1: 227.93
Target 2: 233.15
Target 3: 238.93
Downside Targets:
Target 1: 207.59
Target 2: 202.35
Target 3: 196.575
Buy Idea on ADIDAS (ADS)Based on :
- Quinquennial Cycle and other years with similar european monetary policies
- Quantitative data
- Divergence on POIV (with 6E open interest) and Progo
- Undervalued Conditions
- Strong Demand zone covered by weekly demand as well

Adidias - more downside awaiting (?)I chose to present the chart as log scale to show more clearly the sub-waves of the white impulse count. Without that the impulsive structure of the waves wouldn´t be easy to see.
My main scenario is that Adidas will become cheaper in the foreseeable future as market price broke the structure indic

ADIDAS: 20% - 30% discountSchool has already started, and the kids have already bought their backpacks. There are no more backpacks left to sell, hahaha.
ADIDAS is expected to drop by 20 to 30 percent, as indicated on the pink boxes.
This is just for entertainment. Don't risk your money.

Short, target 204.6Following weekly chart, I got a short signal.
TP 204.6
SL 231.7, close above candle close.

Adidas is Bearish.I will be on the lookout for sell opportunities once the supply zone is mitigated. I will see how it goes.
Happy trading ..


See all ideas
Summarizing what the indicators are suggesting.
Neutral
SellBuy
Strong sellStrong buy
Strong sellSellNeutralBuyStrong buy
Neutral
SellBuy
Strong sellStrong buy
Strong sellSellNeutralBuyStrong buy
Neutral
SellBuy
Strong sellStrong buy
Strong sellSellNeutralBuyStrong buy
An aggregate view of professional's ratings.
Neutral
SellBuy
Strong sellStrong buy
Strong sellSellNeutralBuyStrong buy
Neutral
SellBuy
Strong sellStrong buy
Strong sellSellNeutralBuyStrong buy
Neutral
SellBuy
Strong sellStrong buy
Strong sellSellNeutralBuyStrong buy
Displays a symbol's price movements over previous years to identify recurring trends.
XS222462142
adidas AG 0.625% 10-SEP-2035Yield to maturity
3.56%
Maturity date
Sep 10, 2035
XS321547028
adidas AG 2.75% 06-NOV-2030Yield to maturity
3.02%
Maturity date
Nov 6, 2030
XS255517937
adidas AG 3.125% 21-NOV-2029Yield to maturity
2.79%
Maturity date
Nov 21, 2029
XS2240505268
adidas AG 0.0% 05-OCT-2028Yield to maturity
2.52%
Maturity date
Oct 5, 2028
XS111415927
adidas AG 2.25% 08-OCT-2026Yield to maturity
2.05%
Maturity date
Oct 8, 2026
See all ADDDF bonds
EWLD
Amundi Index Solutions SICAV - Amundi MSCI World Swap UCITS ETFWeight
2.47%
Market value
169.40 M
USD
Explore more ETFs
Curated watchlists where ADDDF is featured.


Frequently Asked Questions
The current price of ADDDF is 191.02 USD — it has decreased by −0.67% in the past 24 hours. Watch adidas AG stock price performance more closely on the chart.
Depending on the exchange, the stock ticker may vary. For instance, on OTC exchange adidas AG stocks are traded under the ticker ADDDF.
ADDDF stock has risen by 2.51% compared to the previous week, the month change is a 0.54% rise, over the last year adidas AG has showed a −24.80% decrease.
We've gathered analysts' opinions on adidas AG future price: according to them, ADDDF price has a max estimate of 326.29 USD and a min estimate of 221.83 USD. Watch ADDDF chart and read a more detailed adidas AG stock forecast: see what analysts think of adidas AG and suggest that you do with its stocks.
ADDDF reached its all-time high on Jan 5, 2021 with the price of 406.19 USD, and its all-time low was 27.75 USD and was reached on Feb 27, 2009. View more price dynamics on ADDDF chart.
See other stocks reaching their highest and lowest prices.
See other stocks reaching their highest and lowest prices.
ADDDF stock is 0.68% volatile and has beta coefficient of 1.19. Track adidas AG stock price on the chart and check out the list of the most volatile stocks — is adidas AG there?
Today adidas AG has the market capitalization of 35.10 B, it has increased by 0.29% over the last week.
Yes, you can track adidas AG financials in yearly and quarterly reports right on TradingView.
adidas AG is going to release the next earnings report on Mar 11, 2026. Keep track of upcoming events with our Earnings Calendar.
ADDDF earnings for the last quarter are 3.02 USD per share, whereas the estimation was 3.12 USD resulting in a −3.33% surprise. The estimated earnings for the next quarter are 0.44 USD per share. See more details about adidas AG earnings.
adidas AG revenue for the last quarter amounts to 7.78 B USD, despite the estimated figure of 7.78 B USD. In the next quarter, revenue is expected to reach 7.29 B USD.
ADDDF net income for the last quarter is 542.13 M USD, while the quarter before that showed 435.86 M USD of net income which accounts for 24.38% change. Track more adidas AG financial stats to get the full picture.
Yes, ADDDF dividends are paid annually. The last dividend per share was 2.23 USD. As of today, Dividend Yield (TTM)% is 1.19%. Tracking adidas AG dividends might help you take more informed decisions.
As of Dec 16, 2025, the company has 62.03 K employees. See our rating of the largest employees — is adidas AG on this list?
Like other stocks, ADDDF shares are traded on stock exchanges, e.g. Nasdaq, Nyse, Euronext, and the easiest way to buy them is through an online stock broker. To do this, you need to open an account and follow a broker's procedures, then start trading. You can trade adidas AG stock right from TradingView charts — choose your broker and connect to your account.
Investing in stocks requires a comprehensive research: you should carefully study all the available data, e.g. company's financials, related news, and its technical analysis. So adidas AG technincal analysis shows the neutral today, and its 1 week rating is sell. Since market conditions are prone to changes, it's worth looking a bit further into the future — according to the 1 month rating adidas AG stock shows the sell signal. See more of adidas AG technicals for a more comprehensive analysis.
If you're still not sure, try looking for inspiration in our curated watchlists.
If you're still not sure, try looking for inspiration in our curated watchlists.