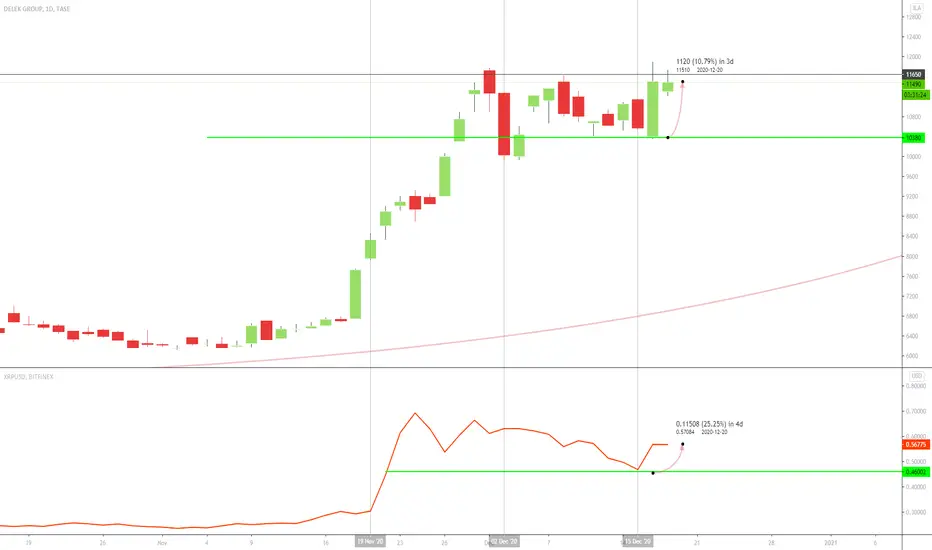
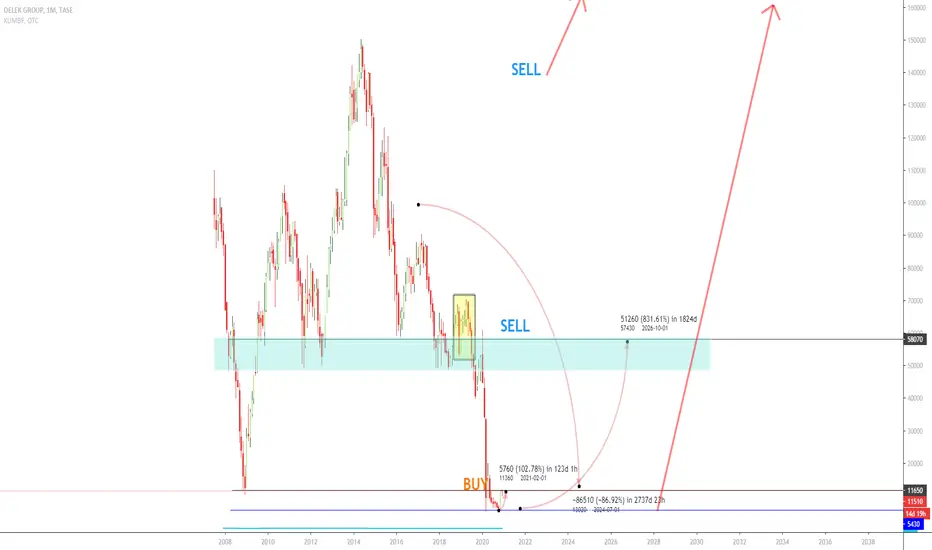
Delek Long updateduntil earnings (30.5) Delek can drop to supports 2 levels down.
target - 60000, once reached can go up to 75000
Next report date
—
Report period
—
EPS estimate
—
Revenue estimate
—
22.33USD
438.73 MUSD
3.40 BUSD
9.36 M
About DELEK GROUP
Sector
Industry
CEO
Idan Wallace
Website
Headquarters
Herzliya
Employees (FY)
635
Founded
1951
ISIN
IL0010841281
FIGI
BBG000D9HKW7
Delek Group Ltd. engages in the oil and gas exploration and production in Israel and abroad through investee companies and partnerships, and in marketing of fuel products in Israel. It operates through the following segments. Energy in Israel, Foreign Energy, and Other Operations. The Energy in Israel segment is mainly conducted through the company's direct and indirect holdings in the NewMed Energy partnership. The Foreign Energy segment operates mainly through Ithaca which holds the rights to produce oil and gas reservois in the UK Continental Shelf in the North Sea off the coas t of Englad. The Other Operations segment is comprised of the company's holdings in Delek Israel and Delek Properties The company was founded in 1951 and is headquartered in Herzliya, Israel.


Trade directly on the supercharts through our supported, fully-verified and user-reviewed brokers.


Frequently Asked Questions
The current price of DLKGF is 122.60 USD — it has decreased by 0.41% in the past 24 hours. Watch Delek Group Ltd. stock price performance more closely on the chart.
Depending on the exchange, the stock ticker may vary. For instance, on OTC exchange Delek Group Ltd. stocks are traded under the ticker DLKGF.
Delek Group Ltd. is going to release the next earnings report on May 30, 2024. Keep track of upcoming events with our Earnings Calendar.
DLKGF stock is 0.41% volatile and has beta coefficient of 1.35. Track Delek Group Ltd. stock price on the chart and check out the list of the most volatile stocks — is Delek Group Ltd. there?
Yes, you can track Delek Group Ltd. financials in yearly and quarterly reports right on TradingView.
DLKGF net income for the last quarter is 21.76 M USD, while the quarter before that showed 110.72 M USD of net income which accounts for −80.35% change. Track more Delek Group Ltd. financial stats to get the full picture.
Today Delek Group Ltd. has the market capitalization of 2.21 B, it has increased by 1.81% over the last week.
Like other stocks, DLKGF shares are traded on stock exchanges, e.g. Nasdaq, Nyse, Euronext, and the easiest way to buy them is through an online stock broker. To do this, you need to open an account and follow a broker's procedures, then start trading. You can trade Delek Group Ltd. stock right from TradingView charts — choose your broker and connect to your account.
DLKGF reached its all-time high on Apr 23, 2014 with the price of 402.00 USD, and its all-time low was 18.25 USD and was reached on Oct 22, 2020. View more price dynamics on DLKGF chart.
See other stocks reaching their highest and lowest prices.
See other stocks reaching their highest and lowest prices.
As of May 6, 2024, the company has 635.00 employees. See our rating of the largest employees — is Delek Group Ltd. on this list?
Investing in stocks requires a comprehensive research: you should carefully study all the available data, e.g. company's financials, related news, and its technical analysis. So Delek Group Ltd. technincal analysis shows the buy rating today, and its 1 week rating is buy. Since market conditions are prone to changes, it's worth looking a bit further into the future — according to the 1 month rating Delek Group Ltd. stock shows the neutral signal. See more of Delek Group Ltd. technicals for a more comprehensive analysis.
If you're still not sure, try looking for inspiration in our curated watchlists.
If you're still not sure, try looking for inspiration in our curated watchlists.
EBITDA measures a company's operating performance, its growth signifies an improvement in the efficiency of a company. Delek Group Ltd. EBITDA is 2.86 B USD, and current EBITDA margin is 73.30%. See more stats in Delek Group Ltd. financial statements.