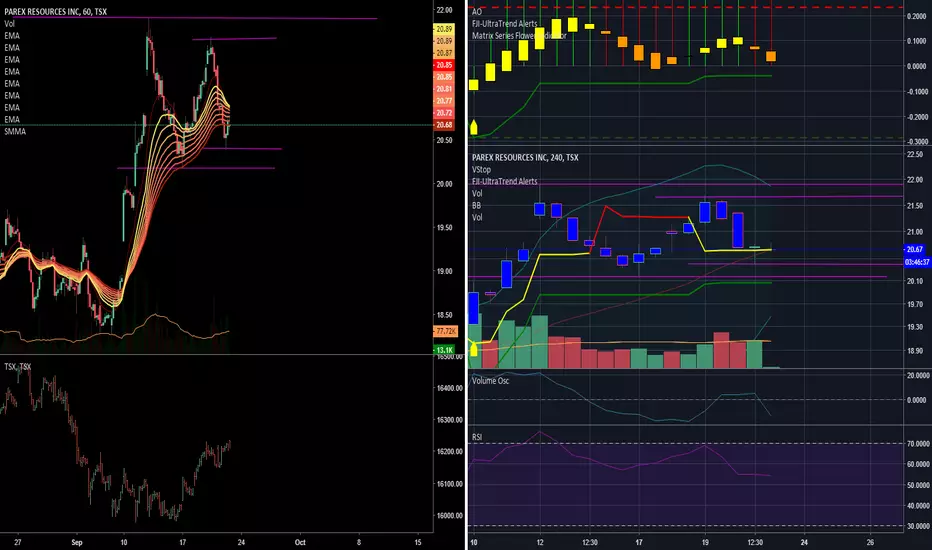
PXT Breakout
PXT came up on my screener and I wanted to share some ideas about a possible breakout strategy.
My first attempt at looking at Fibonacci levels. So please shoot me some messages on how I can tweak this a little better.
Firstly, we are in an uptrend and currently trading above 180 & 200 Day
Next report date
Report period
Q1 2024
EPS estimate
0.75USD
Revenue estimate
—
4.41USD
467.73 MUSD
1.19 BUSD
100.77 M
About Parex Resources, Inc.
Sector
Industry
CEO
Imad Mohsen
Website
Headquarters
Calgary
Employees (FY)
449
Founded
2009
FIGI
BBG000QJFK71
Parex Resources, Inc. engages in the exploration, development, and production of crude oil. It operates thorough the Canada and Colombia geographical segments. Its operating reserves include, Llanos, and lower and middle Magdalena. The company was founded on August 17, 2009 and is headquartered in Calgary, Canada.

Parex Resources - Stock Pick of the DayTightening ranges with a bullish recovery expected with Oil prices. Political instability in the middle east, set along side effects from recent hurricane should drive prices higher. Current Price point at lowest point of said price range. Expect 5 - 8% return on investment in the near term.
Strong Buy - Oversold Guru AccumulatingOversold and ready for the bounce. Guru Investments are accumulating at the current price levels. Stock poised for substantial short term gains once price point of 19.33 $ ps is reached. Consolidation is currently happening. 35$ price target on PXT. I expect tomorrow on open we will see a surge in

Bullish Break Inbound.Stock will bounce off recent lows and climb back to more realistic levels. Earnings #'s beat street expectations by plus 61%. Growth outpacing company expectations.

See all ideas
Trade directly on the supercharts through our supported, fully-verified and user-reviewed brokers.


Frequently Asked Questions
The current price of PARXF is 17.81 USD — it has increased by 0.68% in the past 24 hours.
Depending on the exchange, the stock ticker may vary. For instance, on OTC exchange Parex Resources, Inc. stocks are traded under the ticker PARXF.
Parex Resources, Inc. is going to release the next earnings report on May 8, 2024. Keep track of upcoming events with our Earnings Calendar.
PARXF stock is 2.06% volatile and has beta coefficient of 0.66. Check out the list of the most volatile stocks — is Parex Resources, Inc. there?
PARXF earnings for the last quarter are 1.13 USD per share, whereas the estimation was 0.89 USD resulting in a 26.97% surprise. The estimated earnings for the next quarter are 1.05 USD per share. See more details about Parex Resources, Inc. earnings.
Parex Resources, Inc. revenue for the last quarter amounts to 384.00 M USD despite the estimated figure of 418.60 M USD. In the next quarter revenue is expected to reach 427.90 M USD.
Yes, you can track Parex Resources, Inc. financials in yearly and quarterly reports right on TradingView.
PARXF stock has risen by 3.19% compared to the previous week, the month change is a 11.97% rise, over the last year Parex Resources, Inc. has showed a 15.91% decrease.
PARXF net income for the last quarter is 137.48 M USD, while the quarter before that showed 118.22 M USD of net income which accounts for 16.30% change. Track more Parex Resources, Inc. financial stats to get the full picture.
Today Parex Resources, Inc. has the market capitalization of 1.83 B, it has increased by 0.17% over the last week.
Yes, PARXF dividends are paid quarterly. The last dividend per share was 0.28 USD. As of today, Dividend Yield (TTM)% is 6.19%. Tracking Parex Resources, Inc. dividends might help you take more informed decisions.
Parex Resources, Inc. dividend yield was 6.01% in 2023, and payout ratio reached 25.71%. The year before the numbers were 4.42% and 12.70% correspondingly. See high-dividend stocks and find more opportunities for your portfolio.
Like other stocks, PARXF shares are traded on stock exchanges, e.g. Nasdaq, Nyse, Euronext, and the easiest way to buy them is through an online stock broker. To do this, you need to open an account and follow a broker's procedures, then start trading. You can trade Parex Resources, Inc. stock right from TradingView charts — choose your broker and connect to your account.
As of Apr 26, 2024, the company has 449.00 employees. See our rating of the largest employees — is Parex Resources, Inc. on this list?
Investing in stocks requires a comprehensive research: you should carefully study all the available data, e.g. company's financials, related news, and its technical analysis. So Parex Resources, Inc. technincal analysis shows the buy rating today, and its 1 week rating is buy. Since market conditions are prone to changes, it's worth looking a bit further into the future — according to the 1 month rating Parex Resources, Inc. stock shows the buy signal. See more of Parex Resources, Inc. technicals for a more comprehensive analysis.
If you're still not sure, try looking for inspiration in our curated watchlists.
If you're still not sure, try looking for inspiration in our curated watchlists.
We've gathered analysts' opinions on Parex Resources, Inc. future price: according to them, PARXF price has a max estimate of 24.14 USD and a min estimate of 19.75 USD. Read a more detailed Parex Resources, Inc. forecast: see what analysts think of Parex Resources, Inc. and suggest that you do with its stocks.
EBITDA measures a company's operating performance, its growth signifies an improvement in the efficiency of a company. Parex Resources, Inc. EBITDA is 813.31 M USD, and current EBITDA margin is 68.28%. See more stats in Parex Resources, Inc. financial statements.