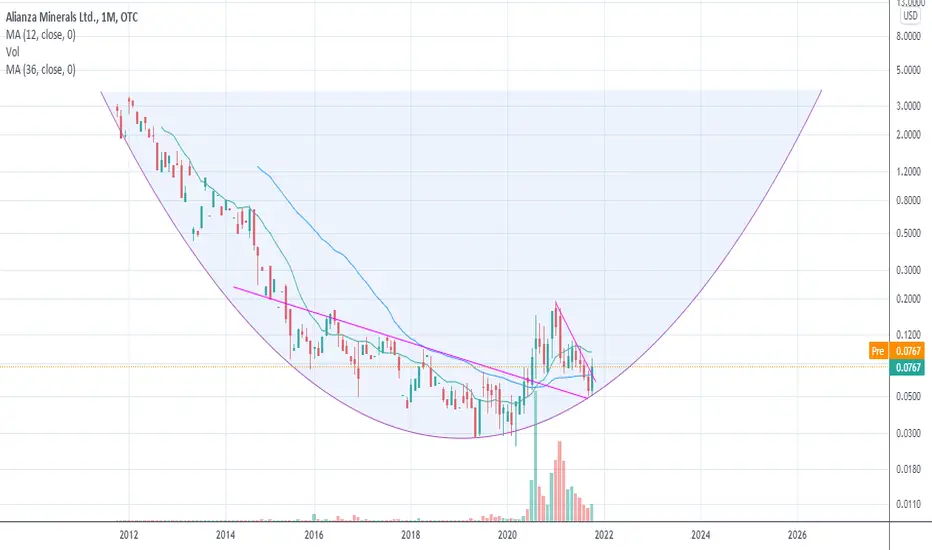
SNAGThis is an update of my previous idea on Alianza Minerals .
The company changed it's name to Silver North and changed the symbol to SNAG .
I 100% support this decision and commend the management for their forward looking attitude .
If silver continues on it's bullish trajectory as i expect it to
−0.0190USD
−585.23 KUSD
27.15 M
About SILVER NORTH RESOURCES LTD
Sector
Industry
CEO
Jason S. Weber
Website
Headquarters
Vancouver
Founded
2005
FIGI
BBG000QKB236
Silver North Resources Ltd. engages in the acquisition and exploration of mineral properties It operates through the following geographical segments: U.S.A., Peru, and Canada. The company was founded on October 21, 2005 and is headquartered in Vancouver, Canada.

Trade directly on the supercharts through our supported, fully-verified and user-reviewed brokers.


Frequently Asked Questions
The current price of TARSF is 0.1344 USD — it has decreased by 4.00% in the past 24 hours. Watch SILVER NORTH RESOURCES LTD. stock price performance more closely on the chart.
Depending on the exchange, the stock ticker may vary. For instance, on OTC exchange SILVER NORTH RESOURCES LTD. stocks are traded under the ticker TARSF.
TARSF stock is 4.17% volatile and has beta coefficient of −1.88. Track SILVER NORTH RESOURCES LTD. stock price on the chart and check out the list of the most volatile stocks — is SILVER NORTH RESOURCES LTD. there?
Yes, you can track SILVER NORTH RESOURCES LTD. financials in yearly and quarterly reports right on TradingView.
TARSF stock has risen by 16.67% compared to the previous week, the month change is a 61.34% rise, over the last year SILVER NORTH RESOURCES LTD. has showed a 49.33% increase.
TARSF net income for the last quarter is −131.65 K USD, while the quarter before that showed −340.40 K USD of net income which accounts for 61.32% change. Track more SILVER NORTH RESOURCES LTD. financial stats to get the full picture.
Today SILVER NORTH RESOURCES LTD. has the market capitalization of 4.58 M, it has increased by 6.76% over the last week.
No, TARSF doesn't pay any dividends to its shareholders. But don't worry, we've prepared a list of high-dividend stocks for you.
Like other stocks, TARSF shares are traded on stock exchanges, e.g. Nasdaq, Nyse, Euronext, and the easiest way to buy them is through an online stock broker. To do this, you need to open an account and follow a broker's procedures, then start trading. You can trade SILVER NORTH RESOURCES LTD. stock right from TradingView charts — choose your broker and connect to your account.
TARSF reached its all-time high on Jan 13, 2012 with the price of 17.2250 USD, and its all-time low was 0.000005 USD and was reached on Mar 13, 2023. View more price dynamics on TARSF chart.
See other stocks reaching their highest and lowest prices.
See other stocks reaching their highest and lowest prices.
Investing in stocks requires a comprehensive research: you should carefully study all the available data, e.g. company's financials, related news, and its technical analysis. So SILVER NORTH RESOURCES LTD. technincal analysis shows the buy rating today, and its 1 week rating is buy. Since market conditions are prone to changes, it's worth looking a bit further into the future — according to the 1 month rating SILVER NORTH RESOURCES LTD. stock shows the neutral signal. See more of SILVER NORTH RESOURCES LTD. technicals for a more comprehensive analysis.
If you're still not sure, try looking for inspiration in our curated watchlists.
If you're still not sure, try looking for inspiration in our curated watchlists.