OWL LongDemand Zone
Long entry 15
Stop 14.5
Target 21, 24
Risk management is much more important than a good entry point.
I am not a PRO trader.
In my trading plan, the Max Risk of each short term trade should be less than 1% of an account.
Key facts today
Next report date
—
Report period
—
EPS estimate
—
Revenue estimate
—
0.08 USD
109.58 M USD
2.30 B USD
623.11 M
About Blue Owl Capital Inc.
Sector
Industry
Website
Headquarters
New York
Founded
2009
IPO date
Oct 23, 2020
Identifiers
3
ISIN US09581B1035
Blue Owl Capital, Inc. operates as an alternative asset management firm. It provides investors access to asset management capital solutions through its Direct Lending and GP Capital Solutions products. The company offers a platform of capital solutions to both middle market companies and large alternative asset managers. The company was founded by Doug Irving Ostrover, Michael Rees and Craig W.Packer in 2009 and is headquartered in New York, NY.
Related stocks

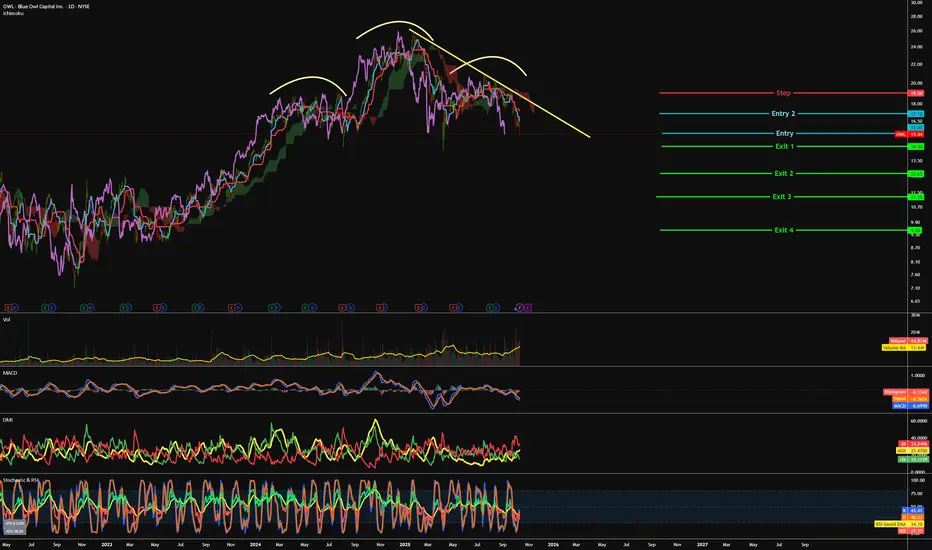
OWL - Diving down initiated=======
Volume
=======
-Increasing
==========
Price Action
==========
- Head and shoulders noticed
- rounding top noticed on the 2nd shoulder
- unable to clear downtrend line
=================
Technical Indicators
=================
- Ichimoku
>>> price below cloud and resisted below trendline
>>>
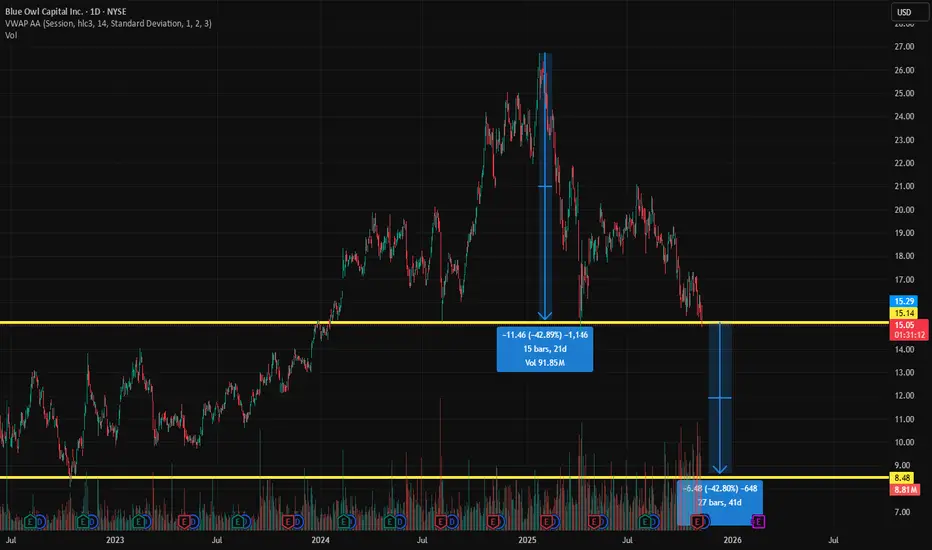
Blue Owl Capital - a perfect short setup with target $8-9Private credit has been blowing up left and right, with widespread impact starting with the Tricolor implosion and it's implications for Auto Loans and other high flying garbage associated with that industry like CVNA and KMX.
But I don't think the contagion stops there.
OWL puts are cheap here an
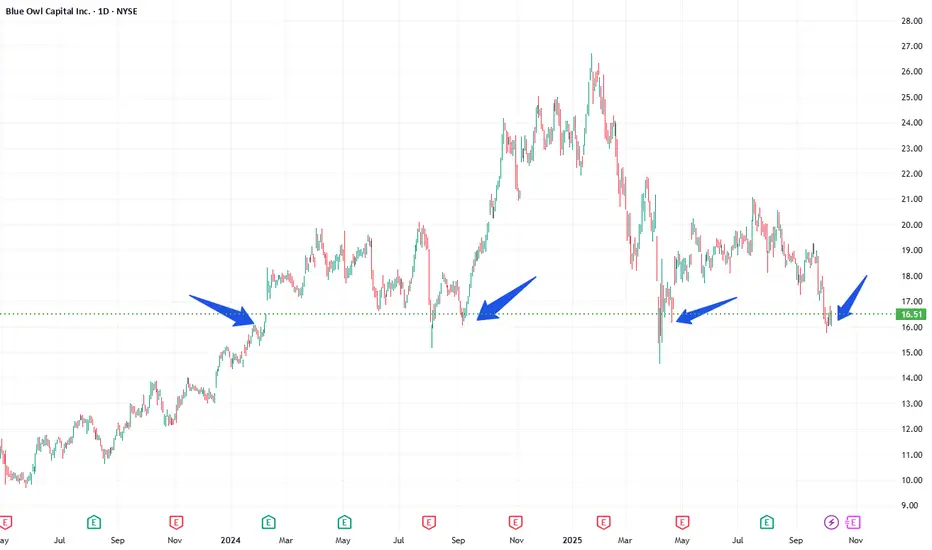
OWL at multi year lows I think it has potential to attain new highs and give very good dividend . Investing in IT infrastructure in middle east .
Very good support at 16
Hold Long
I am not financial advisor
Will OWL go up after bounce?Sentiment is bearish and price is going down however, support at 9.54 might be where this stock bounces. If it follows the last support bounce at 9.54 and breaks through the downward channel stock could go to around 11.29 or to previous higher resistance at 13.08.

$OWL with a Bearish outlook following its earnings #Stocks The PEAD projected a Bearish outlook for $OWL after a Negative Under reaction following its earnings release placing the stock in drift D.

Head and Shoulders Visible on Weekly I will be targeting the 1.618 Fib Extension on this one and Buying the Quarterly and Yearly Puts at the 10 dollar strike.


OWL, Bought todays pullback with entry on smaller 5m timeframe I bought this because the effort of todays candle does not match the result , we have a volume anomaly and I think that OWL is being manipulated today by smart money, pushing the share price on low volume so they can add. On the 5 min chart we can see stopping volume come in and selling absorbed on


See all ideas
Summarizing what the indicators are suggesting.
Neutral
SellBuy
Strong sellStrong buy
Strong sellSellNeutralBuyStrong buy
Neutral
SellBuy
Strong sellStrong buy
Strong sellSellNeutralBuyStrong buy
Neutral
SellBuy
Strong sellStrong buy
Strong sellSellNeutralBuyStrong buy
An aggregate view of professional's ratings.
Neutral
SellBuy
Strong sellStrong buy
Strong sellSellNeutralBuyStrong buy
Neutral
SellBuy
Strong sellStrong buy
Strong sellSellNeutralBuyStrong buy
Neutral
SellBuy
Strong sellStrong buy
Strong sellSellNeutralBuyStrong buy
Displays a symbol's price movements over previous years to identify recurring trends.
OWL5356683
Blue Owl Finance LLC 3.125% 10-JUN-2031Yield to maturity
7.02%
Maturity date
Jun 10, 2031
OWL5917235
Blue Owl Finance LLC 4.125% 07-OCT-2051Yield to maturity
6.68%
Maturity date
Oct 7, 2051
OWL5812252
Blue Owl Credit Income Corp. 6.6% 15-SEP-2029Yield to maturity
6.53%
Maturity date
Sep 15, 2029
OWL6070305
Blue Owl Credit Income Corp. 5.8% 15-MAR-2030Yield to maturity
6.34%
Maturity date
Mar 15, 2030
OWL5798251
Blue Owl Credit Income Corp. 6.65% 15-MAR-2031Yield to maturity
6.31%
Maturity date
Mar 15, 2031
OWL5890600
Blue Owl Credit Income Corp. 5.8% 15-MAR-2030Yield to maturity
6.28%
Maturity date
Mar 15, 2030
OWL6070303
Blue Owl Credit Income Corp. 6.6% 15-SEP-2029Yield to maturity
6.04%
Maturity date
Sep 15, 2029
OWL5929617
Blue Owl Finance LLC 6.25% 18-APR-2034Yield to maturity
5.99%
Maturity date
Apr 18, 2034
OWL5272605
Blue Owl Finance LLC 4.125% 07-OCT-2051Yield to maturity
5.97%
Maturity date
Oct 7, 2051
OWL5360293
Blue Owl Finance LLC 4.375% 15-FEB-2032Yield to maturity
5.92%
Maturity date
Feb 15, 2032
OWL5197295
Blue Owl Finance LLC 3.125% 10-JUN-2031Yield to maturity
5.63%
Maturity date
Jun 10, 2031
See all OWL bonds
Frequently Asked Questions
The current price of OWL is 11.63 USD — it has decreased by −7.40% in the past 24 hours. Watch Blue Owl Capital Inc. stock price performance more closely on the chart.
Depending on the exchange, the stock ticker may vary. For instance, on NYSE exchange Blue Owl Capital Inc. stocks are traded under the ticker OWL.
OWL stock has fallen by −24.39% compared to the previous week, the month change is a −28.83% fall, over the last year Blue Owl Capital Inc. has showed a −52.39% decrease.
We've gathered analysts' opinions on Blue Owl Capital Inc. future price: according to them, OWL price has a max estimate of 27.00 USD and a min estimate of 16.25 USD. Watch OWL chart and read a more detailed Blue Owl Capital Inc. stock forecast: see what analysts think of Blue Owl Capital Inc. and suggest that you do with its stocks.
OWL stock is 13.97% volatile and has beta coefficient of 1.73. Track Blue Owl Capital Inc. stock price on the chart and check out the list of the most volatile stocks — is Blue Owl Capital Inc. there?
Today Blue Owl Capital Inc. has the market capitalization of 8.02 B, it has decreased by −7.60% over the last week.
Yes, you can track Blue Owl Capital Inc. financials in yearly and quarterly reports right on TradingView.
Blue Owl Capital Inc. is going to release the next earnings report on Apr 30, 2026. Keep track of upcoming events with our Earnings Calendar.
OWL earnings for the last quarter are 0.24 USD per share, whereas the estimation was 0.22 USD resulting in a 6.93% surprise. The estimated earnings for the next quarter are 0.20 USD per share. See more details about Blue Owl Capital Inc. earnings.
Blue Owl Capital Inc. revenue for the last quarter amounts to 701.47 M USD, despite the estimated figure of 711.77 M USD. In the next quarter, revenue is expected to reach 715.99 M USD.
OWL net income for the last quarter is 6.31 M USD, while the quarter before that showed 17.43 M USD of net income which accounts for −63.79% change. Track more Blue Owl Capital Inc. financial stats to get the full picture.
Yes, OWL dividends are paid quarterly. The last dividend per share was 0.22 USD. As of today, Dividend Yield (TTM)% is 7.09%. Tracking Blue Owl Capital Inc. dividends might help you take more informed decisions.
Blue Owl Capital Inc. dividend yield was 2.92% in 2024, and payout ratio reached 346.59%. The year before the numbers were 3.69% and 483.73% correspondingly. See high-dividend stocks and find more opportunities for your portfolio.
As of Feb 5, 2026, the company has 1.1 K employees. See our rating of the largest employees — is Blue Owl Capital Inc. on this list?
EBITDA measures a company's operating performance, its growth signifies an improvement in the efficiency of a company. Blue Owl Capital Inc. EBITDA is 861.59 M USD, and current EBITDA margin is 41.65%. See more stats in Blue Owl Capital Inc. financial statements.
Like other stocks, OWL shares are traded on stock exchanges, e.g. Nasdaq, Nyse, Euronext, and the easiest way to buy them is through an online stock broker. To do this, you need to open an account and follow a broker's procedures, then start trading. You can trade Blue Owl Capital Inc. stock right from TradingView charts — choose your broker and connect to your account.
Investing in stocks requires a comprehensive research: you should carefully study all the available data, e.g. company's financials, related news, and its technical analysis. So Blue Owl Capital Inc. technincal analysis shows the sell today, and its 1 week rating is strong sell. Since market conditions are prone to changes, it's worth looking a bit further into the future — according to the 1 month rating Blue Owl Capital Inc. stock shows the strong sell signal. See more of Blue Owl Capital Inc. technicals for a more comprehensive analysis.
If you're still not sure, try looking for inspiration in our curated watchlists.
If you're still not sure, try looking for inspiration in our curated watchlists.