Short term Gold outlook Bodies respecting C.E of H1 FVG away from H4 FVG. expecting downwards momentum in New York Session
AU1! trade ideas

Gold Long Term Outlook Predicting Bearish Dollar Index, So believing in the strength of gold, Watching for SMT with silver to confirm longs from the Monthly FVG

GC/Gold 1H Buy Idea 6/15/24Price has broken the trendline and has now retested on the other side with a hammer forming as the market closed. Looking for price to continue bullish into next week.
Keep in mind that price could very well break below the trendline again to form a M with the double top that is possibly forming as well. BUT I'm leaning more towards the buy because of price currently coming to the 1/4H Highs from 6/12/24
**This is for educational purposes only and this is not financial advice because I am not a financial advisor.**

back testing king aaronfilled the liquidity, with a bullish to the upside. broke and retested the trendline and proceeded to the upside and the consolidation came afterwards

Can the HOUSE CAPITALIZE LONG above 4Hr Swing EQ Level...?COMEX:GC1!
"I hated every minute of Training, But I said, 'DONT QUIT'! Suffer now and live the rest of your life as a CHAMPION." -Muhammad ALI
This is a simple TXT-Book break N re-test PLAY LONG above 4Hr Swing EQ and targeting the next Minor S&R Level ($2376.0)....
I want to see price break the 1Hr Supply Zone and above the 4Hr Swing EQ Level ($2355.0). I want to see 30m Candle closures above EQ/1Hr Supply & above the Liquidity Trendline, to clarify strong conviction from buyers to go LONG!!!
Remember when it comes to FRM (Financial Risk Management) our job is to manage the downside costs of printing High side returns of $$$ consistently... Let's Step!!
Stay Focused & Reach Excellence!!
#BHM500K #NewERA #Champions

Crossover strategy for shortsThis is my goto setup for short or long. This just happens to have set up for gold short starting next week. 4 prerequisites: short moving average crosses below long moving average, price falls and then recovers to touch the slower moving average, price closes below the body of the previous candle, then hopefully prices pulls back again to allow one to get a better price for shorts. All prerequisites have been met, so I am looking for traction to the short side on gold for Monday at least, possibly persisting into midweek.

GOLD 2-week ProjectionGold sitting at major support level inside a trading range on the daily chart but where will it go from here in the next few days? Price currently trading inside a downward channel/wedge. Will we get some momentum to push higher? The beginnings of a possible butterfly pattern starting to form indicating a bullish move up to the top of the trendline with a chance to fake out long and continue down to a key fib level before breaking out again or continuing its price action inside the wedge.

I'm back.XAUUSD has risen beyond the expectations of many, it has stayed strong and the trend has not changed. Let me predict every turn it takes and follow my channel again.

GOLD SPOT UPDATE AHEAD FED POLICY EDU PUR.gold spot stya abv 2330 looks 2340-45$ where support 2325 if blw thna again dwn side mark will start till 2300+++++ in mcx 71900 abv looks 772200-300 possible

Gold Futures Technical Analysis - 15M Chart
Hey traders, here’s the scoop on Gold Futures:
The price is currently trading around $2,329.5, just below the 21 EMA (yellow line at $2,332.7), indicating potential bearish momentum on this timeframe.
There’s a recent downward movement with the price testing the trendline support.
Entry Strategy:
Short Position: Look for a pullback to the 21 EMA ($2,332.7) and ensure a strong bearish candle closes below this level. That’s your potential entry point confirming bearish momentum.
Long Position: If the price holds above $2,329.3 and breaks above the 21 EMA, look for a strong bullish candle as confirmation for a potential long entry.
🎯 Profit Targets:
Short Targets:
Target 1: $2,329.3
Target 2: $2,311.8
Long Targets:
Target 1: $2,345.1
Stop-Loss:
For shorts, set your stop-loss just above $2,332.7.
For longs, set your stop-loss just below $2,329.3.

Gold: One Last ClimbWe expect the gold price to rise once again. We expect the high of the turquoise-colored wave B to occur in our same-colored Target Zone (between $2510 and $2631). After that, the price should sell off significantly. If, on the other hand, there is an early fall below the support at $2285 (45% likely), we will see the price already in the descent now.

Can Gold Futures Hold Support?Technical Momentum Weakens
Gold Futures hit an all-time high on May 20th, 2024, at $2,454; since then, they have corrected and consolidated. From a long-term perspective, futures give us a mixed signal, recently dropping below the 50-DMA at $2,373 but remaining well above the 200-DMA at $2,153. The technical perspective shows momentum studies decreasing, with stochastics correcting back into oversold territory and DMI—just above DMI+. Short-term traders continue to monitor the 9-day moving average, trading below the 18-day moving average. At the same time, the Average True Range sits at $37/day.
Tailwinds Continue to Develop
With an 8% chance of a July rate cut, according to the CME FedWatch Tool, traders are focused on September; swaps are pricing in a 54% chance that the Fed will make its first interest rate hike in the cycle.
Geopolitical tensions, rampant fiscal spending, and central bank buying have been the main drivers and have significantly propelled Gold prices in 2024.
Industrial Metals Strengthen
The performance in the Precious Metals space remains robust and has continued to spill into the industrial complex, a testament to the strength of this sector. Traders continue to monitor manufacturing, Chinese Economic data, and the U.S. economy, which have recently driven copper futures back over $4.50/pound and Silver over $29.50/oz.
www.tradingview.com
CME Real-time Market Data help identify trading set-ups and express my market views. If you have futures in your trading portfolio, you can check out on CME Group data plans available that suit your trading needs
Disclaimers
*Trade ideas cited above are for illustration only, as an integral part of a case study to demonstrate the fundamental concepts in risk management under the market scenarios being discussed. They shall not be construed as investment recommendations or advice. Nor are they used to promote any specific products, or services.
Futures trading involves substantial risk of loss and may not be suitable for all investors. Trading advice is based on information taken from trade and statistical services and other sources Blue Line Futures, LLC believes are reliable. We do not guarantee that such information is accurate or complete and it should not be relied upon as such. Trading advice reflects our good faith judgment at a specific time and is subject to change without notice. There is no guarantee that the advice we give will result in profitable trades. All trading decisions will be made by the account holder. Past performance is not necessarily indicative of future results.

GOLD reversal patternPossible head and shoulder pattern. Not in a trade yet as I will look at lower timeframes to time my entry and get a more feasible RRR. However in trading I consider all possible setups the price can make and if the pattern don't play out as classic technical analysis I will look at the Symmetrical triangle and trade it as an alternative.

Gold Finishing Wave C of either a Flat or Triangle
Gold appears to be finishing wave C of either a flat or a triangle, although it's too early to say which one with any degree of confidence. If prices form a flat, gold should roughly follow the blue line. If they form a triangle, it should roughly follow the yellow line, creating another set of waves up and down before the next climb.

6/9 | $GCNot much for me to do since the last update on Gold. From the initial breakout, we anticipated a new high would be created before a pullback to retest demand. Now that we are back lower, I would like to see gold start to form a base for a move back to highs potentially. Watching $2300.

It's a good time to accumulate!In recent sessions, gold, which has always appreciated during periods of falling interest rates, would seem to tell us that an increase of fed funds is more plausible than a decrease. This movement is likely due to better-than-expected US employment data. We cannot predict when and if rates will be cut but I think it is a good time to accumulate shares of Gold ETCs for a good profit margin when, sooner or later, rates are cut! Stay tuned

S Aug gold at 2333.3 on stop, if filled target 2307.6, stop 2376
Gold rally looks tired and a correction, maybe short term is possible. Sell Aug gold at 2333.3 on stop, if filled target is 2307.6, stop is 2376.6

GC1: Buy ideaBuy idea on GC1 as you see on the chart because we have a spring effect on vwap and also we have the breakout with force the resistance line.

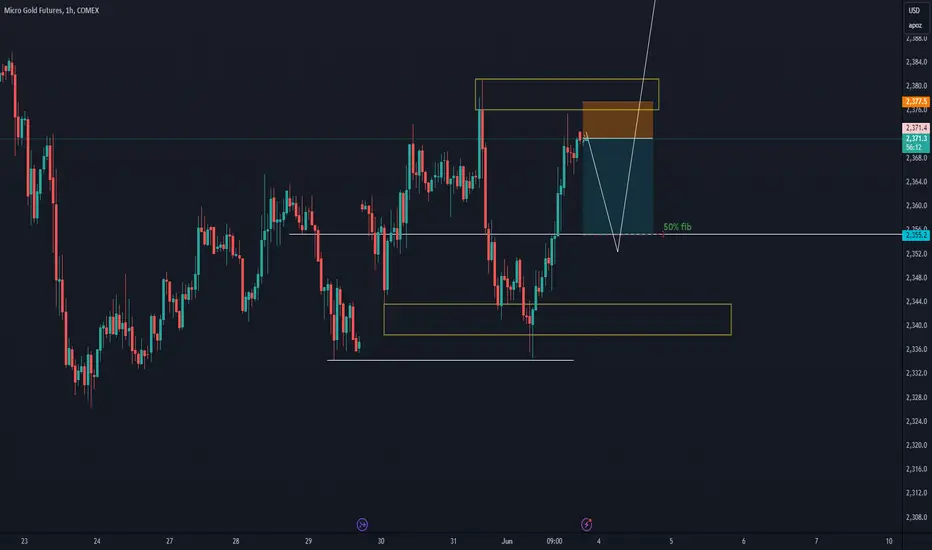
GOLDThis is not a trading signal, its just my opinion , if you copy the trade its on your own risk.
This trade we are taking on the hourly chart, quick trade with short stop loss.
Trading the bull back before the rally upwards.
taking the target at fib 50% considering the fair value gap the should be covered on the hourly frame.
GOLDThis is not a trading signal, its just my opinion , if you copy the trade its on your own risk.
Gold . daily chart still signalling bullish market as the trend is bullish , we expect the next target is around $ 2405 and if that gets broken then it will rally up towards the $2454
so far we expect retest to resistance at $2355 and then continuation to the target.
this analyses valid for only this week.

Gold shining on the "UPSIDE"Gold has been trending strongly on the higher time frames and seems like it still has a lot of room to move to the upside. We will wait patiently for the pullback on the 4hour chart demand zone that has been created. We should expect to see another leg to the upside on Gold.

a daily price action after hour update - goldGood Evening and I hope you are well.
Gold
comment: 2350 is the big line in the sand for both sides. Bears did it big time by closing below the big bull trend line from March and consecutive daily closes below the 20ema. Problem for them is, 2300 - 2350 was huge support for 2 months now and I doubt bears can break it that easily. My bear channel from the weekly outlook is still valid though.
current market cycle: tight trading range
key levels: 2350 - 2380
bull case: Big support 2300-2350 and bulls need a daily close above the ema (2380) again. Right now they have not shown strength but neither have the bears or we would have traded lower already.
Invalidation is below 2300.
bear case: Bears see this as a small pull-back in the new bear trend (started with the double top on the daily chart) down to 2170-2200. They need much bigger selling pressure to get below 2300 though.
Invalidation is above 2390.
short term: Completely neutral inside given range.
medium-long term: For now I think the most reasonable outlook I could give is a trading range 2200-2450. This could hold for some time. Bear in my still thinks this rally is dumb and we will see 2000 again this year but that’s as unreasonable of an outlook one could hold so DON’T.
current swing trade: None
trade of the day: Long low of last week 2349 after bar 3 (signal bar) - bar 4 = entry bar
