The Silver bullrun coming to an end?Silver has printed very clear bullish Wolfe Waves on the weekly and monthly charts and it has reached the target of this wave pattern which also coincides with a hefty supply order block / resistance.
Something to take into consideration.
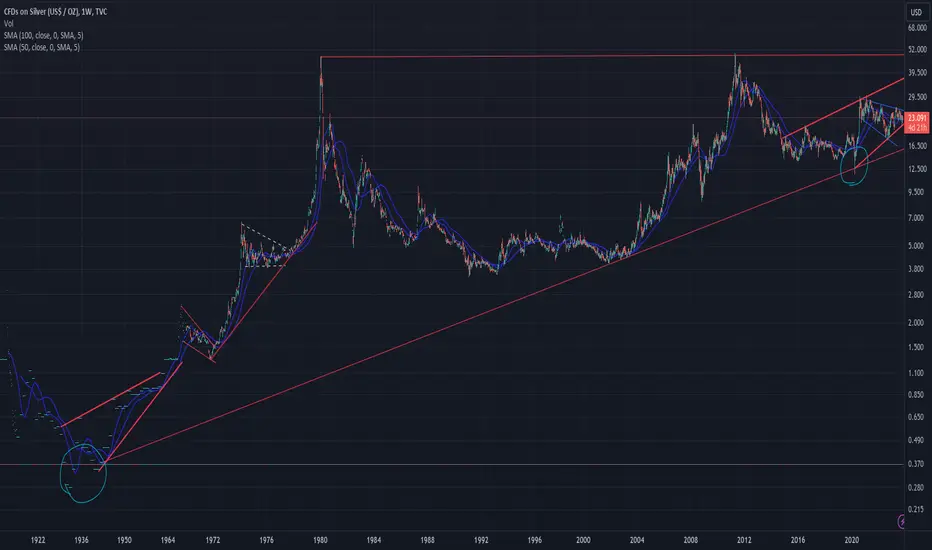
SILVER trade ideas

Silver price on the way back to $30?Silver price broke strong resistance $30 first time ever since 2020.
Strong support are now holding at $30, predict will be forming more new highs after US presidential election 2024.

SILVER DAILY OUTLOOKT&C's: Trading leveraged products such CFDs on forex and derivatives may not be suitable for all investors as they carry a high level of risk to your invested capital. Please ensure that you fully understand the risks involved, taking into account your objectives, risk tolerance and level of experience, before deciding whether to trade.

XAGUSD 1M Oanda ShortThe nature of the precious metals market appears bearish with a sharp move into wave (3) down. Take heed from here until 2027.
XAG/USD is how silver is labeled for spot trading on the foreign exchange market. Silver (XAG) is traded against the US dollar (USD), so its price shows how much one ounce of silver is worth in USD.

silver Silver broke and tested resistance 1 in the Fibonacci channel. Its new target will be 1.618 Fibonacci resistance.

XAGUSD. Weekly trading levels 13 - 17.05.2024We continue the experiment with a wider range of zones. Let's see if we can guess the places to search for deals for the week ahead.
During the week you can trade from these price levels. Finding the entry point into a trade is up to you, depending on your trading style and the development of the situation.
If you expect any medium-term price movements, then most likely they will start from one of the zones.
Levels are valid for a week, the date is in the title. The next morning I adjust the levels based on the new data and publish a new post.
The history of level development can be seen in my previous posts. They cannot be edited or deleted. Everything is fair. :)
----------------------------------------------
Levels are drawn based on volumes and data from CME. Used as areas of interest for trade. When approaching a level, a “reaction” is expected, which can be traded for both a rebound and a breakout. The worst option is if we revolve around the level in a flat.
Do not reverse the market at every level; if there is a trend movement, consider it as an opportunity to enter into a continuation of the movement. Until the price has drawn a reversal pattern.
Don’t forget to like Rocket, Comments and Subscribe!!!

still years for a breakoutSilver in its 3rd congestion phase.
I estimate another 5 years of sideways
movement before a giant break out.
markets even though manipulated will find their true
value in the end. just like the housing market worldwide is centrally planned. Eventually it will crash and burn.
while some people hold 5 houses and others rent for life.
real wealth comes from living a good life and having good
health and not from renovating houses and conspicuous consumption.

$50 Silver"Decade of zero returns" for the stock market = Shortening Bear Market for Commodities
Price target = $50
Fractal backbone + Room in technicals for such move.
Price target was established in June 2021.
Time frame pushed up in anticipation of 2023 bear.

XAGUSD BREAKOUT LOOKING GOODGlobal Currencies weakening to the petrol dollar, Petrol dollar is not looking like the safe haven anymore, SILVER and Gold always saves the man.

SILVER - Contraction Then Pump Into Bull MarketSILVER
Ok so I often joke about how slow Silver is but considering how Gold is moving I think this is worth picking some up here.
I think the way to best understand this area is that the bowled dump and recovery is Wyckoff CHoCH Change of Character.
Notice how before that point price action is quite noisy and wobbly.
But after there is a fairly tight 3 wave pattern; back up.
And that is followed by a contraction pattern that has lasted almost a year.
Having spent so long in contraction and having maintained this overall area for such a long time; Silver may be due a pop and it could be the start of a bull market
I like SILVER over GOLD because it appears to have some amount of protection within the contraction area.
And so currently it doesn't look like it will dip below $22 unless there is another downside shakeout.
So I have made an entry here and may buy more down the road 👍.
Not advice

Physical Commodity Scarcity and DemandThe further I look back on the Silver chart, the more I am convinced of this scenario (though it is not guaranteed), and I see $27.70 (ish) as a strong support level. If it holds, I see ~$33 as the next movement.
I go strictly by the charts. Politics and Monetary Policy could affect this scenario GREATLY.
DYOR.
Trade Slick.

SILVER - Bullish Hammer @ Support SILVER
I bought the dip and re-entered silver at support with a limit entry as we looked at before...
It printed a bullish hammer / dragonfly doji with buy pressure coming in @ support.
It looks good here and both gold and silver are in lower time frame descending wedges.
The correction may extend but this could also just carry on up from here into a very wild uptrend 👍.
Not advice

Cup-ceptionThere's a multi-year cup and handle within the multi-decade cup and handle on $SLV.. Hang on tight gang. AMEX:AGQ is going to the power of AMEX:SLV
ref prev:

If it pulback to the D1 IFVG midpoint I will take a long tradeSilver is forming a nice setup. I would like to see a pullback to the D1 FVG / BPR midpoint where I would like to take a long trade and I think they could support the price for the further move up.
COT Data looks bullish to
Always follow these rules
- Accumulation / Manipulation / Distribution
- No liquidity raid = No trade
- Never buy high and never sell low
“Adapt what is useful, reject what is useless, and add what is specifically your own.”
Dave FX Hunter ⚔

Silver: Potential Double Top Formation Signaling a DowntrendI'm observing a potential double top forming in the silver market at the 29.85 level. This pattern is typically a bearish reversal signal, indicating that silver might be poised for a downward move.
Trade Details:
Pattern: Double top at 29.85
Potential Target: 24.12
Technical Analysis:
Double Top Formation (29.85): The price action (PA) shows that silver has tested the 29.85 resistance level twice, failing to break above it. This creates a double top pattern, a common reversal signal in technical analysis.
Neckline and Confirmation: The neckline of this double top pattern is around the 26.50 level. A decisive break below this neckline would confirm the pattern and likely accelerate the bearish momentum.
Target Projection (24.12): Based on the height of the double top pattern (from the peak at 29.85 to the neckline around 26.50), we project a potential target at 24.12. This level aligns with previous support zones, making it a logical target for the downward move.
Supporting Factors:
Bearish Divergence: Potential bearish divergence on the RSI/MACD indicators could add strength to the bearish case if observed.
Market Sentiment: Current market conditions and sentiment could influence the extent of the move. If the broader market turns risk-off, it could further pressure silver prices.
Fundamental Analysis: Monitor economic indicators, particularly inflation data and Federal Reserve policies, as they can impact precious metals significantly.

Silver breaking out of its consolidationSilver is breaking out its long term consolidation and triggering a bullish reversed Head & Shoulder pattern with a target in the $42.50 area.
Next resistances at the all time high near $50 then the line linking the top of the channel near $53.
A break below $23.50 would invalidate this view.
________________
With gold and copper making all time highs, the governments and central banks printing money like crazy, it's hard to believe that Silver won't catch up and eventually make new all time highs.


Silver After 11 years highest weekly closing possible in #Silver
If this done then gate open for 35/40/45$. Not immediately but in near future
#forexsingnal #Commodities #silverfoxmodel #maruti

Silver After 11 years highest weekly closing possible in #Silver
If this done then gate open for 35/40/45$. Not immediately but in near future
#forexsingnal #Commodities #silverfoxmodel #maruti

Silver - How long have you waited?Silver 30 year Cup & handle break out.
Is the silver squeeze finally happening?
Credit to @EdTheLorax calling it

"Have you seen the Writing on the Wall?""Have you seen that Writing?"
Different avenues of slaughter, but slaughter nonetheless. Same Face, different guise.
40+ year cup 'n handle?
God Bless America and Israel !!!
___________________________
Multi-decade SLV Cup-and-HandleIf silver breaks above its previous highs against the dollar, it could trigger a surge in investor interest, pushing prices even higher.
If the WSB / NYSE:GME / NYSE:AMC deigns realize how much open short interest is on Silver, we could see a massive run to new ATHs for Silver per Oz. Pay attention to Derivatives like AMEX:AGQ , which touched close to $800 last time Silver was up at ~$48/oz in 2011. Be ready for fireworks if these shorts begin to feel a squeeze.

Decade long structure emerging on the Silver chartIt is interesting to study the Production/Accumulation/Distribution/Industrial Demand as well. Silver seems to hit a breaching point where physical prices have a premium about +45% for buying it and +20% for selling pure silver bullion coins. Troy oz./oz. is about 1.10, which should reflect a recomended trading price of 25.4$ per troy oune. Anybody able to buy at these prices?
Another interesting peak that was reached lately is the Gold/Silver Ratio reaching +104 lvl's, an increadable bias for gold if you look at the ratio that existed about 100 years ago, which is 10. . In less then 6 months time this ratio is today +70. This is a technical indicator for a strong bear legg starting a decade long correction for the multi decade long bull market in favour of Gold. This is the first leg down, and there is a lot of space for continued correction, bringing the price to a 'recommended equilibrium'.
Platinum as wel is comming back from an all time low Platinum to gold ratio 0.39 to the 0.6. Interestingly the platinum price is not having a ticker as far as I now that goes back for 100 years, which is the scale that the trend is carrying apparently for multiple precious metals. Chemistry table books presenting value of the pure element refer to a rule of tumb for pricing, that refered to the relative abundance of those elements before the 80's, here the Platinum over Gold ratio is documented to be 2x over multiple years, presumingly a good rule of tumb ratio of price to handle as historical mean.
It's becoming clear that there is some mechanism (or a superposition of multiple mechanisms) enables the overrepresentation of 'exchangeble silver tickets'. And it is difficult to find trustworthy data on the abundance of each element to date. Especially yearly mining reports giving estimeates that are discripant over 10 years, look at a mining report in 1992,2002;2012,2022 and the quality of these estimates seem to be worthless for what the physical reality could represent. Still in search for a good dataset, one could do a basic maximum physical element estimate by taking the continental crust elementary abundance calculation on the earth being a perfect sphere, having about 40% continental crust on it's surface, the maximal depth of a mine is one in south-africa, reaching 4km deep, however the mean depth of a mine will like be less than a km deep. you could go further and eliminate regions that are definetly not minable or mined (sahara, himalaya mountains, ..) but this is in my opinion the best approach to find the global maxima for the elements that are available on our beatiful planet.
