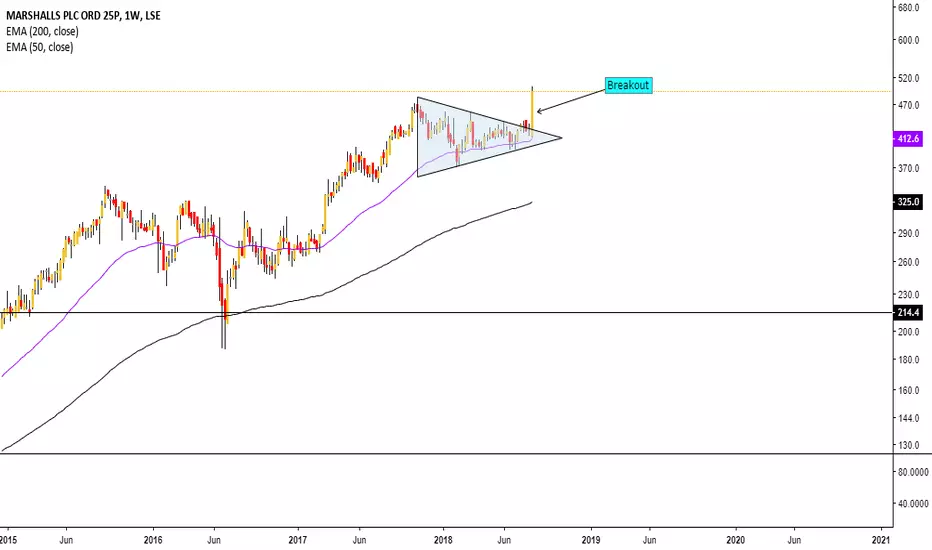
Convincing breakout for MSLH, despite "Beast from the East"Bullish, and breakout from a triangle pattern
after good results. Target of around 550p.
Next report date
Report period
H1 2024
EPS estimate
—
Revenue estimate
—
0.0850EUR
21.45 MEUR
774.13 MEUR
226.57 M
About MARSHALLS ORD GBP0.25
Sector
Industry
CEO
Matthew Pullen
Website
Headquarters
Elland
Employees (FY)
2.73 K
Founded
2004
ISIN
GB00B012BV22
FIGI
BBG00LBSMJH5
Marshalls plc is a United Kingdom based manufacturer of sustainable solutions for the built environment. It operates through three segments: Marshalls Landscape Products, Marshalls Building Products and Marley Roofing Products. The Marshalls Landscape Products segment comprises the group’s commercial and domestic landscape business, landscape protection and international businesses. Its products include paving, kerb, edgings, walling, and protective street furniture. The Marshalls Building Products segment comprises the group’s civils and drainage, bricks and masonry, mortar and screeds and aggregate businesses. Its products include drainage and water management solutions, concrete bricks, masonry, mortar, screeds, and aggregates. The Marley Roofing Products segment offers a comprehensive roofing system. Its products include concrete tiles, clay tiles, timber battens, and roof integrated solar panels. The company was founded in 1890 and is headquartered in Elland, the United Kingdom.
Bullish this FTSE250 stock - but not for that longHere's another UK stock that I reckon may still have some upside left in it even if the 4th wave correction might have another leg down. I have picked the 0.5 fib extension of waves 1 to 3 as a top as it coincides with the yearly R1 pivot.

See all ideas
Trade directly on the supercharts through our supported, fully-verified and user-reviewed brokers.


Frequently Asked Questions
The current price of 1QG is 3.1200 EUR — it hasn't changed in the past 24 hours. Watch MARSHALLS PLC stock price performance more closely on the chart.
Depending on the exchange, the stock ticker may vary. For instance, on SWB exchange MARSHALLS PLC stocks are traded under the ticker 1QG.
MARSHALLS PLC is going to release the next earnings report on Aug 15, 2024. Keep track of upcoming events with our Earnings Calendar.
1QG stock is 1.28% volatile and has beta coefficient of 1.35. Track MARSHALLS PLC stock price on the chart and check out the list of the most volatile stocks — is MARSHALLS PLC there?
MARSHALLS PLC revenue for the last quarter amounts to 404.60 M EUR despite the estimated figure of 404.15 M EUR. In the next quarter revenue is expected to reach 411.95 M EUR.
Yes, you can track MARSHALLS PLC financials in yearly and quarterly reports right on TradingView.
1QG stock has risen by 6.12% compared to the previous week, the month change is a 1.89% fall, over the last year MARSHALLS PLC has showed a 6.59% decrease.
1QG net income for the last quarter is 6.34 M EUR, while the quarter before that showed 15.24 M EUR of net income which accounts for −58.39% change. Track more MARSHALLS PLC financial stats to get the full picture.
Today MARSHALLS PLC has the market capitalization of 802.70 M, it has decreased by 3.85% over the last week.
MARSHALLS PLC dividend yield was 2.97% in 2023, and payout ratio reached 112.77%. The year before the numbers were 5.71% and 137.08% correspondingly. See high-dividend stocks and find more opportunities for your portfolio.
Like other stocks, 1QG shares are traded on stock exchanges, e.g. Nasdaq, Nyse, Euronext, and the easiest way to buy them is through an online stock broker. To do this, you need to open an account and follow a broker's procedures, then start trading. You can trade MARSHALLS PLC stock right from TradingView charts — choose your broker and connect to your account.
As of May 3, 2024, the company has 2.73 K employees. See our rating of the largest employees — is MARSHALLS PLC on this list?
Investing in stocks requires a comprehensive research: you should carefully study all the available data, e.g. company's financials, related news, and its technical analysis. So MARSHALLS PLC technincal analysis shows the neutral today, and its 1 week rating is sell. Since market conditions are prone to changes, it's worth looking a bit further into the future — according to the 1 month rating MARSHALLS PLC stock shows the sell signal. See more of MARSHALLS PLC technicals for a more comprehensive analysis.
If you're still not sure, try looking for inspiration in our curated watchlists.
If you're still not sure, try looking for inspiration in our curated watchlists.
We've gathered analysts' opinions on MARSHALLS PLC future price: according to them, 1QG price has a max estimate of 9.37 EUR and a min estimate of 3.34 EUR. Watch 1QG chart and read a more detailed MARSHALLS PLC stock forecast: see what analysts think of MARSHALLS PLC and suggest that you do with its stocks.
EBITDA measures a company's operating performance, its growth signifies an improvement in the efficiency of a company. MARSHALLS PLC EBITDA is 111.07 M EUR, and current EBITDA margin is 14.35%. See more stats in MARSHALLS PLC financial statements.