Ford’s 50% RetracementFord Motor jumped last week, and some traders may think there’s still gas in the tank.
The first pattern on today’s chart is the rally after third-quarter results beat estimates. The surge overcame a resistance level from earlier in the month and established a new 15-month high for the Dearborn aut
Key facts today
Next report date
—
Report period
—
EPS estimate
—
Revenue estimate
—
1.008 EUR
5.68 B EUR
178.70 B EUR
3.90 B
About FORD MTR CO DEL
Sector
Industry
CEO
James Duncan Farley
Website
Headquarters
Dearborn
Founded
1903
ISIN
US3453708600
FIGI
BBG000K1XJW1
Ford Motor Co. engages in the manufacture, distribution, and sale of automobiles. It operates through the following segments: Ford Blue, Ford Model E, Ford Pro, Ford Next, Ford Credit, and Corporate Other. The Ford Blue, Ford Model E, and Ford Pro segment includes the sale of Ford and Lincoln vehicles, service parts, and accessories, together with the associated costs to develop, manufacture, distribute, and service the vehicles, parts, and accessories. The Ford Next segment is involved in the expenses and investments for emerging business initiatives aimed at creating value for Ford in vehicle-adjacent market segments. The Ford Credit segment consists of the Ford Credit business on a consolidated basis, which is primarily vehicle-related financing and leasing activities. The Corporate Other segment refers to corporate governance expenses, past service pension and OPEB income and expense, interest income and gains and losses from cash, cash equivalents, and marketable securities, and foreign exchange derivatives gains, and losses associated with intercompany lending. The company was founded by Henry Ford on June 16, 1903 and is headquartered in Dearborn, MI.
Related stocks

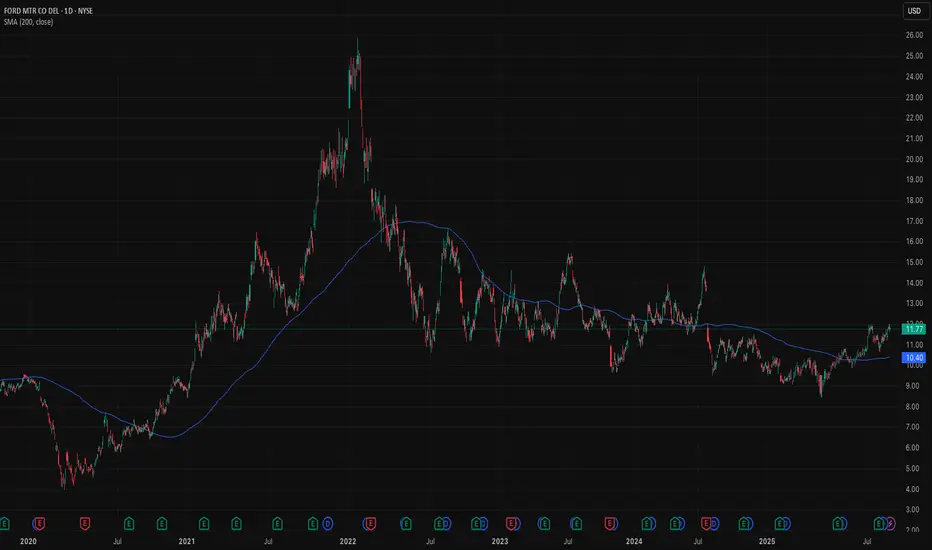
F Bullish Flag: Breakout Toward 14.50Ford (F) on the 1D chart is trending higher after an early-October surge from ~12.50 to ~13.97 on heavy volume. Price has since eased into a tight consolidation that reads like a bullish flag, with momentum still constructive above the rising 20/60/120-day MAs. Bollinger Bands that exploded on the b

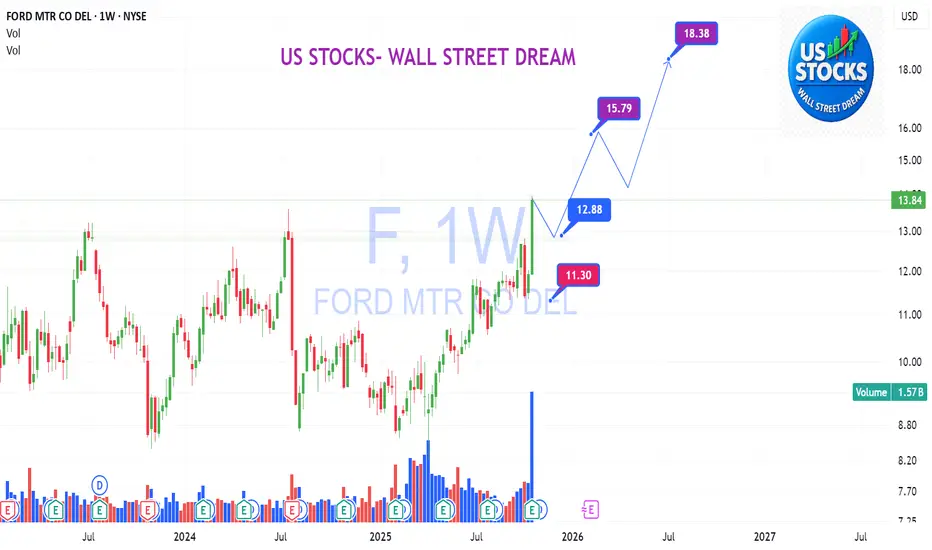
F: solid base accumulation breakout and up!F:
.
Solid base accumulation breakout and up!
Wait for a backup/ SOS and bull run!
.
US STOCKS- WALL STREET DREAM- LET'S THE MARKET SPEAK!
Ford 1D Investment Aggressive CounterTrend TradAggressive CounterTrend Trade
- short impulse
+ exhaustion volume
+ 1/2 correction
Calculated affordable stop limit
Take profit:
1/3 to 1/2 Month Trend
1/3 to Month T2
1/3 to Year 1/2
Sell F Limit at $14.95 (Good 'til Canceled)
Sell F Limit at $11.57 (Good 'til Canceled)
Sell F Limit at $10.21 (Go

F 5M Daytrade Long Aggressive Trend TradeAggressive Trend Trade
- short impulse
+ volumed TE / T1 level
+ support level
+ long volume distribution approach
+ biggest volume 2Sp+
- no test
Calculated affordable stop limit
1 to 2 R/R take profit before 5M T2
Hour Trend
"- long impulse
- volumed T2
+ support level
+ 1/2 correction
+ biggest

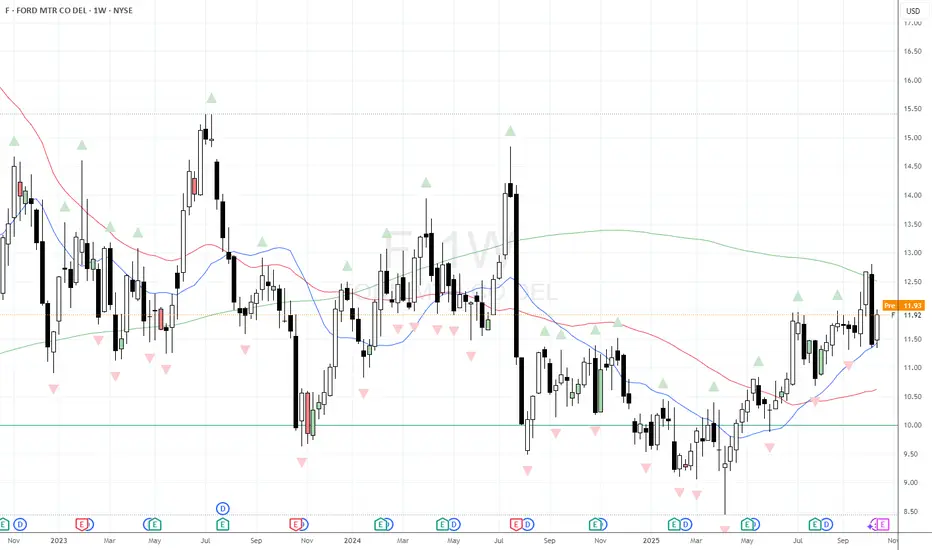
$F bearish Weekly Key Reversal squeezed between 20 & 200MAWe have Ford releasing earnings after close on Thursday. In the meantime the chart is of interest. last week we printed a weekly bearish Key Reversal / Engulfing Candle. How much of that is down to sentiment, and how much down to pre-earnings plays? I suspect its more the former rather than the lat
F - Wheels prepared for a breakout=======
Volume
=======
-increasing
==========
Price Action
==========
- Triple bottom supported
- Broken out downtrend line of 4.5 years
=================
Technical Indicators
=================
- Ichimoku
>>> price above cloud
>>> Green kumo budding
>>> Tenken + Chiku - above clouds
>>> Kiju

F🔹 Key Levels
Buy Zone: $10.50 – $9.50
This is the major demand area where buyers are expected to step in.
Stop-Loss: $8.20
A break below this invalidates the bullish outlook.
Current Price: $11.68 (slightly above the buy zone).
Target Zone: $21.31 – $23.25
This is the major supply/resistance are

Ford - The quiet bull caseFord is quietly building the most credible EV pivot among legacy automakers.
Its new EV platform, rolling out in 2027, is a bet on scale, speed, and affordability. It's also a bet on corporate America's ability to innovate and manufacture its way out of a two decade slump.
Ford will start with a
$F: Ford Motor Company – Driving Profits or Stalling Out?(1/9)
Good afternoon, everyone! ☀️ NYSE:F : Ford Motor Company – Driving Profits or Stalling Out?
With F at $10.18, is this auto giant revving up with EVs or sputtering in the market? Let’s shift gears and find out! 🔍
(2/9) – PRICE PERFORMANCE 📊
• Current Price: $ 10.18 as of Mar 18, 2025 💰
• R

See all ideas
Summarizing what the indicators are suggesting.
Neutral
SellBuy
Strong sellStrong buy
Strong sellSellNeutralBuyStrong buy
Neutral
SellBuy
Strong sellStrong buy
Strong sellSellNeutralBuyStrong buy
Neutral
SellBuy
Strong sellStrong buy
Strong sellSellNeutralBuyStrong buy
An aggregate view of professional's ratings.
Neutral
SellBuy
Strong sellStrong buy
Strong sellSellNeutralBuyStrong buy
Neutral
SellBuy
Strong sellStrong buy
Strong sellSellNeutralBuyStrong buy
Neutral
SellBuy
Strong sellStrong buy
Strong sellSellNeutralBuyStrong buy
Displays a symbol's price movements over previous years to identify recurring trends.
F
F5515462
Ford Motor Credit Company LLC 6.6% 20-DEC-2029Yield to maturity
6.78%
Maturity date
Dec 20, 2029
F
F5629298
Ford Motor Credit Company LLC 6.75% 20-AUG-2033Yield to maturity
6.74%
Maturity date
Aug 20, 2033
F
F5512661
Ford Motor Credit Company LLC 6.7% 20-DEC-2032Yield to maturity
6.70%
Maturity date
Dec 20, 2032
See all FMC1 bonds
Curated watchlists where FMC1 is featured.


Frequently Asked Questions
The current price of FMC1 is 11.424 EUR — it has decreased by −1.26% in the past 24 hours. Watch Ford Motor Company stock price performance more closely on the chart.
Depending on the exchange, the stock ticker may vary. For instance, on SWB exchange Ford Motor Company stocks are traded under the ticker FMC1.
FMC1 stock has risen by 0.11% compared to the previous week, the month change is a 5.89% rise, over the last year Ford Motor Company has showed a 13.58% increase.
We've gathered analysts' opinions on Ford Motor Company future price: according to them, FMC1 price has a max estimate of 12.93 EUR and a min estimate of 8.62 EUR. Watch FMC1 chart and read a more detailed Ford Motor Company stock forecast: see what analysts think of Ford Motor Company and suggest that you do with its stocks.
FMC1 reached its all-time high on Jan 13, 2022 with the price of 22.560 EUR, and its all-time low was 0.890 EUR and was reached on Nov 20, 2008. View more price dynamics on FMC1 chart.
See other stocks reaching their highest and lowest prices.
See other stocks reaching their highest and lowest prices.
FMC1 stock is 1.27% volatile and has beta coefficient of 0.71. Track Ford Motor Company stock price on the chart and check out the list of the most volatile stocks — is Ford Motor Company there?
Today Ford Motor Company has the market capitalization of 45.24 B, it has increased by 7.16% over the last week.
Yes, you can track Ford Motor Company financials in yearly and quarterly reports right on TradingView.
Ford Motor Company is going to release the next earnings report on Feb 10, 2026. Keep track of upcoming events with our Earnings Calendar.
FMC1 earnings for the last quarter are 0.38 EUR per share, whereas the estimation was 0.30 EUR resulting in a 27.17% surprise. The estimated earnings for the next quarter are 0.11 EUR per share. See more details about Ford Motor Company earnings.
Ford Motor Company revenue for the last quarter amounts to 43.06 B EUR, despite the estimated figure of 40.09 B EUR. In the next quarter, revenue is expected to reach 38.51 B EUR.
FMC1 net income for the last quarter is 2.09 B EUR, while the quarter before that showed −30.56 M EUR of net income which accounts for 6.92 K% change. Track more Ford Motor Company financial stats to get the full picture.
Yes, FMC1 dividends are paid quarterly. The last dividend per share was 0.13 EUR. As of today, Dividend Yield (TTM)% is 5.72%. Tracking Ford Motor Company dividends might help you take more informed decisions.
Ford Motor Company dividend yield was 7.88% in 2024, and payout ratio reached 53.35%. The year before the numbers were 10.25% and 116.20% correspondingly. See high-dividend stocks and find more opportunities for your portfolio.
As of Nov 7, 2025, the company has 171 K employees. See our rating of the largest employees — is Ford Motor Company on this list?
EBITDA measures a company's operating performance, its growth signifies an improvement in the efficiency of a company. Ford Motor Company EBITDA is 7.99 B EUR, and current EBITDA margin is 5.93%. See more stats in Ford Motor Company financial statements.
Like other stocks, FMC1 shares are traded on stock exchanges, e.g. Nasdaq, Nyse, Euronext, and the easiest way to buy them is through an online stock broker. To do this, you need to open an account and follow a broker's procedures, then start trading. You can trade Ford Motor Company stock right from TradingView charts — choose your broker and connect to your account.
Investing in stocks requires a comprehensive research: you should carefully study all the available data, e.g. company's financials, related news, and its technical analysis. So Ford Motor Company technincal analysis shows the strong buy rating today, and its 1 week rating is buy. Since market conditions are prone to changes, it's worth looking a bit further into the future — according to the 1 month rating Ford Motor Company stock shows the buy signal. See more of Ford Motor Company technicals for a more comprehensive analysis.
If you're still not sure, try looking for inspiration in our curated watchlists.
If you're still not sure, try looking for inspiration in our curated watchlists.