Long GOLD (MGC Jun2024)Daily reversal candle after a breakdown on a daily chart. In the event of a daily closing breach of the support levels (red lines), there is a possibility of further downward movement, emphasizing the importance of implementing risk management strategies.
GOZ2020 trade ideas

Gold Futures Day Trading Analysis 📋Gold Futures, it's nice to see a strong buying reaction at the price of 2343.
There's a significant accumulation of contracts in this area, indicating strong buyer interest. I believe that buyers who entered at this level will defend their long positions. If the price returns to this area, strong buyers will likely push the market up again.
The S/R zone from the past and high volume cluster are the main reasons for my decision to go long on this trade.
Happy trading
Dale

Gold remains bearishThe strong performance of the U.S. ADP employment data in April provided new challenges for the Federal Reserve's monetary policy. In this context, the reaction of the gold market is particularly worthy of attention. After the data was released, gold fell back 4 US dollars in the short term and then rebounded. The number of ADP jobs in the United States increased by 192,000 in April, far exceeding the expected 175,000, showing the strength of the labor market. Salary growth slowed: Salary growth for those who changed jobs fell from 10.1% to 9.3% year-on-year. Although it is still higher than the level at the beginning of the year, it shows a certain slowing trend.
Against the backdrop of strong ADP employment data, the Fed's monetary policy decisions have become more complicated. The gold market will pay close attention to the Fed's next moves, as these decisions will directly affect gold's safe-haven demand and investment value. Investors should remain vigilant during this critical period and carefully evaluate market dynamics.
The market is in a weak position, with pressure at 2306 and 2315. Therefore, if you want to short during the day, you must first pay attention to whether 2300 breaks. If 2300 does not break, gold will go short under such extremely weak conditions. Look at the trend point below at 2250. If 2300 breaks and the strength changes, this wave can still rise to 2315 and 2330 highs.

Gold shock correction nears endMarket participants will also be closely watching comments from Fed officials next week. The chance that the Fed will adjust policy in September remains slightly above 50%, according to data from the CME Fed Watch Tool. Market positioning suggests the dollar could face selling pressure if Fed policymakers leave the door open to a rate cut in September.
On the other hand, if Fed officials favor a rate cut closer to the end of the year, the U.S. dollar may hold its ground, making it difficult for gold to gain traction. However, policymakers still have several inflation and employment data to assess before September, and they may not send any clear signals on the timing of a policy shift. The market will also see appearances from several regional Fed presidents. Minneapolis Fed President Kashkari will speak in New York; Richmond Fed President Barkin will speak at an event in South Carolina. New York Fed President Williams will speak at a conference in California; Fed Governor Cook will speak in Washington, D.C., and Chicago Fed President Goolsby will speak at the Economic Club of Minnesota.
In terms of short-term rhythm, looking at the market price in four hours, the pressure position is obviously at the integer mark of 2,400 US dollars, and there is no physical closing line above 2,400 US dollars. At best, it was suppressed by a virtual break of $2,400. However, as the market price hit the $2,400 mark many times and failed to form an effective breakthrough, it then adjusted downward and corrected, which is what we often talk about accumulating strength. If US$2,400 to US$2,292 is regarded as the first wave downward revision, then US$2,252 to US$2,282 is the third wave downward revision. The correction decline is not a decline in the main trend, and the maximum correction wave does not exceed three waves. And the decline in each wave will be compressed. This wave, which is the third wave correction, will be based on the high point of $2327. Combined with the double bottom position of 2267, there is a high probability that the correction will be completed at the $2267 line. So that means the area around $2,267 is what we think is the correction low.
In terms of specific layout, the third wave of downward revision has not yet completed, and next week it is still necessary to make a high-altitude pullback layout, and then retrace $2,267 before making a backhand. At the beginning of the week, focus on 2310 to suppress the first short-selling layout. Below, focus on the 2292, 2282 and 2267 positions. Focus on the first-line opportunity of touching 2267, and start to place long orders on the backhand. When the correction is completed, the bulls will return! Taken together, in terms of short-term gold operation ideas next week, Jin Shengfu recommends to focus on longs on callbacks, supplemented by shorts on rebounds. The top short-term focus will be on the 2308-2310 first-line resistance, and the bottom short-term will focus on the 2265-2267 first-line support. All friends must keep up. Rhythm. It is necessary to control positions and stop loss issues, set stop losses strictly, and never resist orders. The recent market turmoil has been relatively large, and opportunities and risks coexist. Control risks and gain profits.

58% win rate Python trend follow trade set upThis trade set up call SNRC that use previous resistance as support when price break above and comeback to retest
I backtesting this trade set up with Python using 720 day price history data
so you can see the optimization heat map
this is 58% win rate with 2RR trade set up

Gold fluctuates repeatedly in downward trendTraders see a 64% chance of the Fed cutting interest rates in September, according to CME's FedWatch tool. Lower interest rates will make holding non-yielding gold more attractive. Data on Friday showed that U.S. job growth slowed more than expected in April, while year-on-year wage growth fell below 4.0% for the first time in nearly three years. New York Fed President Williams said on Monday that the Fed will lower its interest rate target at an undetermined point. Investors are paying close attention to the latest developments in the conflict in the Middle East. Palestinian militant group Hamas agreed on Monday to a Gaza ceasefire proposal put forward by mediators, but Israel said the conditions did not meet its demands and continued its strikes in Rafah while planning to continue negotiations to reach an agreement. The gold market continues to face significant upward pressure as it is used to protect wealth from devaluation as well as global geopolitical issues.
Gold technical analysis: Gold prices maintained an upward trend on Monday. In early trading, the price fell back to the 2291 line and rebounded. Asian, European and American markets continued to fluctuate and rise, reaching a maximum of 2332 and closing at 2324. The price fluctuates in the range of 2335-2277. Today, continue to focus on the upper resistance 2332-2338 and the lower support 2281-2277. The short defensive position is currently at the 2352 line. Only by breaking through and stabilizing the 2352 line can the end of this downward trend be confirmed.
In terms of gold's short-term operation today, it is recommended to go short on rebounds and long on callbacks. The upper short-term focus is on the first-line resistance of 2330-2332, and the lower short-term focus is on the 2281-2277 first-line support.

2024-05-13 - a daily price action after hour update - gold
Good Evening, I hope you had a great weekend and you are well.
overall market comment
Very slow and range bound trading day in most markets, so only a short update today because my nothing in my weekly premise changed today.
gold
comment: Market is forming a triangle and since we are near the low, bulls are expected to buy it above 2312 to not make lower lows and trade it back up to around 2370ish.
current market cycle: trading range
key levels: 2300 - 2400
bull case: Bulls need to keep it above 2312 and trade back up inside the triangle for target 2370ish which is also today’s high and near the breakout level from one month ago. First target is a break of the 1h 20ema around 2350, small pullback to form a higher low and then a bull channel up to 2370. Pattern could probably play out until CPI release on Wednesday.
bear case: If bears are strong, they would print below 2310 tomorrow to make many bulls doubt this will retest the highs above 2400 again. If they could manage that, their next target would be 2300 and there is bulls last hope for not a big bear trend down to 2050 over the next weeks. Invalid above 2355.
short term: Sideways to up - Got the expected pull-back which was deeper than I thought. Now probably back up again.
medium-long term: Still no better opinion on this to be honest. I don’t like to get into the speculations why the Gold price is where it is. I have been saying that the market was very unusual over the last 2 months to say the least. It would not surprise me, if we just continue the selling all the way back to 2100 and lower. —unchanged
trade of the day: The bear channel was pitch perfect and held all day. 15m or 1h 20ema were also a nice guides for initiating or adding to shorts.

Gold Futures Target All-Time HighsTechnical Momentum Strengthens
Gold Futures hit an all-time high in 2024 at $2,448 on the June futures contract on April 12. Since then, futures have corrected; however, gold remains firmly above the rising 50-day moving average at $2,294 and well above the 200-day moving average at $2101. The technical perspective shows momentum studies increasing, with the 9-day moving average trading above the 18-day.
Stochastics are rising from oversold territory, and DMI + above DMI- , indicating that the bulls are technically in control.
Tailwinds Continue to Develop
With a 3% chance of a June rate cut, according to the CME FedWatch Tool, traders are focused on September; swaps are pricing in a 65% chance that the Fed will make its first interest rate hike in the cycle.
Geopolitical tensions, rampant fiscal spending, and central bank buying have been the main drivers and have significantly propelled Gold prices recently.
Industrial Metals Strengthen
Performance remains strong in the Precious Metals space and has continued to spill into the industrial complex. Traders continue to monitor manufacturing, Chinese Economic data, and the U.S. economy.
www.tradingview.com
CME Real-time Market Data help identify trading set-ups and express my market views. If you have futures in your trading portfolio, you can check out on CME Group data plans available that suit your trading needs
Disclaimers
*Trade ideas cited above are for illustration only, as an integral part of a case study to demonstrate the fundamental concepts in risk management under the market scenarios being discussed. They shall not be construed as investment recommendations or advice. Nor are they used to promote any specific products, or services.
Futures trading involves substantial risk of loss and may not be suitable for all investors. Trading advice is based on information taken from trade and statistical services and other sources Blue Line Futures, LLC believes are reliable. We do not guarantee that such information is accurate or complete and it should not be relied upon as such. Trading advice reflects our good faith judgment at a specific time and is subject to change without notice. There is no guarantee that the advice we give will result in profitable trades. All trading decisions will be made by the account holder. Past performance is not necessarily indicative of future results.

Gold: Do not slacken! 🥱Gold could not yet gain significantly more upward momentum. Therefore, we still consider it 40% likely that the precious metal will drop directly below the support at $2285, thus confirming an already established high of the turquoise wave alt.B. In this case, our turquoise Target Zone would not be reached anymore. Primarily, however, we stick to our expectation that Gold will rise into our turquoise Zone between $2510 and $2631 to place the top of the regular wave B there.

GOLD FUTURES : OUTLOOK This is the same idea. as previously posted but on the futures chart. It seems price is already at our entry on the futures contract chart.
"May fortune attend thee, and thy trade prosper." .......L2Earned

Gold shining on the "UPSIDE"Gold has been trending strongly on the higher time frames and seems like it still has a lot of room to move to the upside. We will wait patiently for the pullback on the 4hour chart demand zone that has been created. We should expect to see another leg to the upside on Gold.

Is The Next Upside Target For Gold $2500/oz?Technical Momentum Strengthens
Gold Futures hit an all-time high in 2024 at $2,454 on the June futures contract on May 20th. Since then, futures have corrected; however, gold remains firmly above the rising 50-day moving average at $2,332 and well above the 200-day moving average at $2111. The technical perspective shows momentum studies increasing, with the 9-day moving average trading above the 18-day.
Stochastics are rising from oversold territory, and DMI + above DMI- , indicating that the bulls are technically in control.
Tailwinds Continue to Develop
With a 0% chance of a June rate cut, according to the CME FedWatch Tool, traders are focused on September; swaps are pricing in a 58% chance that the Fed will make its first interest rate hike in the cycle.
Geopolitical tensions, rampant fiscal spending, and central bank buying have been the main drivers and have significantly propelled Gold prices recently.
Industrial Metals Strengthen
Performance remains strong in the Precious Metals space and has continued to spill into the industrial complex. Traders continue to monitor manufacturing, Chinese Economic data, and the U.S. economy, which have recently driven copper futures back over $5.00/pound and Silver over $32.00/oz.
www.tradingview.com
CME Real-time Market Data help identify trading set-ups and express my market views. If you have futures in your trading portfolio, you can check out on CME Group data plans available that suit your trading needs
Disclaimers
*Trade ideas cited above are for illustration only, as an integral part of a case study to demonstrate the fundamental concepts in risk management under the market scenarios being discussed. They shall not be construed as investment recommendations or advice. Nor are they used to promote any specific products, or services.
Futures trading involves substantial risk of loss and may not be suitable for all investors. Trading advice is based on information taken from trade and statistical services and other sources Blue Line Futures, LLC believes are reliable. We do not guarantee that such information is accurate or complete and it should not be relied upon as such. Trading advice reflects our good faith judgment at a specific time and is subject to change without notice. There is no guarantee that the advice we give will result in profitable trades. All trading decisions will be made by the account holder. Past performance is not necessarily indicative of future results.

Sell goldSell gold as described in the analysis provided and follow the steps specified in Stop Loss and Take Profit

GOLD (GCM2024, XAUUSD)... BULLISH BIAS!Bias is Bullish.
Price is moving up with convincing
momentum. Respecting bullish PD
Arrays, disrespecting bearish ones.
No signs of reversal. The intent to
reach the DOL/Swing High seems
clear.
The expectation is for Gold to make
further gains. A potential pullback
to 2400 area would make sense as a
zone to buy from, as buying from the
top is not recommended.
Thank you for viewing!
Leave any questions or comments in the comment section.
I appreciate any feedback from my viewers!
Like and/or subscribe if you want more accurate analysis.
Thank you so much!
May profits be upon you.

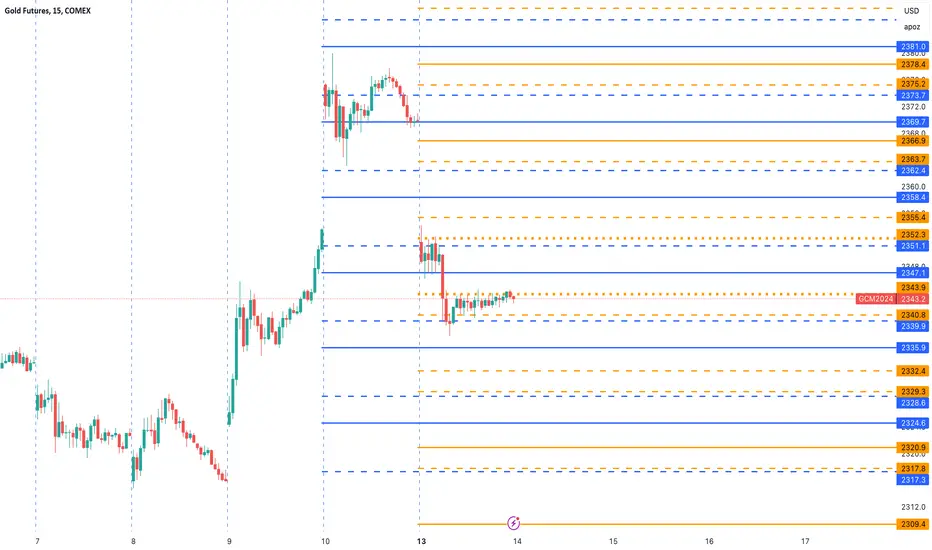
Gold COMEX Future - Intraday Levels - 14th May 2024if Sustain above 2343.9 then 2347.1 then 2351.1 to 2352.3 then 2355.4 above this bullish then 2358.4 then 2362.4 to 2363.7 then 2366.9 above this more bullish
if Sustain Below 2340.8 or 2339.9 below this bearish then 2335.9 then 2332.4 then 2329.3 to 2328.6 below this more bearish
Consider some buffer points in above levels.
Please do your due diligence before trading or investment.
**Disclaimer -
I am not a SEBI registered analyst or advisor. I does not represent or endorse the accuracy or reliability of any information, conversation, or content. Stock trading is inherently risky and the users agree to assume complete and full responsibility for the outcomes of all trading decisions that they make, including but not limited to loss of capital. None of these communications should be construed as an offer to buy or sell securities, nor advice to do so. The users understands and acknowledges that there is a very high risk involved in trading securities. By using this information, the user agrees that use of this information is entirely at their own risk.
Thank you.
Gold will continue the trend Gold now at sideway .but it may go up soon. Just follow trend . Trend following strategy is so easy to earn money.

Gold market expectation for the third week of mayWe have used advanced market theories in this analysis considering the economical factors and multiple charts analysis

Long GOLD (MGC Jun2024)Daily reversal candle after a breakdown on a daily chart. In the event of a daily closing breach of the support levels (red lines), there is a possibility of further downward movement, emphasizing the importance of implementing risk management strategies.

Gold - near resistance - target levelsGold is near resistance. It is in sideways near resistance. If it breaks that resistance level in weekly. It will go to new level. Maybe around 90000.

2024-05-09 - a daily price action after hour update - gold
Good Evening and I hope you are well.
Gold
comment: Strong buying today and bulls made a higher low and higher highs. Please have a look at my chart, which contains my next best guess on what could happen. 2375ish has enough targets to be a magnet above but I don’t think we can get there without a pull-back. A retest of 2448 is still very possible.
current market cycle: trading range
key levels: 2300 - 2400
bull case: The 4h tf looks easy but bears got deep pull-backs today. Bulls completed a 3 push pattern upwards and I expect a two-legged correction before we try higher again. Invalid below 2320. Targets above are 2360 and 2375ish above.
bear case: It’s still inside a big trading range and market is two sided, despite the higher prices. Bears selling new highs and making money, so don’t just stop that. As long as bears keep this below 2365, it’s a lower high inside this large bull flag from the ath 2448. Bears targets are trading below 1h 20ema 2333 and then retest 2313 and then break out of the bull channel again. Invalid above 2380.
short term: Sideways to up - expecting a smaller pull-back before another try to break 2370.
medium-long term: Still no better opinion on this to be honest. I don’t like to get into the speculations why the Gold price is where it is. I have been saying that the market was very unusual over the last 2 months to say the least. It would not surprise me, if we just continue the selling all the way back to 2100 and lower.
trade of the day: Big breakout before US session above 2330, retest down to 2320 on smaller time frames and then a perfect buy signal after the retest.
Breakout → Pull-back → long/short (continuation of breakout) are very strong and reliable patterns.

GOLD RecoveryGold recently sold off after falling below its ascending wedge, but looks ready to make a recovery after breaking above a descending trendline. I'd expect upside from here, or a retest of the trendline before moving higher.

Long GOLD (MGC Jun2024)Daily reversal candle after a breakdown on a daily chart. In the event of a daily closing breach of the support levels (red lines), there is a possibility of further downward movement, emphasizing the importance of implementing risk management strategies.

GOLD NEXT MOVE..... 09.05.2024As we witnessed gold price failed to hold ground and got rejected multiple times from the resistance region of 2335.00 to 2342.00 to 2310.00 area. On chart it is clearly visible that price is heading to test the green support zone of 2278.00 to 2288.00 where SMA 200 also provides an additional support.
Bullish trend is valid till the price of Gold is stable above the demand zone/support zone of 2278.00 to 2288.00. Breach of that region and stability below will send the prices to retest 2249.00 to 2259.00 initially.
