SPY WEEKLY JUNE 17 2024SPY weekly is here. If you have any doubts make sure to DM me here. All the crucial levels have been discussed in this analysis.
NOTE: MARKET IS BULLISH & RETRACEMENT CAN COME
1557 trade ideas

SPY, QQQ & NVDA: Week of June 17Hey everyone,
Wasn't in the mood to type, so here is my analysis in video format!
Hope you enjoy and as always, feel free to leave your questions below :).
Safe trades!

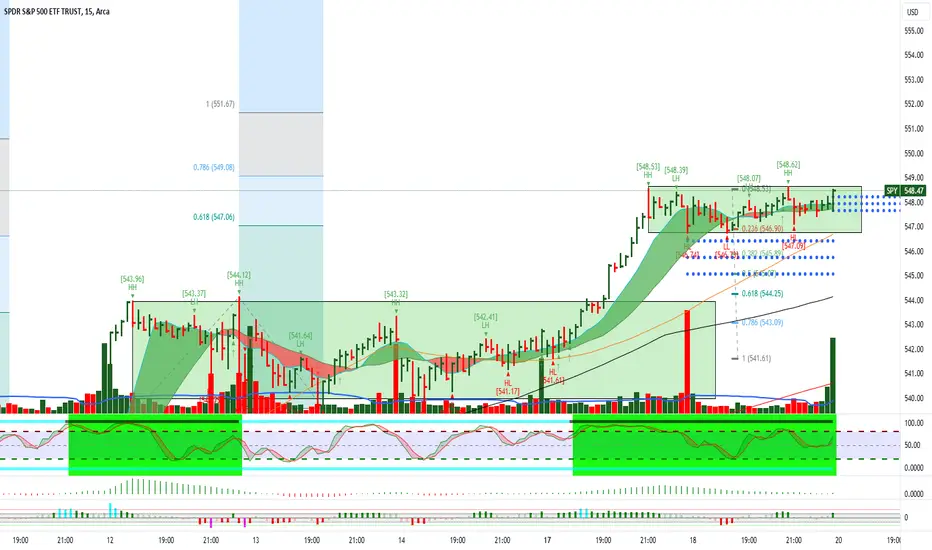
$SPY June 19, 2024AMEX:SPY June 19, 2024
15 Minutes.
Holding 547 AMEX:SPY is aiming for 550-551.5 as next target. Last support for this uptrend is 544 levels which is 61.8% retracement for the last rise as marked.
Spy Spy Is expected to make one of the biggest moves of the whole year Tomorrow, be very careful with tomorrow moves will keep everyone posted!!!

SPY: Bearish Continuation
Remember that we can not, and should not impose our will on the market but rather listen to its whims and make profit by following it. And thus shall be done today on the SPY pair which is likely to be pushed down by the bears so we will sell!
❤️ Please, support our work with like & comment! ❤️


Plan Your Trades - SPY Research For 6/17 & BeyondI put together this video to help traders plan and prepare for the next 30-60+ days - as we move into Q2:2024 earnings and pre-election consolidation.
Every week, I spent hours going over my Custom Indexes, proprietary price modeling systems, sector analysis, and more. My goal is to help as many traders as possible prepare for the greatest opportunities of their life (the next 5 to 10+ years).
I see so many traders getting trapped into following free or paid internet advice and blowing up their accounts. In my opinion, stick to the basics. Price is the ultimate indicator.
Then, determine the true bias of price trend and identify strong candidates to profit within that trend.
If you are a daytrader - you probably won't like my research/comments. I don't really daytrade much. I'm more of a swing trader - looking for 8% to 25% swings that take 3 to 20+ weeks to mature.
Either way, this video will help you understand what to expect over the next 30-60+ days in the US/global markets. Prepare for a big move in late June or early July.

Below 540.44 gets exciting SPY looking bearish. Could see the floor drop if it dips below 540 ish. Selling calls here.

$SPY & CRE PanicIgnoring mainstream news and whatever and only using my data i'm seeing that CRE is experiencing unknown trouble. While SPY and other indices have been pumping possibly thanks to NVDA, CRE has been experiencing big trouble.
I think CRE trouble may spill over to the rest of the market as some kind of SVB/SIVB-like event sometime soon e.g June/July and will end at the start-mid August.
In my data below there's a big gap between SPY & CRE. When this gap first started forming, SPY did follow CRE data downwards but then got saved by... i dunno NVDA, the rest of the market... no idea. imgur.com
Point is the gap still exists and gaps are always fulfilled by being closed off one way or another.
"In a deep pub Clive British voice": I recon SPY goes down soon.
There's a chance we triple top on SPY before anything actually happens e.g we visit $523, then back up to $535, then after some consolidation finally break downwards to the $465's area. Actually hoping we this current double top resolves starting now and we do a quick visit to $465 before rebounding back upwards.
Thanks for attending this Ted talk.

$SPY range $479-$529, the path to the top (and bear market)AMEX:SPY looks to be showing signs of weakness here. Thinking that we could see the first large decline of the year into one of the support levels below $479-$495. Breaking the trend line would be the trigger.
If that happens and we do get a low, then I think we'll have one final rally to the upper resistance levels between $525-$530.
Another possibility, is we just continue upwards to the top resistance levels and then decline after. Idea of a range is you want to buy the lows (supports on chart) and sell the highs (resistances chart).
Regardless of the path we take, we're nearing a top in the market and after we hit those top levels, I expect a large decline lower (one that takes us past the prior 2022 lows).
Ultimately looking for SPY to reach the $280-300 level by the end of 2024. But let's save that analysis after we see what happens in this range.

SPY ETF Analysis: Patience is KeyCurrently, the SPY ETF shows an upward trend in both the long and short term, without clear signs of weakness. The current short-term trend leg seems strong enough to reach higher targets, especially due to the lack of significant resistances, except for round numbers that act as psychological barriers. However, we must consider the maturity of this trend. Prolonged trends can be vulnerable to corrections, which might threaten the continuity of the current rise. Moreover, the overall market scenario is not entirely favorable, with other important ETFs like QQQ, DIA, and IWM showing mixed signals. For instance, the DIA is showing weakness and might be starting a reversal, while the IWM is no longer in an uptrend.
For those looking to buy, it's important to take minimal risks and aim for shorter targets since the trend, although still upward, has reached a dangerous stage. Holding large positions or expecting prolonged movements may not be wise at this moment. Any sign of weakness, such as the current short-term trend leg failing to reach higher targets, should be a reason to exit positions or reduce exposure. On the other hand, for those thinking of selling or taking advantage of a possible decline, it’s prudent to wait for the first signs of weakness in the uptrend before starting to build positions, keeping them light and taking more risk only when there is a confirmed trend change. In conclusion, patience and caution are essential now. It’s better to avoid medium trades and focus on low-risk positions until the market shows clearer direction signals. Better opportunities will come, so stay calm and avoid significant risks.
What do you think of this analysis? Leave your comment below and share your perspectives on SPY!

SPY Set To Fall! SELL!
My dear followers,
This is my opinion on the SPY next move:
The asset is approaching an important pivot point 542.74
Bias - Bearish
Safe Stop Loss - 549.46
Technical Indicators: Supper Trend generates a clear short signal while Pivot Point HL is currently determining the overall Bearish trend of the market.
Goal - 530.66
About Used Indicators:
For more efficient signals, super-trend is used in combination with other indicators like Pivot Points.
———————————
WISH YOU ALL LUCK

SPY: Daily and Weekly Chart InsightsDaily Chart: Ascending Channel and Key Breakout
The daily chart of the SPY shows a robust upward trend within an ascending channel. The price has been making higher highs and higher lows, respecting the channel's boundaries. Key levels include the lower boundary of the channel as dynamic support and the 21-day EMA as a critical support level. Recently, SPY broke above the previous top at 533.07, suggesting a continuation of the bullish trend. Only if the SPY loses the 21-day EMA and this $533.07 support we would see a mid-term pullback. If the price continues to respect the ascending channel, it could reach higher resistance levels around 560.
Weekly Chart: Bullish Momentum and Support Levels
The weekly chart highlights a strong bullish trend with consistent higher highs and higher lows. The price is well-supported by the 21-week EMA. Key support levels include the 21-week EMA and the previous swing low at 524.11. The recent break above previous highs around 533 indicates sustained buying interest. If the bullish momentum continues, SPY could move towards the 550-560 range. However, a break below the 21-week EMA might signal a potential correction, with the next support around 500-510.
Conclusion: Strong Bullish Momentum with Clear Support and Resistance
Both the daily and weekly charts of SPY indicate a strong bullish trend within an ascending channel. The recent breakout above the previous top at 533.07 on the daily chart and the consistent higher highs and higher lows on the weekly chart suggest that the bullish momentum is likely to continue.
Key support levels to watch are the 21-day EMA at 534.43 and the lower boundary of the ascending channel on the daily chart, as well as the 21-week EMA at 514.79 on the weekly chart. Resistance levels include the upper boundary of the ascending channel and the psychological levels around 550-560.
Overall, SPY appears poised for further gains as long as it remains within the ascending channel and above the key support levels. We should monitor these levels closely for potential breakout or reversal signals.
For more detailed technical analyses and insights like this, be sure to follow my account. Your support helps me continue providing valuable content to help you make informed trading decisions.
Remember, real trading is reactive, not predictive, so let's stay focused on the key points described above and only trade when there is confirmation.
“To anticipate the market is to gamble. To be patient and react only when the market gives the signal is to speculate.” — Jesse Lauriston Livermore

Market Crash - Weekly Recap & Expectations for Next WeekThe market crash did not start this week unfortunately for me and my puts, but I still have confidence in the setup. I believe we're seeing a large divergence between NQ, ES and the rest of the market, which will eventually correct, it's just hard to say when. I know many are bullish due to the election year and other things, but I remain firm in my stance that we are near the top, even if we rally throughout the summer. We'll see how it goes, I made some short term bets this week that didn't work, but I'm optimistic about the short in the longer term.

A long & shortHere's a contrast between a long on BCH/USD and short on SPY. As you can see Bitcoin Cash is at it's support zone and SPY is near it's resistance area.
Trade idea:
BCH
long = 436
stop = 400
profit = 630
SPY
short = 542
stop = 545
profit = 530

$SPY June 17, 2024AMEX:SPY June 17, 2024
15 Minutes/
AMEX:SPY forming HL pattern.
Holding 541 uptrend continues.
And in 60 minutes it must hold 540 levels.
First target is 545-546 range for the week if holding 540 levels.

$SPY $SPX Last week’s price action for Review
This is just last weeks price action for review and now that I’m going out one contract further than before I want a copy before I clear it to work on tomorrow’s range. Basically this is the chart for the first half of tonight’s video.

SPY IMO a small gap down Tuesday morning, dip buyers taking it to another leg high to stop shorts out hitting the resistance, shaping up that nice RSI hourly divergence.
Then a straight healthy pullback to that gap fill.
Disclaimer: Just an idea, not a trading advice.
My position: A few puts 7-10 days out. Scalping + weekly shorts

I spy $600Hi everyone - I wanted to make a quick post with my thoughts on the next moves for AMEX:SPY using Elliott Wave Theory and Fibonacci Price/Time levels. I’m on my phone so I apologize if the chart screenshot looks cluttered.
AMEX:SPY is currently in a Primary W5 that should conclude in August. Yesterday we saw a spike after CPI came in cooler than expected, which completed the Minor W5/Intermediate W3 at $542.46.
The market also received disappointing news that the fed is only planning on one rate cut this year. This type of news bolsters the argument that we are entering an Intermediate W4.
I do not think this wave will last long and it could be choppy since Intermediate W2 saw a sharp move down after the extended W1. I will not go short on this trade and will wait to go long near the bottom of the channel ($530) around June 24th. As you can see on the volume profile, there is significant buying pressure at this level which will propel us into Intermediate W5.
The fifth wave will need to reach the Primary 1.618 price level and Primary 1.618 fib time marker. These levels cross on August 6th at $594. I think there will be psychological pressure to hit $600 since we’ll be in a PW5/IW5/MW5 wave. From there, I predict we enter a bear market that could also carry a negative news catalyst.
If the bear market is primarily technical without fundamental support, I predict the market will pick back up next year.

SPY BEST PLACE TO SELL FROM|SHORT
Hello,Friends!
It makes sense for us to go short on SPY right now from the resistance line above with the target of 531.44 because of the confluence of the two strong factors which are the general downtrend on the previous 1W candle and the overbought situation on the lower TF determined by it’s proximity to the upper BB band.
✅LIKE AND COMMENT MY IDEAS✅


Market Soars with Unyielding MomentumLast week was marked by complete bullish dominance. After positive inflation data was released on Wednesday, the market opened with a significant gap up. The next day, sellers made a sluggish attempt to fill this gap but never came close. To sum it up:
1. Prices are in an uptrend on weekly, monthly, and daily charts.
2. Last week closed strong with almost no seller pressure.
3. There is an unfilled gap from Wednesday, the 12th.
So far, this market is fully controlled by buyers. Notably, growth is driven mostly by tech stocks, reflecting a "risk-on" mode of investing. Some people are concerned about the narrow breadth, but it doesn't matter much whether growth is driven by many names or just a few large stocks. While narrow breadth can lead to increased volatility, the fact is that money is being poured into the market. As long as this continues, the market will remain strong.
Disclaimer
I don't give trading or investing advice, just sharing my thoughts.

$SPY June 18, 2024AMEX:SPY June 18, 2024
15 Minutes.
As shared on June 13, 2024, setup AMEX:SPY achieved the 546-548 target in one swift move.
And we have a sell bar at ATH in 15 minutes at 548.53, close being near low of bar.
If we take the last rise from 548.61 to 548.53 AMEX:SPY need to hold 544.5 levels to resume uptrend.
In 60 minutes if we take the move 518.36 to 539.9 to 532.04, we have fib extension of 546 as 78.6% extension and 550 as 100% extension.
And in 15 minutes if we consider the move 532.04 to 544.12 to 539.59, we have 549 as 78.6 and 551 as 100% extension for the move.
Hence 548.53 looks like a temporary top.
545 should give a n opportunity to go long with 543 as SL and 550-551 as target for the moment.
Remember the close in day is good so any shorts around 547-548 levels must be covered around 545.
