NDQ trade ideas

US100 BUYNasdaq looking for buy opportunity overall still in sell trend buy W pattern try to give us short term correction some took this analysis small risk 1:3 ratio

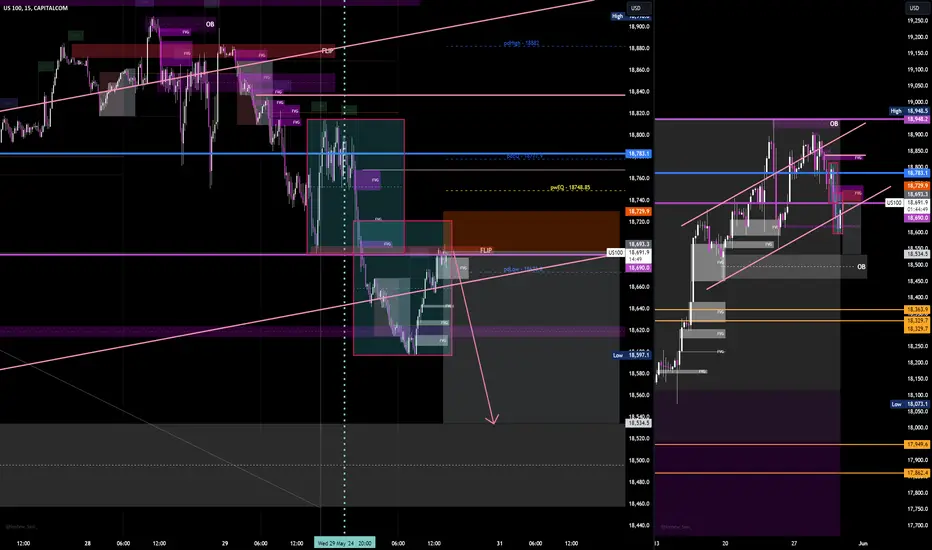
NAS SELLDetailed entry on NAS100 Sell. Analysis by h4H. A simple approach to technical analysis and trading.

nass 100 ideea just a ideea let se how it plaing out i ll wait till the trend line is break and the berish fvg is respected

NAS pullback, then correction towards 500I´m expecting Nas to climb back above 700. 700-740 looks as an ideal resell area. Yesterday we have entered at 832 and TP all trades at 600, so lets try to repeat it again. I will try to update this idea when-if entry conditions are met. If you follow me, you wont miss anything. Wish you good luck.
P.S. I´m not a signal service, however I´m sharing signals. Don´t have 30K followers (consisted mostly from bots), so it is up to you to check what idea are you trading. Check my previous ideas to know. Instead of waiting for signals, invest(your time, not money) into your learning. It will be more profitable, more interesting for you.

CHART BREAKDOWN US30: Key Levels, Targets and Thoughts!Trade Update: NASDAQ
We have some great news on our recent NASDAQ trade! 💲
After analyzing the market conditions and identifying a solid setup, our trade has successfully Hit Take Profit 2 (TP2). This made sure that 80% of our positions have been secured and cashed out some of our gains, allowing us to lock in profits and reduce risk.
Following this, we moved our stop loss to TP1 to ensure no loss on the remaining position. This strategy not only protects our capital but also gives us the opportunity to capture further potential gains with zero risk on the table and cashing out on TP3s.
Stay tuned for more updates and happy trading! 🚀

Balanced Price RangePrice is bearishly respecting multiple H1 imbalances in the same area looking to take price to the imbalance located in the discount or lower if possible

US100 Short - No ATH this week.Sharing a short position I opened.
The idea behind:
- End of the month,
- Dow Jones not in this rally,
- Big money is not interested,
- World geopolitics uncertainty,
- Change of character, almost unnoticed.
I expect some panic by the end of the session.

US100 final leg down to begin the panic?Entry on the previous day low FLIP zone with stop loss slightly above oberbalance.
Be aware of the news ahead and New York Killzone.
So far today we have seen a nice retrace by Europe session, but there is a possibility things are changing now and we might see a return to downtrend - with a trigger news event at 2:30 CET.
This is just for smaller positions and risky approach, as a part of a general short position I posted 2 days ago.
US100Nasdaq index analysis
1 hour time frame
The price can move to the bottom of the 1-hour range and from there return to the top of the 1-hour range.

US100Bearish Divergence on RSI appeared on 1 hr time frame and it printed LH and LL. It retraced upto 61.8 level. Sell trade upto recent LL level (double bottom).

Nasdaq Index Shows Uncertainty Ahead of PCE ReleaseNasdaq Index Shows Uncertainty Ahead of PCE Release
The main event of the week is the release of the Personal Consumption Expenditures (PCE) index, which the Federal Reserve particularly focuses on when assessing inflation in the US. The release is scheduled for Friday at 15:30 GMT+3. As this important event approaches, rumours and trader expectations about the news increasingly impact the current price on the stock market.
According to ForexFactory, the Core PCE Price Index on a monthly basis is as follows:
→ forecast for Friday = 0.3%.
→ previous value (a month ago) = 0.3%;
→ value two months ago = 0.3%.
These figures indicate stable inflation, but surprises are not ruled out, which could certainly lead to a spike in volatility.
The price of the Nasdaq index (US Tech 100 mini on FXOpen) has decreased since the beginning of the week – this may indicate market participants' uncertainty about whether inflation will decrease. Meanwhile, as CNBC reports, the president of the Federal Reserve Bank of Minneapolis, Neel Kashkari, believes that the Fed should wait for significant progress in combating inflation before lowering interest rates.
In his opinion, rates could potentially even be raised if inflation fails to decrease further. “I don’t think we should rule anything out at this point,” Kashkari added.
Technical analysis of the Nasdaq index (US Tech 100 mini on FXOpen) chart shows that:
→ the price is in an uptrend (shown by the blue channel);
→ the 18840 level is acting as resistance (indicated by the arrow).
Note the behaviour of the Nasdaq index price (US Tech 100 mini on FXOpen):
→ the upward impulse A→B was sharp, but it failed to hold above the 18840 level;
→ the upward impulse C→D is less sharp, judging by the slope of the trajectory. After overcoming the 18840 level, the price formed a rounding pattern (a sign of demand deficit) and decreased (confirmation of weakness). Notably, the price did not reach the upper boundary of the channel (shown by the red circle).
Today, the price is near the median line of the ascending channel, which could lead to some consolidation in anticipation of the news. If the news indicates a slowdown in inflation, we might see a new attack on the 18840 level; otherwise, the Nasdaq index price (US Tech 100 mini on FXOpen) could decrease to the lower boundary of the current channel.
Trade global index CFDs with zero commission and tight spreads. Open your FXOpen account now or learn more about trading index CFDs with FXOpen.
This article represents the opinion of the Companies operating under the FXOpen brand only. It is not to be construed as an offer, solicitation, or recommendation with respect to products and services provided by the Companies operating under the FXOpen brand, nor is it to be considered financial advice.


BUY NASQADAs you can see on the chart, the price now came out of the strongest zone of the volume profile and heading up to the IC in which you'll get a short entry.
This might be a risky trade, manage your risk!

NAS100 Will Grow! Long!
Please, check our technical outlook for NAS100.
Time Frame: 4h
Current Trend: Bullish
Sentiment: Oversold (based on 7-period RSI)
Forecast: Bullish
The market is approaching a significant support area 18,679.71.
The underlined horizontal cluster clearly indicates a highly probable bullish movement with target 18,824.15 level.
P.S
The term oversold refers to a condition where an asset has traded lower in price and has the potential for a price bounce.
Overbought refers to market scenarios where the instrument is traded considerably higher than its fair value. Overvaluation is caused by market sentiments when there is positive news.
Like and subscribe and comment my ideas if you enjoy them!

NASDAQ BUY NOWHi Traders we have NASDAQ BUY TRADE we have been on Uptrend since 3 May. We have hit Higher High and retest on higher low.
Entry Reason Higher low act as support level
H1 Bullish Engulfing
Moving Average
Please share your results and comment.
Certified Price action king

NASDAQ Another 2 weeks of consolidation possibleNasdaq (NDX) made the bullish break-out that we largely expected as described on our previous idea (May 15, see chart below) and almost hit our 19100 Target:
Right now we see a short-term pull-back, which based on the November - December 2023 fractal (green ellipse), should be at worst a 2 week consolidation. The 1D RSI also shows that symmetrically we should be at a point similar to December 06 2023.
That fractal then rose for a Higher High on the 2.236 Fibonacci extension. As a result, our medium-term Target is now set at 19900 (just under the 2.236 Fib and top of the 1.5 year Channel Up).
-------------------------------------------------------------------------------
** Please LIKE 👍, FOLLOW ✅, SHARE 🙌 and COMMENT ✍ if you enjoy this idea! Also share your ideas and charts in the comments section below! This is best way to keep it relevant, support us, keep the content here free and allow the idea to reach as many people as possible. **
-------------------------------------------------------------------------------
💸💸💸💸💸💸
👇 👇 👇 👇 👇 👇


NAS100 Possible short term bearish market?1h head and shoulders on nas100 with a choch, might be an indication that price wants to correct a bit before continuing it's overall bullish trend

little lateI was doing some groceries, but it seems bulls have been awaken hahahaha.
Buy buy buy
Flat to long!
Have a blessed in the green close for everyone.

US100 BUYNasdaq is at final buy zone worthy position use sl ...
If break the point never look for buy
Trail sl every 35 pips

Where does NAS seem to go in next two months? (Macro Analysis)Fellas, lets talk about NAS Forecast and try to see what can we expect in the coming two months, JUN and JUL 2024.
The Bullish trend that started from JAN 2023 continues and NAS makes an All Time High at a level of 18951.
As per Chart patterns, we notice a very solid ABCD pattern for which the D point projection is at the level of 19300.
As per Time Cycles, the bullish rally continued last time for 86 bars on 1w timeframe (602 days) and this time, so the trend should last for a similar time. This tells us that the current Bullish trend should continue till JUL 2024.
If we talk about Seasonal behavior of NAS, the Index is bullish 5/10 times in JUN, 9/10 times in JUL and 5/10 times in AUG.
Overall, if we combine the above three findings, we conclude that NAS may go sideways in JUN as it went Sideways in MAR-APR this year, but the Bullish trend must continue. The likelihood of NAS going sideways in JUN higher than it going Bearish (falling below 17000).
Its currently at ~18668 and the next major Support levels to watch are 18389, 17858 and 16985
Let's see how it goes, and Plan your trades accordingly.

Nasdaq Bear Markethave sight of a parallel descending channel on nasdaq. Buckle up! Additions on the top of the channel. Profit taking on the break from channel up. I hypothesize it runs like this for days, but have to keep watchin'
