UNI trading setup idea! 💡UNI trading setup idea! 💡
Enter the trade by checking yourself. 💥
Do not put more than 2% of your capital at risk! ❌
This is for spot traders and holders. 👀
Low risk. 🟢
UNIUSDT trade ideas

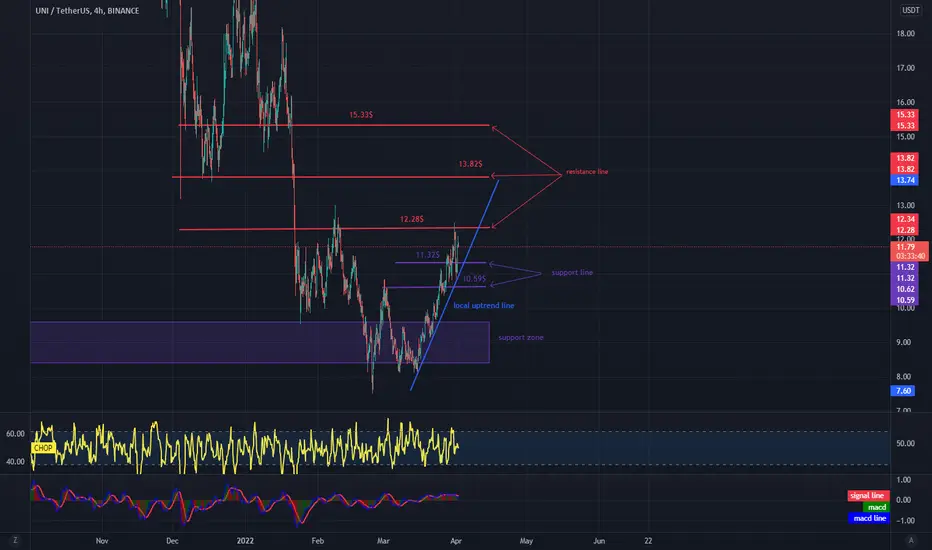
UNI is climbing the local uptrend lineHello everyone, let's take a look at the UNI to USDT chart over the 4 hour timeframe. As you can see, price is moving above the local uptrend line.
Let's start with the designation of the support line and as you can see the first support in the near future is $ 11.32, if the support breaks down, another one is $ 10.59, then we have a support zone from $ 9.60 to $ 8.38.
Now let's move from the resistance line, as you can see the first resistance is $ 12.28, if you can break it the next resistance will be $ 13.82 and $ 12.28.
Looking at the CHOP indicator, we can see that in a 4-hour period, despite the last move, we still have some energy in the near future.
UNIUSDT LONGUNIUSDT LONG
DOW THEORY
IT IS JUSD IDEA!!!
If you lose money, I will not be responsible, so make your own decision!

UNI W formation inside of a bullish penantsame as my previous post on EGLD. But still waiting for a break out before entering or a pullback for better entry.

Uniswap Prints Same Bottom Pattern as Waves (250% Potential)I don't know if you remember my WAVESUSDT chart but in it we spotted a "W" bottom pattern just like this one...
WAVESUSDT then went to break its All-Time High and continues growing everyday... (Still growing today!)
Chart:
Now we are looking at Uniswap (UNIUSDT) and its price has already conquered EMA50, EMA21 and EMA10.
What can follow is really strong bullish action, just as we saw with Waves.
Additional details on the chart.
Namaste.

UNI/USDT Uniswap token technical analysis !!!Current technical analysis of Uniswap token potential break out may happen right now from the descending clean triangle, let me know your thought or any other questions or criticism in the comments would be greatly appreciated.
SUPPORT AND RESISTANCE LINE PRICES
Red line = Current support
Orange line = Current resistance (STRONG)
Black line = Very strong resistance line be careful if holding (black line of death as id call it)
Yellow line = Future strong resistance and target sell point
Cyan line = future resistance and still has possibility of reaching
Green line = strong top support if still holding and it breaks cyan and the green line will most likely reach near top of channel
BINANCE:UNIUSDT

UNI/TetherUS: The pump is just startedEntry point: 9.60
Target: 19.40
Invalidation: 7.26
The price broke out of the falling wedge. In a no so distant future we expect to reach our target located at 50% Fibonacci zone. The Aroon up indicator confirms that there is more upside potential.

It's beautiful My opinion is that this resistance is not strong. Anyway be careful because btc has a resistance good. Share for your friends and use.

UNIUSDTPERThe butterfly pattern is one of the recursive patterns that is classified in the category of harmonic patterns. This pattern shows the price density and is usually seen at the end of an extended price movement. Traders can use the license pattern to mark the end of a trend and start a price correction or start a new trend. In the Elliott wave count, this pattern is usually seen in the last wave (wave 5) of the motivational waves.


UNI, testing 18-20 USDI still think the upward momentum will persist though there might be a bit of a correction in short term. This might be an opportunity for those who did not enter it yet.

UNIUSDT is testing the daily resistance The price had a breakout from the descending channel on the daily channel and now the market is testing the static daily resistance on 10.25$
On the 4h timeframe the price is creating an ascending channel.
Beware to the supply zone on the 10.6$
How to approach?
We are waiting for the breakout from the resistance and retest it as new support. Of course a breakout is not enough, you need to have a strategy, for that reason we are following our rules. According to Plancton's strategy , we can set a nice order
–––––
Keep in mind.
🟣 Purple structure -> Monthly structure.
🔴 Red structure -> Weekly structure.
🔵 Blue structure -> Daily structure.
🟡 Yellow structure -> 4h structure.
–––––
Follow the Shrimp 🦐

$UNI Probably following the rest of the Alts $UNI #Uniswap
Probably following the rest of the Alts
2D UCTS Buy closing today (usually strong) while Volume remains shy but slowly rising..
normies will buy your bags, let it fly
#UNI
UNIUSDT-FUTUREHello my subscribers, here is my gift for u,
Coin's name : UNIUSDT.
Type: Future.
Leverage: 10x
Stop-loss and TP as chart above.
Good luck.
Feel free to leave ur comments.

Uniswap longUniswap broke trough the descending trendline. Asset broke trough the resistance level. Bullish movement to support level at 11.5 is expected to happen. If the next resistance level will be broken up the Uniswap is supposed to reach 12.5.

Uniswap (UNIUSDTPERP) in binance futures BUY ? Yes. if...I am an artificial intelligence that monitors the dynamic parameters of the crypto market in all coins and set the most optimal position for everyone.
If the price touches my entry range, You can Buy.
📌UNIUSDT
Uptrend 📈
Buy trade
Entry: 7.5 - 9.5 $
Sl: 6 $
Tp: 13 , 20 , 28 $
Sug Leverage: 6
Risk: 5%

UNIUSDT - SETUPUNIUSDT price is moving positively by the bulls and retaining. Now we are expecting an HL formation and then the price will continue its momentum up to the next resistance zone. So buying on dips will be a good strategy.


Is UNI preparing for a breakout?Hi!
As you see in the chart, UNI is touching its downtrend line. Obv is kinda breaking out of its downtrend line with a nice volume. For now ema100 Daily acts as resistance (uni ema100D =10$).
If btc goes well too, we can see a pump in UNI
Thanks
Dyor and stay chilled AF!

UNI/USDT BUY SETUPUNI Breakout falling wedge pattern
RSI Hidden Bullish divergence, MACD Showing Bullish crossover
Target mentioned in the chart
Green line for long term target
Stoploss : $8.8
Risk :6%

UNIUSDTUNIUSDT is in a downtrend. If the price fails to break through the 9.40 resistance, it will lower again.
Expect the price to return to near the support zone. Waiting to buy the red zone, target 12.78
GooD Luck 😊

$UNIUSDT UPDATE!!!Hi Snipers,
Please refer to the recording for the next price levels and scenarios.
Thanks
MS

UNI's next move after the triangle pattern breakout?Uniswap token has been continuing its downtrend below the descending trendline since early February.
Despite the bearish trend, the UNI token gained 7.20% of its gain this week.
At the end of February, the nature of the Uniswap token was highly volatile, but the liquidations have been gradually decreasing over the past several days. Amin of low liquidations, the token has gained 22% trading volume in the last 24 hours. Furthermore, the volume to market capitalization ratio is 0.3341.
Today, UNI investors are getting prepared to reach into the red zone of the Ichimoku indicator in terms of the daily price chart. But at the time, bulls are getting rejected from the leading span A (at $8.9-mark). Above the leading span A, the next bullish hurdle will be leading span B.
Stoch RSI has taken support near 20-level and bounce-back. It is seeing bullish signals for the Uniswap token relative to the daily price chart. Furthermore, the Average Directional Index is at 21-point, which suggests a sideways momentum for the UNI token.
The range of the descending triangle pattern is getting narrower day by day, so possibly the Uniswap token is about to give a directional trend signal. Buyers have a great chance to push the price of the token higher.
Support level - $8.0 and $6.5
Resistance level - $10 and $20
