UNIThe price has broken the bearish wedge. 50-100-200 MAs and indicated zones are support levels. The price will maintain upward potential if it does not fall below MAs
UNIUSDT trade ideas

UNIUSDT
Hello Crypto Lovers,
Mars Signals team wishes you high profits.
This is a one-day-time frame analysis for UNIUSDT
In the current chart, we have R1 which used to be a support area but now it has the role of a resistance area. And S1 is our support area which includes the support of the price at some points although we had a failure in break, the price could recover itself over S1 again. Now the price is fluctuating below R1 and we have a reverse head and shoulders pattern. Our prediction would be a falling trend for the price and then a pull back toward R1 in order to complete the right shoulder. In case the price moves above R1 and fixes there, then we expect more rise. But even it possible for the price to lose the support and fall below S1.
Warning: This is just a suggestion and we do not guarantee profits. We advise you to analyze the chart before opening any positions.
Wish you luck

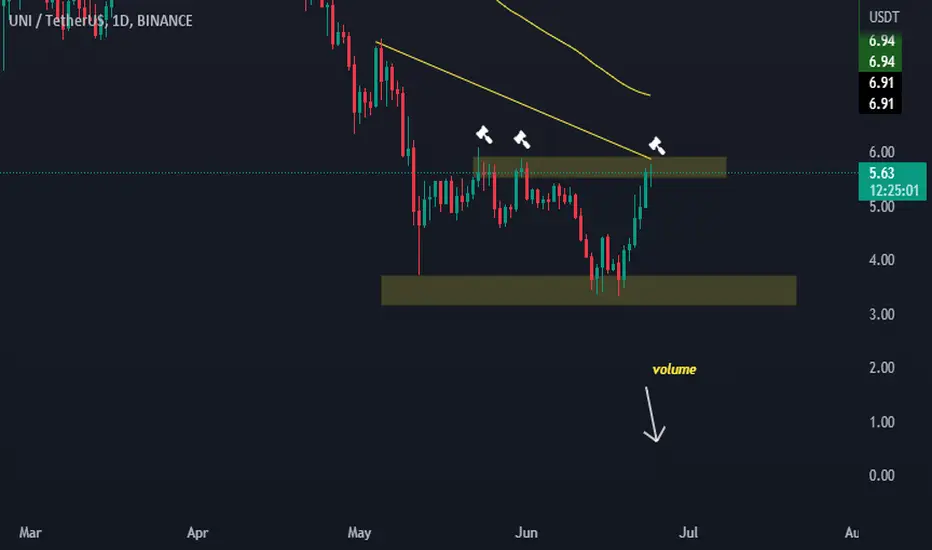
BULLISH CANDELL READINGi have seen inverted hammer candel for conformation we have to waite for next candel

UNIUSDT UPTREND REVERSAL , BREAKOUT
Hello Traders,
Please push the like button or comment if you like the idea,
- We can see clearly that UNIUSDT has broke the descending trendline of the downtrend after the accumulation that it took for a long time checking our HTF on 3D , price bounced back strongly from level support 3.31$ and had broken the last swing high of the downtrend with a decent amount of buying volume suggesting that buyers are trying to take control and ready to take the price higher towards resistance zone 7$ where price has been rejected before .
- Meanwhile #BTC is in uptrend since 18 june 2022 and now holding on level support 20000$ hoping for a decent bounce back yet we might see a small pullback towards 19k levels.
Please use your risk/reward correctly to trade the breakout.
Good luck Traders

UNIUSDT wants the supply zoneThe price is creating a W pattern, the price is testing the 4h resistance )the neckline)
The market created a supply zone on 5.2$ and the price could retest this area if the price is going to have the breakout.
How to approach it?
IF the price is going to have a breakout and retest the resistance as new support, According to Plancton's strategy , we can set a nice order
–––––
Keep in mind.
🟣 Purple structure -> Monthly structure.
🔴 Red structure -> Weekly structure.
🔵 Blue structure -> Daily structure.
🟡 Yellow structure -> 4h structure.
–––––
Follow the Shrimp 🦐


UNISWAP 1Day Bullish Cypher PatternTrade setup: Bullish breakout from Channel Down pattern, and above $5 resistance. Could revisit $7.50 next. (set a price alert).
Pattern: Price was trading in a Channel Down pattern. With emerging patterns, traders who believe the price is likely to remain within its channel can initiate trades when the price fluctuates within its channel trendlines. With complete patterns (i.e. a breakout) – initiate a trade when the price breaks through the channel’s trendlines, either on the upper or lower side. When this happens, the price can move rapidly in the direction of that breakout.
Trend: Uptrend on Short-Term basis and Downtrend on Medium- and Long-Term basis.
Momentum is Bullish ( MACD Line is above MACD Signal Line and RSI is above 55).
OBV (On Balance Volume): is rising, indicating that volume on Up days is greater than volume on Down days. Hence, demand (buyers) exceeds supply (sellers).
Support and Resistance: Nearest Support Zone is $3.50. The Nearest Resistance Zone is $5.00, which it broke, then $7.50.


UNI looks juicyI'm already in another short but this looks a juicy short opportunity. At 1h you can see here RSI at 4h is starting to show some bearish DIV but the real confirmation is the OBV and the volume itself (although we still have 2h until the closing).
I think that if the BTC uptrend continues these bearish signals will be invalidated otherwise this should dump within 26h. If UNI dumps most of DeFi tokens will follow.
Use stop loss unless you're using a small position in an isolated margin <-- that's what I usually do because I don't like being stopped and maybe seeing my target being reached, in a very volatile market like crypto it happens very often. It's a thing I don't advice you to do though, you need to be cold even if you go down a lot and it's very risky!
Good luck

Uni /usdt : Analysishello? Traders, welcome. If you "follow", you can always get new information quickly. Please also click "Like".
Have a nice day!. -------------------
3H chart :

UNIUSDT🔥 150% profit on your depositSubscribe to the channel to receive more new information about the cryptocurrency market✅
Hello everyone👋
On the daily chart, the price of UNI has formed a descending triangle formation, the asset is almost at the very bottom and, if the MM is successfully bought out, it will give a good percentage of the deposit.
I will consider the project as a long-term one.

$uni local shortuni local momentum looks done. waiting for confirmation with loss of the blue box.
really looking too long in on a higher time frame, but might pull the trigger on a short if we get the confirmation.

Uni usdt has a nice plan of good profits 📈Uni has a nice plan of huge profit in the next few weeks
If u can take the risk to follow this step u will make nothing less than 100% profit if btc didn't spoil the plan

UNIThe price has completed the double bottom pattern. an important resistance was broken, which became a support. If this support level is held, the price will rise to the next specified resistance level.

UNI/USDTA falling wedge is always a bullish pattern. By definition, a falling wedge always follows a major rising trend and has 3 stages: major rising trend, correction, and continuation of a rising trend.
This pattern is appropriate in denoting a bullish momentum in the market in the future.

UNIUSDT Short PositionThe price has been swinging in a range box for the past 7 days and now the rejection from the upper edge of the box is happening simultaneously with the rejection from the mid-term descending trendline. In addition, there is a hidden divergence in the RSI oscillator while the price did not manage to make a new HH.
Having said that, the price might be seen at around $3.5 again in the next few days.
DO YOUR OWN ANALYSIS.
DO NOT FORGET MONEY MANAGEMENT.
Things you might like:
- Trend Key Points Indicator have been used to draw important key levels and key points.
- You can use Big Moves Indicator to be aware of major moves on the chart by marking them and getting alert for them.
- 🔥 Bitcoin vs Gold

UNI/USDT: Direct recovery expected---- Mid-term Analysis for the next coming 4 weeks to 3 months - Daily on Daily Chart (LOG)-------
UNI/USDT: Direct recovery expected
Context
- The Global Crypto market leads by BTC and ETH is still evolving within a bearish market configuration. Like the others digital assets UNI suffered about negative global market situation
- UNI is expected to bounce from the current bottom area and triggered the bullish divergence on RSI
Market configuration
- Graphical Elements :
Graphical Resistance = 13,20 & 45,20
Graphical Support = 1,75
- Mathematical Indicators:
EMA ( Exp Moving averages) are being reintegrated = bullish
RSI indicator (below) is on going divergence but still below 50% = Neutre/bullish
- Elliot & Harmonic Wave (Fibonacci):
Fibonacci Target 5 (C) B is set at = 3,00
Fibonacci resistance of the wave in progress = 7,95
Fibonacci support of the wave 5 (C) B(max extension) = 1,75
Fibonacci Bullish Target = 13,20
Conclusion
Preferred case => Regarding the mid-term element, UNI is expecting to do a bullish reversal from the area we are now. We are bullish above 3,00 towards 13,20 with an intermediate level at 7,95. the ATH is set at 45,20
Alternative case => Breaking 3,00 direct drop to 1,75

uni long ideauni, for whatever reason, actually looks really good here.
will probably look for longs if we get a lower retest.
valid 3d bull div.

uni long?why do uni look this good? valid bull div on 3d.
if the market allows for it, this could easily run a good 90%.

UNIThe price has completed the double bottom pattern. 100 and 200 MAs are broken. Breaking through the specified support level will be a signal to continue the uptrend


Dow theory assignment 02 weekIf there is another HL candel confirm the trend is changing and we can go long
