USDCAD | 12 Apr 2024Anticipating longs here, but not so sure on the momentum side as the pair has already overextended upwards and a retrace is very likely to happen. Gotta keep an eye on it
USDCAD trade ideas

Continued bearish market in currency pairs against the dollarEsteemed analysts and traders,
I hope this correspondence finds you in good health and high spirits, prepared to tackle the upcoming week with renewed energy. I extend my best wishes for your continued success in all your business endeavors. It is worth noting that success in trading is largely dependent on the consistent definition and adherence to one's own rules.
As a supporter of the Elliott Wave Principle, I consider this methodology an invaluable tool for market analysis. After three years of personal experience, I have developed my approach by combining this principle with meticulous consideration of different market scenarios. I strive to avoid market surprises by maintaining a range of market prospects, which enables me to recognize the market structure forming with 100% accuracy.
I am pleased to share my analysis with you, with the caveat that I do not provide buy or sell signals. My perspective on idea analysis is entirely impartial, and if my analysis meets your standards, it may serve as a guide to making an informed decision.
For your reference and comparison, I have attached my previous analysis of the same market. All the details of my analysis are clearly labeled for ease of comprehension. Nonetheless, familiarity with the Elliott Wave Principle theory would facilitate an understanding of the analytical idea.
My study of the Elliott Wave Principle took nearly three years, during which my understanding and experience with this invaluable tool have grown. My progress thus far is a testament to the legacy of Ralph Nelson Eliot, whose genius has provided the foundation for my achievements. May he rest in peace.
I express my gratitude for your continued support and kindness, and welcome your comments and critiques.
May my analysis be a valuable asset to your business journey, and I remain sincerely yours,
Mr. Nobody

It should be seen how powerful DXY is? A historic riseEsteemed analysts and traders,
I hope this correspondence finds you in good health and high spirits, prepared to tackle the upcoming week with renewed energy. I extend my best wishes for your continued success in all your business endeavors. It is worth noting that success in trading is largely dependent on the consistent definition and adherence to one's own rules.
As a supporter of the Elliott Wave Principle, I consider this methodology an invaluable tool for market analysis. After three years of personal experience, I have developed my approach by combining this principle with meticulous consideration of different market scenarios. I strive to avoid market surprises by maintaining a range of market prospects, which enables me to recognize the market structure forming with 100% accuracy.
I am pleased to share my analysis with you, with the caveat that I do not provide buy or sell signals. My perspective on idea analysis is entirely impartial, and if my analysis meets your standards, it may serve as a guide to making an informed decision.
For your reference and comparison, I have attached my previous analysis of the same market. All the details of my analysis are clearly labeled for ease of comprehension. Nonetheless, familiarity with the Elliott Wave Principle theory would facilitate an understanding of the analytical idea.
My study of the Elliott Wave Principle took nearly three years, during which my understanding and experience with this invaluable tool have grown. My progress thus far is a testament to the legacy of Ralph Nelson Eliot, whose genius has provided the foundation for my achievements. May he rest in peace.
I express my gratitude for your continued support and kindness, and welcome your comments and critiques.
May my analysis be a valuable asset to your business journey, and I remain sincerely yours,
Mr. Nobody

USD/CAD: USD Strength and CAD Weakness: Exploring Factors BehindThe Canadian Dollar (CAD) faced downward pressure as a result of a juxtaposition between a robust US employment report and lackluster Canadian labor figures. While initially faltering, the CAD began to recuperate lost ground as the immediate impact of the data subsided.
Currently trading at 1.3599, the CAD contends with a resolute US Dollar (USD) poised for potential continuation of its bullish trajectory. The price maintains its position within a bullish channel characterized by higher highs and lower lows.
The US Nonfarm Payrolls report for March surpassed expectations, propelling US Treasury yields and the USD upwards. Despite the bullish market response, a closer examination of the data unveiled a slowdown in yearly wage growth, prompting speculation regarding the possibility of future Federal Reserve (Fed) rate cuts. This speculation persists despite the hawkish commentary from Fed Governor Michelle Bowman.
In contrast, Canada witnessed a decline in net employment levels in March, contrary to initial expectations. This divergence in economic performance between the US and Canada reinforces expectations for a bullish continuation of the USD.
Looking ahead, market participants will monitor evolving economic indicators and central bank rhetoric for further insights into the trajectory of the CAD and USD. Amidst this uncertainty, a bullish bias towards the USD prevails, supported by favorable economic data and Fed policy expectations.

USDCAD, breakout.USDCAD / 1D
USDCAD / 1D
Hello traders, welcome back to another market breakdown.
USDCAD has failed to break below old lows with a follow-through. The price deviated and came back inside the range. I expect the price to grow more after testing the last S/R level.
As mentioned before, I was waiting for the breakout from the current range then I'll look to engage with the pull-back phase.
Trade safely,
Trader Leo

Strifor || USDCAD-12/04/2024Preferred direction: SELL
Comment: The US dollar continues to strengthen before the weekend, but there is a high probability of a downward correction beginning, and this concerns all major currency pairs.
The Canadian dollar has one of the most interesting buying setups against the US dollar . The price is trading slightly above trend resistance, and it is unlikely that we will see continued growth. Although this probability remains, in this case we have scenario №2 , where growth may still be towards the level of 1.37500 . But it should also be noted in favor of scenario №1 that most of the sellers have already been liquidated, and the instrument is more ready to fall towards the designated target at the level of 1.36500 .
Additional comments on this trade will be provided as situation changes. Follow us!
Thank you for like and share your views!

uptrend Considering the behavior of the price in the current resistance range, it will be possible to continue the upward trend up to the specified Fibonacci levels
Otherwise, a correction to the specified support levels will be possible

USDCAD price may fall between the lines.The USD/CAD currency pair, also known as the "Loonie," is influenced by various factors that can lead traders to consider selling. Here are some potential reasons for a sell position:
Technical Analysis : The current technical analysis on USD/CAD suggests a strong sell signal based on moving averages and technical indicators.
Bearish Patterns: There has been a recent downward breakout from a bearish channel pattern, indicating a shift in momentum towards the downside and a potential for further declines.
Economic Indicators : Economic data releases, central bank decisions, and changes in market sentiment can all impact the value of USD/CAD.
Commodity Prices : As the Canadian dollar is often considered a commodity currency due to Canada's significant exports of natural resources, fluctuations in commodity prices, especially oil, can affect the CAD's strength.

Simple analysis for USDCADElliot Wave finish. ABC finish with a triangle pattern. Second ABC will finish the strange uptrend that seemed to not finish, but finally found the IV of the W.E. meaning that chart should go bullish and reach 300% of fibonacci.
It wasn't easy. It's my first time seeing an uptrend with so many waves.
Fibonacci is within 2 and 4 peak of E.W.
News are on stand by so, it should go according to plan.
[i ]Unless it makes another wave...

USDCAD Top Down AnalysisUSDCAD Top Down Analysis
H4: Directinal Bias
Price is in H4 Supply Zone. Sellers are
stepping in while buyers are weak.
Looking for Shorting positions from the
Supply Zone.
H1: Technical Analysis
CHoCH signals short term trend reversal and
wainting to be confirmed by BOS.
Short term trade will buy into the Supply Zone.
H15: Short term trade Buy Limit place at M15 Demand Zone,
SL below it and target M15 Supply Zone.
Long term trade Sell from M15 Supply Zone, SL above the
recent high, target the H4 Demand Zone.

Could USD/CAD bounce from here?The price is falling toward a support level, which is a pullback support that aligns with the 61.8% Fibonacci retracement and could bounce from this level to our take profit.
Entry: 1.36138
Why we like it:
There is a pullback support level
Stop loss: 1.35554
Why we like it:
There is a pullback support level
Take profit: 1.37245
Why we like it:
There is a pullback resistance level
Please be advised that the information presented on TradingView is provided to Vantage (‘Vantage Global Limited’, ‘we’) by a third-party provider (‘Everest Fortune Group’). Please be reminded that you are solely responsible for the trading decisions on your account. There is a very high degree of risk involved in trading. Any information and/or content is intended entirely for research, educational and informational purposes only and does not constitute investment or consultation advice or investment strategy. The information is not tailored to the investment needs of any specific person and therefore does not involve a consideration of any of the investment objectives, financial situation or needs of any viewer that may receive it. Kindly also note that past performance is not a reliable indicator of future results. Actual results may differ materially from those anticipated in forward-looking or past performance statements. We assume no liability as to the accuracy or completeness of any of the information and/or content provided herein and the Company cannot be held responsible for any omission, mistake nor for any loss or damage including without limitation to any loss of profit which may arise from reliance on any information supplied by Everest Fortune Group.

Swing Sniper Prints Sell Signal for $USDCAD30m sell signal printed. Quadruple confirmation of short by double Swing Sniper print and double Make That Money print. Also coming down off 4h supply zone. Should drop to green line for 1.5RR

USD/CAD: Potential Upside Before Downside Amid USD DevelopmentsHello Everyone,
Given recent USD news, we can't discount the possibility of further upward movement in USD/CAD before a potential downturn.
TradeWithTheTrend3344

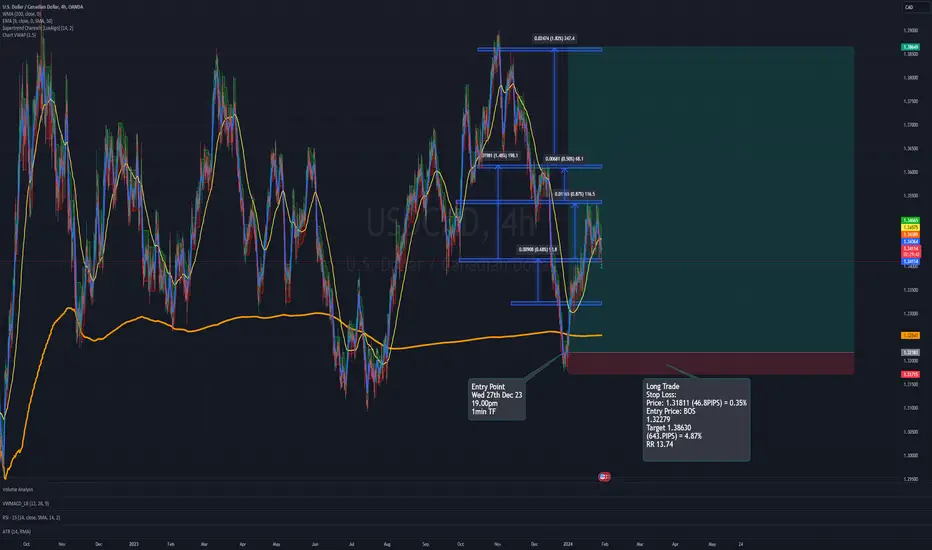
Long trade
Bias: Long
Placed my first trade for review...?
On December 27th at 18:00, I observed that we were at the end of a downtrend and in transition to the upside. According to the Wyckoff method, this would be Phase A and B (Multiple secondary tests) playing out.
The observation indicates a mechanical breakdown rather than a spring reaction in this instance.
Stop Loss:
Price: 1.31717 (47.5PIPS) = 0.36%
Set below the lowest candle wick and optimised trading zone (OTZ) for confluence.
Entry Price: 1.32192
BOS (Break of Structure) Noticed end of downtrend/mechanical failure and transition to the upside (Wykoff sentiment)
Target: 1.38594
Top of the range (November 1st, 2023)
RR 13.75%
Current position..
11th april 24
Level 1.37280
Observed 15.00pm
London/New York Session
Trade duration approx (3 months)

Long trade (swing) www.tradingview.com
Pair: USD/CAD
Condition
Structure: Day
Entry: 1Hr Time Frame
Bias: Long
On December 27th at 18:00, I observed that we were at the end of a downtrend and in transition to the upside. According to the Wyckoff method, this would be Phase A and B (Multiple secondary tests) playing out. The observation indicates a mechanical breakdown rather than a spring reaction in this instance.
Stop Loss:
Price: 1.31717 (47.5PIPS) = 0.36%
Set below the lowest candle wick and optimized trading zone (OTZ) for confluence.
Entry Price: 1.32192
BOS (Break of Structure) Noticed end of downtrend/mechanical failure and transition to the upside (Wykoff sentiment)
Target: 1.38594
Top of the range (November 1st, 2023)

Long trade USDCAD www.tradingview.com
Observe the demand level and Breakout of Support (BOS) at new demand level. I anticpate assumed levels of 1.33265 to 1.33798 for a potential retest of this zone. Once identified, consider entering the market from the pullback or retracement.
Continuation of trade since Dec 2023
I believe next day will be bearish to much liquidity left behindim going for the retracement level of the high 1.136130

Utilizing Adaptive Trend Finder (log) for USDCAD AnalysisHello fellow traders! Today, I'd like to share my insights on the USDCAD pair using one of my favorite tools on TradingView: the Adaptive Trend Finder (log). This tool is exceptional for identifying both short-term and long-term trends with great accuracy, employing the powerful method of Pearson correlation.
In the chart, you'll notice the Adaptive Trend Finder (log) located towards the bottom middle (in gray), indicating the strength of the trend for the long-term channel, and on the right (in yellow), representing the short-term channel.
I invite you to take a moment to analyze and interpret the signals you observe here. Feel free to share your thoughts and insights in the comments below. Let's engage in a productive discussion and learn from each other's perspectives!
Happy trading, and may the markets be in your favor!

USDCADAccording to the waves analysis we can expect that price rise again to the green zone. follow me for more ideas

USDCAD - Long from support zone ✅Hello traders!
‼️ This is my perspective on USDCAD.
Technical analysis: Here we are in a bullish market structure from daily timeframe perspective, so I look only for long position. My point of interest is if price makes a retracement to fill the imbalance lower and then to reject from trendline + S/R zone + institutional big figure 1.36000.
Like, comment and subscribe to be in touch with my content!

USDCAD: Strong Bullish Signal 🇺🇸🇨🇦
USDCAD formed a bullish flag pattern,
after a strong bullish wave caused by yesterday's CPI report.
The resistance of the flag was broken after the release of PPI
report today.
It is one more important sign of strength of the buyers.
Growth may continue at least to 1.3745 level.
❤️Please, support my work with like, thank you!❤️

USDCAD ShortLoving this setup, planned for price to come into this area last quarter. Even if its an L its well worth it in my opinion. Risking 5% and will swing, trade at your own risk!
USDCAD Short
Stop Loss: 20 Pips
Take Profit: 150 Pips
Risk %: 2%
Risk To Reward: 1:7.5

