USDCAD WILL EXPLODE BUYTP-1-------15Pip
TP-2-------35Pip
TP-3-------Full TP
Manage SL during news time, intraday trade tp and sl mentioned not a financial advice
USDCAD trade ideas

USDCAD | Hidden Bullish Divergence | AB=CDThe USDCAD chart has currently formed a Harmonic AB=CD Pattern, which indicates a Potential Reversal Zone (PRZ). Additionally, there is a Hidden Bullish Divergence on the 1-hour time frame, suggesting that the current downtrend is about to shift into an uptrend. Furthermore, the price has mitigated the Order Block (OB) and is now moving upwards. These confirmations indicate a short-term bullish momentum, although the overall structure on the higher time frame remains bearish.
In summary:
1: Harmonic AB=CD Pattern: This pattern suggests a potential reversal zone (PRZ).
2: Hidden Bullish Divergence: Observed on the 1-hour time frame, this indicates a potential shift from a downtrend to an uptrend.
3: Order Block (OB): The price has mitigated the OB and is moving upwards, supporting the short-term bullish momentum.
4: Higher Time Frame Structure: Despite the short-term bullish signals, the overall structure on higher time frames remains bearish.
It's important to consider these factors together and conduct thorough analysis before making any trading decisions.

USDCAD IDEAThis is just simple trading idea draw into chart using labels and lines. Please use it as educational purpose and you are free to modify any

BULLISH SENTIMENT ON USDCADEyes is on CANADIAN & US PMI EVENT that’s coming up soon. Price may go bullish if we get an offer at 1.36234. Price will impact positively if we get a retrace to that price Level of 1.36234.
A buy opportunity is envisaged

UCAD FOR BULLISHBe patient as the market fooling us hahaha. Let see if this structure can give me some money. Last week gained 100 pips and decide to close all entries before news. I still at the bullish side.

USDCADUSDCAD has-been falling lately until now where it failed to break the previous low,so that might the indication that the market might shift and change direction that is way I shared this setup for us to get a closer look where we will be able to spot our entries from.

USDCAD1. the price is being created is a corrective move
2. Following the move it makes, it is going the high liquidity zone where the price moved by impulse.
3. As we see there is trendline liquidity which can be swallowed and move up again
4. We wait if it will eat all the liq down and join the move up.
#This is not a financial advise

USDCAD Will Collapse! SELL!
My dear followers,
I analysed this chart on USDCAD and concluded the following:
The market is trading on 1.3685 pivot level.
Bias - Bearish
Technical Indicators: Both Super Trend & Pivot HL indicate a highly probable Bearish continuation.
Target - 1.3638
Safe Stop Loss - 1.3718
About Used Indicators:
A super-trend indicator is plotted on either above or below the closing price to signal a buy or sell. The indicator changes color, based on whether or not you should be buying. If the super-trend indicator moves below the closing price, the indicator turns green, and it signals an entry point or points to buy.
———————————
WISH YOU ALL LUCK

USD/CAD Primed for Bullish ContinuationHello Everyone,
The USD/CAD pair is positioned for further gains, with all indicators suggesting a bullish continuation.
TradeWithTheTrend3344

Possibility of uptrend It is expected that the price will move according to the specified path and after some fluctuation, the continuation of the upward trend will go up to the ceiling of the channelization.
Otherwise, it will be possible to continue the corrective process up to the specified support levels

Analyzing USD/CAD using price action Using a break and retest strategy with price action analysis for USD/CAD involves identifying key support and resistance levels and then waiting for the price to break through these levels before entering trades on the subsequent retest.


USDCAD Trading Signal: Buy OpportunityAttention Traders,
We have identified a potential buy opportunity for the USDCAD currency pair. Here are the details of the trade setup:
Direction: Buy
Enter Price: 1.37222
Take Profit: 1.37614667
Stop Loss: 1.36815667
Justification for the Signal:
Our forecast is based on an in-depth analysis using the EASY Quantum Ai strategy, which considers multiple market indicators and data points to generate precise and reliable trading signals.
1. Technical Indicators: Our algorithm has identified a strong upward momentum in the USDCAD pair, supported by key technical indicators such as Moving Averages and RSI, suggesting a continuation of the uptrend.
2. Market Sentiment: Market sentiment data points toward a bullish outlook for USDCAD, with significant buying interest observed in recent trading sessions.
3. Economic Factors: Favorable economic conditions for the US Dollar, in contrast to the Canadian Dollar, are expected to drive the pair higher. This includes positive economic data releases and central bank policies favoring USD.
Please be diligent and manage your risk appropriately by adhering to the Stop Loss and Take Profit levels provided.
Happy Trading,
The EASY Quantum Ai Team

USDCAD - sell ideaHS pattern may trigger the start of the extended move to the downside
Tried to mark the structure as I see it
A leading diagonal is strange, but it qualifies
Trade safe

USDCAD 1H Long Trade - 1:3 RRRPair: USDCAD
Action: Buy
RRR: 1:3
SL: 1.36572
TP: 1.39000
Indicators:
EMA200: The EMA200 serves as a critical indicator of the long-term trend direction.
MACD Trend: The MACD indicator helps traders assess the strength and direction of the trend.
Supertrend: The Supertrend indicator acts as a reliable tool for identifying entry points in alignment with the prevailing trend.

USDCAD Monthly IdeaUSD/CAD is poised for a breakout! Based on technical analysis, we're looking at a potential surge from the current 1.37660 all the way up to 1.52000 This could be a significant move, so keep your eyes peeled on the charts.
Do your own due diligence and factor in any upcoming economic news that might shake things up. As always, trade safe!

LONG TERM BUY USDCADIn a wide idea, USDCAD bought from June 2021. It has been pulling back and buying. There at the top, the pair left double top (liq) it must be swept no matter the long time is will takes
When it buys there is trendline liq below.
In the current price, we may witness a pull bach and rally again to MONTHLY OB a ove.
This is just expected move

USDCAD.. only one area, holding or not?#USDCAD.. so far market trade in range from last few decades but now today is NFP and after that in next week we have FOMC as well.
And upside we have only single area that is 1.3720 around
Keep close it and breakage of that level this time it will be very expensive.
Keep close it and buy only above that level and above that level a new buying era will start ..
Good luck
Trade wisely

UCAD BUY Trade Plan...Checking For...1. Buy Low at Previous Support
2. TP some...
3. On break of level...
Check for Bullish PA to add...

USDCAD LevelsI would like to say that these levels were designed to include the potential scenario where a correction from the recent bullish move gives rise to another wave pointing up, but unfortunately this whole design was developed for only bearish scenarios, at least until the middle of the project.
The polygon lurking near the current trading zone is a mystery as I am not convinced it can be penetrated, but I have left some icons in it just in case for potential milestones or even turnarounds.
The elements of higher interest for me in this project are the marked price levels for potential support/resistance action. The rectangles are not developed in a similar fashion, they are more like wild cards in case the price action will follow their overall design, then, after some confirmations of their relevance I might take them into account in trying to foresee what could happen, or even just use them as reference elements in update comments analysis .
While the project is design for a more bearish scenario, it will also try to catch the waves in both direction while we travel into the future, meaning all relevant candlestick setups near the elements will be considered for inspection regardless of the potential direction of the reversal.

USDCAD breakout possible todayIntraday Update: Ahead of the Bank of Canada rate decision today, the FX:USDCAD is in a (bearish wedge) with key support at 1.3600, resistance at 1.3700. The market is divided on a cut or not, so a breakout of the wedge is possible, but a hold could allow for a slide back below the key 1.3600 support.
We should also mention, US services ISM is due out around the same time which could add to the directionality of the pair as well.

USDCAD in focus ahead of interest rate decisionFor these reasons, we are bearish on USDCAD ahead of the Bank of Canada meeting:
- Dollar index is in a downtrend
- USDCAD is at the high of the value area of the move between late December 2023 and mid-April 2024, while the current candles show weakness
- Hidden bearish divergence in the CumulativeVolumeDelta

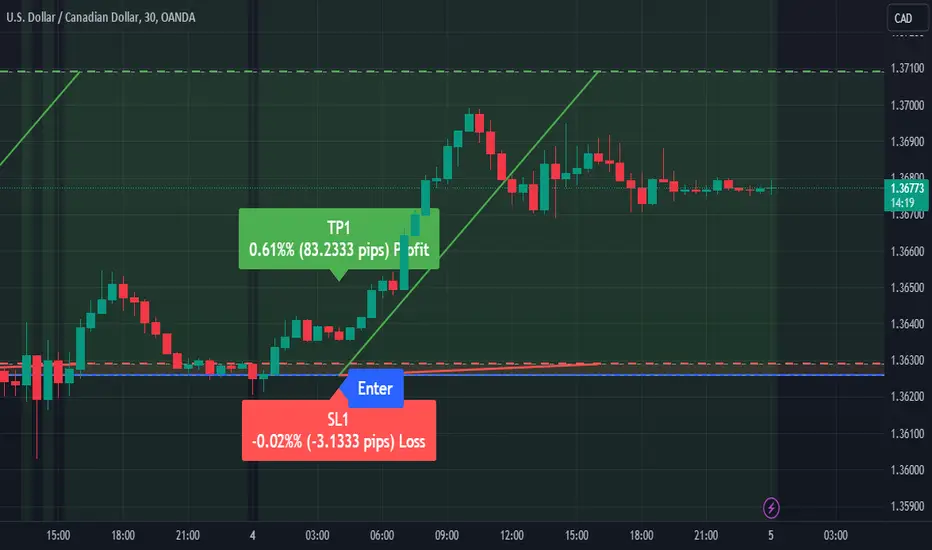
Trading Alert: USDCAD Buy SignalDirection: Buy
Enter Price: 1.36258
Take Profit: 1.37090333
Stop Loss: 1.36289333
Justification:
The prediction for the USDCAD currency pair to move upward is based on a combination of market analysis and algorithmic insight provided by the EASY Quantum Ai strategy. Several factors have contributed to determining this Buy signal:
1. Market Sentiment: Current market sentiment indicators reveal a bullish trend for the USD against the CAD, influenced by stronger economic data from the US.
2. Technical Indicators: Key technical indicators such as Moving Averages, RSI, and MACD demonstrate a potential upward momentum. The price action is showing positive divergence, suggesting a forthcoming rally.
3. Fundamental Analysis: Recent developments and favorable economic reports from the US are likely to support USD strength. Conversely, slower economic growth forecasts for Canada may weaken the CAD.
4. Quantitative Analysis: The EASY Quantum Ai model has analyzed historical data patterns and predicts a probable upward movement.
By entering the market at 1.36258 and setting the Take Profit at 1.37090333, the strategy aims to capitalize on the expected bullish movement. The Stop Loss at 1.36289333 is placed to manage risk effectively.
This forecast is based on insights and advanced algorithms from EASY Quantum Ai, blending technical, fundamental, and quantitative analyses for a comprehensive trading decision.