USDDKK-BUY strategy Daily chartthe pair is overdone on downside, and we are at the low of the channel. Further, RSI oversold and stochastic near positive.
Strategy is BUY @ 6.6330-6.6370 and take profit @ 6.7087 for now. Stop-loss below 6.6000.
USDDKK trade ideas


USDDKK - Long1. Overall trend is bullish
2. Fib 0.786 acted as resistance and currently shows a strong indication of acting as support.
3. Medium risk as there is possible resistance close to TP1

USDDKK – Bullish? Not really but watching … week of 14 Nov 2022This pair has been falling like a ton of bricks the whole of last week. I have a feeling this could change now, because:
- the area around 7.1800 has been a solid S/R zone for this entire year.
- The 200 dma is nearby too and could act as dynamic support.
However, I do need to see some evidence of bullish strength before I commit to a trade. For this is I will be monitoring price action on 4 hour and even the 1 hour chart, looking for signs that the bulls are gaining control. These signs can come in the form of double bottom, hammer or an engulfing candle formation.
For now this is a counter trend idea, so even if a setup forms, I would recommend an initial half position size. If this works out as per my expectation, we should have a +2R trade, with a possible extension to 4R.
Always use sound money and risk management and stay patient in all your trades.
If you like my analysis, please give it a “thumbs up” and follow me to get even more awesome content.
What do you think about this trade idea? Please comment and share your thoughts!!

USDDKK Excellent Sell & Buy Signals within this MegaphoneThe USDDKK pair has been trading within a Bullish Megaphone pattern since the January 28 2022 High. Every of the pattern's Higher High has been on a +0.5 Fibonacci progression starting from Fib 1.0 and with the most recent two days ago on the Fib 2.5 extension. Those Fibonacci levels are an even longer-term pattern that you can see if you zoom out of the chart.
What has given incredibly accurate signals within this Megaphone has been the 1D RSI. Every top within its Resistance Zone has been a Sell Signal while every rebound on the Support Zone has been a Buy Signal. As you see three days ago the RSI topped within the Resistance Zone and pulled-back aggressively, giving us the most recent Sell Signal. Technically the target is the 1D MA50 (blue trend-line) and the bottom (Higher Lows trend-line) of the Megaphone where we can buy again once the 1D RSI hits its Support Zone. Naturally, if the same Fib progression is followed, we should expect the Megaphone to make its next Higher High on the Fib 3.0 extension.
Be aware that a candle close below the Megaphone can invalidate all this and instead start targeting the lower Fib levels as a correction. In such cases we can expect the longer-term Support of the 1D MA200 (orange trend-line) to be tested.
-------------------------------------------------------------------------------
** Please LIKE 👍, SUBSCRIBE ✅, SHARE 🙌 and COMMENT ✍ if you enjoy this idea! Also share your ideas and charts in the comments section below! This is best way to keep it relevant, support me, keep the content here free and allow the idea to reach as many people as possible. **
-------------------------------------------------------------------------------
You may also TELL ME 🙋♀️🙋♂️ in the comments section which symbol you want me to analyze next and on which time-frame. The one with the most posts will be published tomorrow! 👏🎁
-------------------------------------------------------------------------------
👇 👇 👇 👇 👇 👇
💸💸💸💸💸💸
👇 👇 👇 👇 👇 👇


USDDKK SHORT TRADEI am going short after seeing a bearish doji form at resistance. I will be targeting previous support.

USDDKKsell at 7.4000 or wait for break out 7.3600 in H1 time frame.
your stoploss will be 7.48 and tp is 7.2550.
good luck.
forexplayers

USDDKK in bullish rallyThe bullish trend is seen in the USDDKK pair, it is expected that it will continue its upward trend untill the peak resistance.


USDDKK `` RR/2.5x `` RR/6.5xHehe... saw pattern when it was much younger.
Itz gone farther now- LTF skit.
Hopefully, it retraces to this level, if should provide opportunity for you again.

A Roadmap Reversal Strategy Using Higher TimeframesHi Purpose Traders. If you've been struggling with reversals and when to use more timeframes to trade them, I created a video for my client Eddie that I wanted to share with you all. He has progressed so much and is overcoming one of the greatest fears most traders have which is relinquishing control over the trade.
I pray this video helps you as well. Be blessed.

USDDKK 23rd MAY 2022Amid losses across markets on fears of the impact of soaring inflation , a hawkish Federal Reserve and the Russo-Ukrainian conflict. Coronavirus-induced damage to the public finances has been minor, reflecting a large fiscal surplus prior to the pandemic. In response to Russia's invasion of Ukraine, Denmark has pledged to donate 2,700 anti-tank weapons to Ukraine.
Market participants sought refuge in safe-haven assets amid fears of the impact of a spike in inflation that hit its highest level in four decades. Dollar still tends to strengthen with a bearish correction for the next few weeks.

USDDKK Two spots for a comfortable long-term buyThe USDDKK pair has been trading within a Channel Up for more than 1 year. The recent 1D RSI sequence points to a medium-term top. Long-term buyers can either enter on the 1D MA50 (blue trend-line) on a tight stop loss and if triggered wait for the final buy on the 1D MA200 (orange trend-line), which buy the time will be on the Higher Lows (bottom) of the Channel Up.
--------------------------------------------------------------------------------------------------------
** Please support this idea with your likes and comments, it is the best way to keep it relevant and support me. **
--------------------------------------------------------------------------------------------------------

USDDKK at PCZ of Bearish AB=CD with RSI Bearish DivergenceThis could be a Double Top of sorts that would atleast take us down to the Neckline at C


USDDKK Forecast: 4.82% Increase Entry Price 6.70095 Take Profit Price 7.02361
(4.82% Increase)
Broken Level
Retested Level


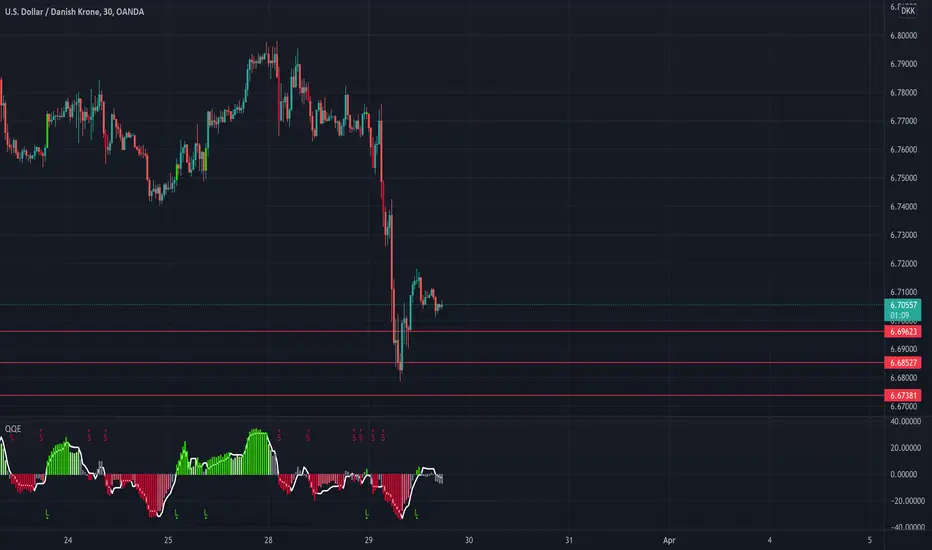
USDDKKAt 30 minutes time frame, we have an untouched green cloud that I have specified in the chart ... the price will definitely return to this range
This is my personal opinion. Please do not trade based on my analysis and data.
