UpdateIf this pivot holds , we are good to go .
Retracement is still 3 wave looking structure.
Normaly 5 waves are stronger than 3.
Waves 2 are usually sharp zig zags with deep retracements.. Here we have one.
VETUSDT.3L trade ideas

Vet Buy TradeHere is My Study on Vet.
Welcome to my channel! Here you'll find daily technical analysis ofthe latest trends in the crypto market. From Bitcoin to altcoins, I'lIl be sharing my insights and predictions to help you make informed decisions
about your investments. Follow me for the latest updates and join the conversation in the comments!
Crypto technical analysis uses past price history to predict future price. It's not a guarantee and shouldn't be relied on solely for investment decisions. Consider other factors such as market trends, economic strength and
information dissemination. Use with caution.
This Is Not A Finacial Advise

VET is Ready for its Next Bullish Rally | VET/USDT Analysis 💎 VET/USDT is currently navigating a robust demand zone, hinting at a potential upward shift.
💎 Not long ago, it skillfully tapped into liquidity, tackled the descending OB, and set its course upward.
💎 As of now price is consolidating but we're on the lookout for a bullish surge past the trend line.
💎 With a clear supply zone and liquidity just above, there's a strong chance the price will engage with this level in the near future.
💎 In the ever-evolving crypto landscape, staying updated is crucial. Keep an eye out for further insights and savor your trading adventure.

VET S&R in short-mid term>>>>>>>I Have Tried My Best to Bring the best Possible outcome in this Chart.
All important resistance's in Short -Mid - term marked on the chart.
It's Not a financial advise.
PLZ DYOR
With hopping succes


Vet is Good Vet strongly Breaked A Corner
its nicely above 50 ema 4H chart
targets are as shown
Vet is good :)

VET will jump soon!!!Vechain is almost breaking the diagonal resistant, if im you, i will not miss this!!

VETUSDTAs the chart illustrated, we can see triangle pattern with broken side and as this chart checked in weekly time however everything is correct.

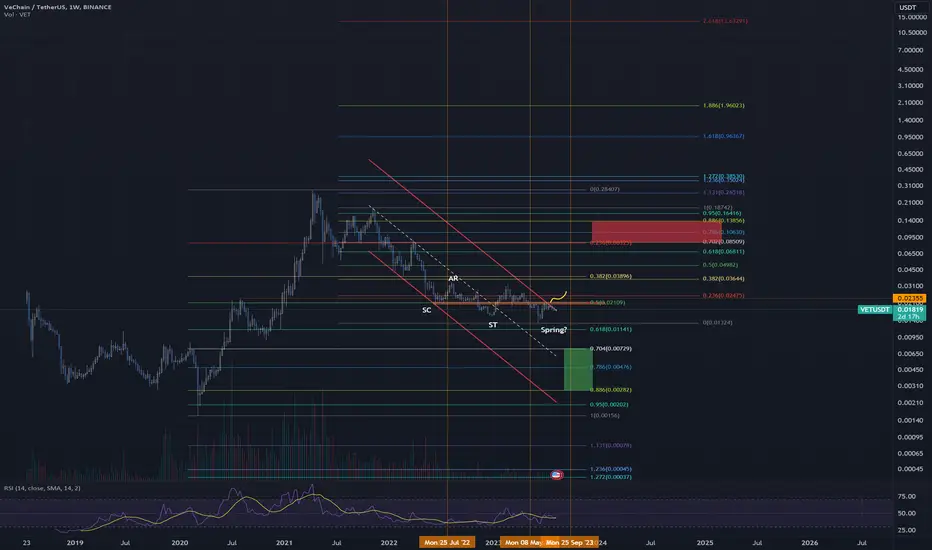
VET VECHAiN about to spring?dancing right on the 0.5 fibb level and about to break the downtrend after possibly creating a bottom for 1+ years
Strong next move in either direction expected.
---
If you like my content, if it helps you gain profit, give it a like!
Thanks!
---
Hold my beer pls
----
No financial advice, do your own research, don't be stupid
🚨 Trade Update: VET/USDT (3-5x)🚨 Trade Update: VET/USDT (3-5x)
📉 Short Entry: 0.01870 - 0.01779
OTE (Optimal Trade Entry): 0.01820
SL: 0.01915
B/E Move: When it moves close to TP2
TPs:
Short Term: 0.01760 - 0.01700 - 0.01650 - 0.01600 - 0.01550 - 0.01500 - 0.01450 - 0.01400
**Disclaimer: Past profits do not guarantee future results.
Is there a risk? Of course. The whole financial market is subject to risk; any fundamental reason or sudden change in the market sentiment can reverse the current market dynamic and cause a loss. Do not take excessive risks which you cannot afford to lose. There is no obligation to take this trade; please avoid the trade if you disagree with the trade analysis.
EDK FORUM TRADING®

BE READY TO FLY TO THE MOON #VETA triangle shaped and it is clear.
As we all know triangles have 5 waves in them : A-B-C-D-and E .
Each of these waves is subdivided to 3 waves .
last day #VET Price formed the last wave of triangle (E).
the price reacted to the bottom line of triangle so well.
breaking triangle's top is expected .
the market is beautiful and we are working on it.

Vet updateLow time frame. 2 paths presented.
Have to se C in a motive wave form.
For the moment i dont see it.
Perhaps dump incoming for all crypto.
But Impulsive structure seem to be clean on this one from mid june.
Expecting higher highs generaly.

VET and the Impressive 640 risk to reward opportunity Hi Everyone;
today we have one of the best risk to reward Investment opportunity
it is more than 640 times the risk and the chart is look very promising.
I expect breaking the previous bear market key point will clear the way to the final target

Vet VibesThis inbetween noise and stop hunt is more and more often seen because of the smart money concepts and markets going towards liquidity.
I would call wave A micro to be an impulsive one, so i would be suprised if wave B micro goes above the 5 impulse level.
Since Zig Zags are 535 structures.

VETUSD ❕ buyers are trying to strengthenVET fixed above 50EMA at 4H TF.
50EMA broke above 200EMA at 30m TF.
I believe that the asset will start rising after fixing above the resistance level.

Vetusdt.p long scenarioHi guys.
I think the direction of altcoins changes according to the direction of Bitcoin.
we set up a long scenario under the condition that Bitcoin's downside correction stops.
In rare cases, a symmetric triangle pattern may appear in wave 2 of Elliott.
If Bitcoin's downward correction is not over, it will rise again after checking the end of the line after breaking out of the symmetric triangle with the abc wave.
This is not a but&sell signal. good luck to you

#VETUSDT #LQR #TOBTC #LaqiraProtocolAccording to the price chart, if breaking dynamic support or dynamic resistance specified after confirmation, it can penetrate to certain Levels obtained from the crosses of Fibo levels and static levels. In all the specified levels on the chart, after confirmation and matching with Bitcoin levels, you can open a position This analysis is not an offer to buy or sell

Tit for tat | Wait a breakoutDaily Chart
BINANCE:VETUSDT is in the triangle pattern and trading at 0.0188x
It can be break up or down so need to wait
Time will tell and find the good entry

Epic shuttle flight for profitVeChain launched a platform for creating blockchains without coding. Please watch this epic flight.

Bottom range: 0.01840-0.02299Hello?
Traders, welcome.
If you "Follow", you can always get new information quickly.
Please also click "Boost".
Have a good day.
-------------------------------------
(VETUSDT chart)
In conclusion, VET is currently a buy time for the mid- to long-term.
Since the 0.01840 point or less is a long-term investment area, it is recommended to proceed when it shows sideways in the 0.01840-0.02299 section in order to proceed with the purchase from a mid- to long-term perspective.
Otherwise, if you buy below 0.01840, you will have a really tough time because you never know when the price will actually rise.
For more details, check out each chart below.
(1M chart)
From a long-term perspective, it is expected that a full-fledged uptrend will begin only when it shows support around 0.02695.
(1W chart)
Since the Bollinger bands have started to contract, the question is whether it can be supported near the HA-Low indicator on the 1W chart and rise above the HA-High indicator on the 1W chart.
So, we need to see if it can get support around 0.01858 and rise around 0.02355.
(1D chart)
The key is whether it can get support around 0.01797-0.01858 and rise above 0.01958-0.02062.
Therefore, it is important to be able to sideways within the 0.01797-0.02062 interval.
In that sense, the volatility period is around August 3-17.
-----------------------------------------------
Of the many indicators or lines displayed on the chart, the most important are the horizontal lines that mark points of support and resistance.
Trading is to create a trading strategy and respond to it according to how it moves on these horizontal lines.
Therefore, in order to mark the points of support and resistance, you need to look at the 1M, 1W, and 1D charts in order and mark the points of support and resistance.
This is because support and resistance points are the strongest lines drawn on the 1M chart.
Therefore, other indicators or lines are not directly related to the trading strategy as they are supported or resisted at support and resistance points and are viewed from a trend perspective.
The reason why several lines are drawn on the chart in advance is that the positions of support and resistance points may change each time you see them depending on price volatility or your own psychological state.
Since this can cause fatal problems in creating a trading strategy, support and resistance points must be marked based on objective data.
-------------------------------------------------- -------------------------------------------
** All descriptions are for reference only and do not guarantee profit or loss in investment.
** Even if you know other people's know-how, it takes a considerable period of time to make it your own.
** This is a chart created with my know-how.
---------------------------------

Sometimes i wanna say it has to goNot certain on the shape of the wave B for the moment, but almost certain that the C isnt in yet. And thats the buying opportunity.
This could be almost txt book exapmle of an Elliott wave 5 up and clean 3 down retracement for longing.
Freaking send it!

VET/USDTIn my opinion, wave 4 is formed in the form of a triangle pattern. With this setup, I will buy for wave 5

#VET/USDT looks heavy in 4-Hour TF!#VET/USDT looks heavy in 4-Hour TF!
NYSE:VET needs to reclaim the Trendline to gain bullish momentum. Rejecting from PWL and good for short.
