VETusdtI think vet will pump up. But of one day in future, not right now. I have a diamond hand on Vet/usdt.
VETUSDT.3L trade ideas

vet usdt short term targetif you satisfied my plan please like
0,77 is a support and o.8 is a trend line support

VET (Not looking too good)Bulls couldn't break the resistance on the blue apex line. This is the first rejections. There might be more downside for VET if we get a second retest on resistance, and we failed to break it.
VET 1H


VET APEX Triangle (Retest)VET going for retest. Rsi fell below support 45.48. We need to reclaim back above this weekly timeframe support, so as to get continuous momentum towards the upside.
VET 1H

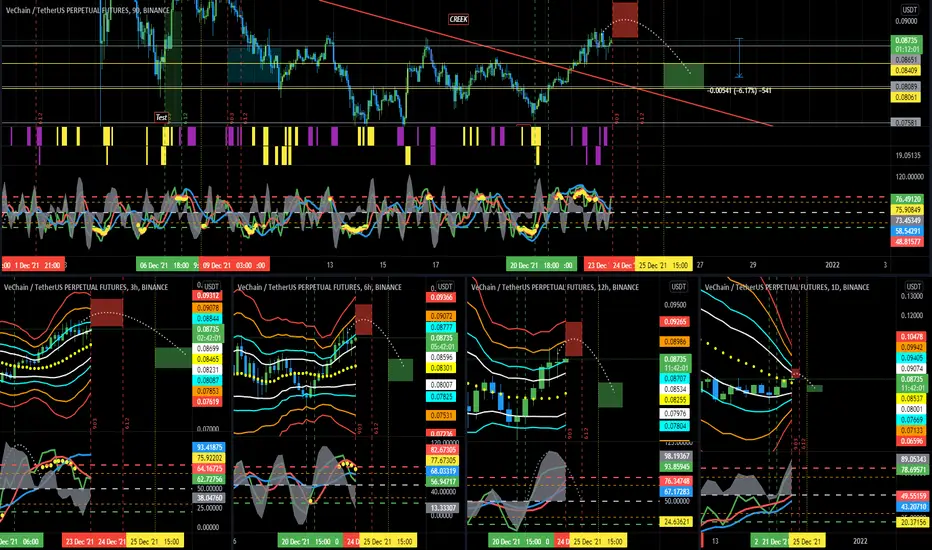
VET - A pullback to $0.084 - $0.086Hi, iJustCoiners!
The same as for SUSHIUSDT for VETUSDT we are on the verge of seeing an exhaustion as well.
For VET i found it suitable to have correction to the 6H White Lower/Yellowe Basis price range.
I pointed on the chart a potential momentum of the reversal using Red Dashed lines and the selling price range using Red Rectangle.
I expat the price to drop down to $0.084 - $0.086 price range pointed on the chart with Green Rectangle.
Estimate time is pointed at the chart with Yellow Dotted line.
I'll we waiting for an entry lower-timeframes as always.
Have a nice day!
And remebmer: this market doesn't respect doubters!
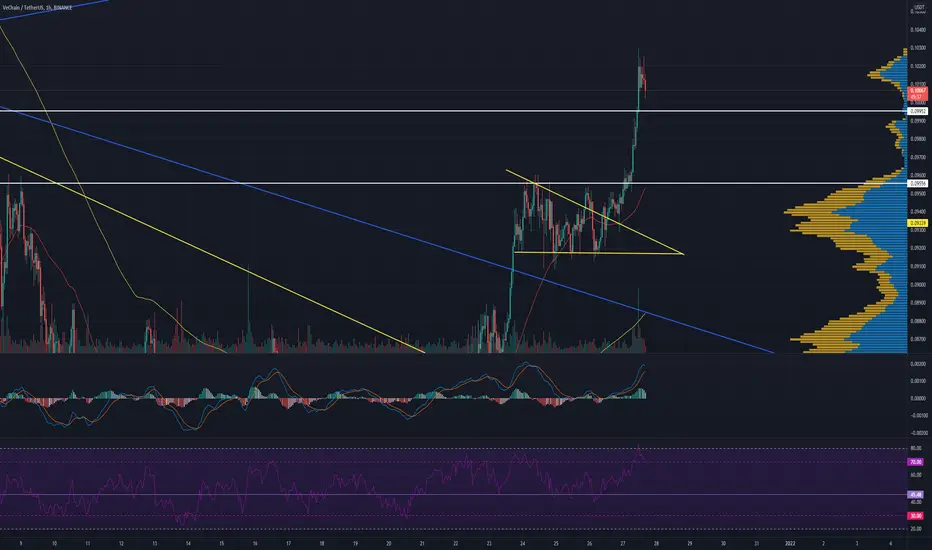
VET MovingVET broke out, a better entry would be to wait for a retest at 0.09952. Overbought on the RSI
VET 1H
$VET /USD, Buy signals everywhere..$VET /USD
Buy signals everywhere..
Aiming for 10cents as 1st important level for this one
#VET


VETUSDT-LONGThere is a long position in VETUSDT VeChain
VETUSDT VeChain
🔵Long Now or set on Key Level 0.09400
🟢Target 1 0.09900
🟢Target 2 0.10400
❌Stop loss 0.09180
#K_Level
Please support our activity with your likes and comments.

VET - can buy it with these TPBYBIT:VETUSDT
1H trend chart
-
VET has broken out the triangle and it is testing Fib1
If price can take out 0.0961, trading strategy as below.
-
Profit Targets:
a) 0.0996~0.1010----Fib(1.272~1.382)
b) 0.1040----Fib(1.618)
c) 0.1089----Fib(2)
Stop losses:
a) 0.09275-----Red horizontal ray
-
If you like this analysis, smash the "like button" and leave a comment below to share your thoughts
or let me know what crypto you want to see!
Trading is a reflection of yourself. Learn more daily and be ready for every opportunity.
Have a nice trading!

VET Big Symmetrical Triangle reboundVET/USD (Daily)
Bullish Case
- Uptrend Support Line being held, seem to have found Support between $0.07-0.08 area which is previous supports and range for a while now.
- Symmetrical Triangle intact.
- MACD/Signal and Histogram reversing
- RSI low and reversing.
- Bullish Divergence with RSI.
- Market Cipher B shows a Big Bullish push-up with a print of multiple Green Dots printed at the lows.
Bearish Case
- Can see further drops to the next lows at $0.055-0.06
Thoughts?

VET cup and handle setup ready to popVET cup and handle setup is about to break,
Always do your own analysis, Good luck

vet/usdtthis currency is in a square pattern and we expect it to rise.
in rsi, it has grown every time it hit the bottom of the channel.
also supported in designated areas.


The beautiful VET flag will be raised soon ???Hello dear friends
The beautiful VET flag will be raised soon ???
Yes to my idea
This coin had a good reaction to the bottom of the Channel
And created a positive Sharp trend
And now, after a tight correction, he is ready to do the next part of the climb
******Appropriate entry points for supports and resistances according to the chart*******
If you like this idea, Please Follow me and do not forget that your likes and comments are very important
Thanks dear friends.
Be generous and rich.


VeChain in Critical ZoneVeChain Trade in Critical zone that may start up trend if level 0.8800 show support to trigger up trend that target level 0.1200 and 0.1300 for the First impulse wave

RR=2.16 short buyharmonic pattern ( above 1.618 and reaching 2) + rising flag
testing an old resistance

0.11500 ?We keep the up tend tell the end of the year if something like this happens!
Happy Holidays!

VET USD Log Ascending ChannelVechain versus US Dollar, Ascending Log Channel analysis using Fib channels for resistance and support watchdogs.

VET APEX Triangle (Recovery?)VET broke out, as you can see in my chart. RSI rising and it's above the support line which i drew base on weekly timeframe (VET often bounce off from that level, giving traders more confirmation on a up trend). VET charts is really beautiful with APEX triangle bullish pattern, sadly it broke down due to to BTC dump not long ago. I'm looking for a possible price movement back into the APEX and consolidate for awhile before breaking out of the APEX. Very bullish for VET.

Analysis VET/USDT on Daily chartRSI is slowly moving towards 50, which indicates a possible upmarket. The Heikin Ashi indicator is also showing green blocks (indicator below). Which also confirms we're most likely looking at a possible uptrend.
In the chart I am using the Supertrend Ninja indicator, which is a trend-following indicator (Green and red vertical line with arrows).
When the background of the candlestick closes green (vertical line) with an upwards pointing pink arrow. It indicates a possible bullish (up)trend.
The Supertrend Ninja indicator is forming its 9th bullish signal for the 1 day chart in 2021. Six out of 9 signals, the price indeed went higher with a Monster Trend on March 2021.
Supports and resistances are displayed in grey. With below the price a strong support.
With each trade I make, proper risk management is essential. Either by using the Trailing Stoploss Bottom Activation indicator, visible as orange dots below the candles. Which sends an alert, when current price goes below the previous candle low. Or using the Heikin Ashi Trailing Stoploss Activation, the indicator below with green and red blocks. Or third option, exit when the Supertrend Ninja indicator displays a vertical red line with a downwards pointing black arrow. Remember, the first stop(loss) is always the cheapest stop.
Thank you for reading.
Namasté
Disclaimer: Ideas are for entertainment purposes only. Not financial advice. Your own due diligence is highly advised before entering trades.
Past performance is no guarantee of future returns.
