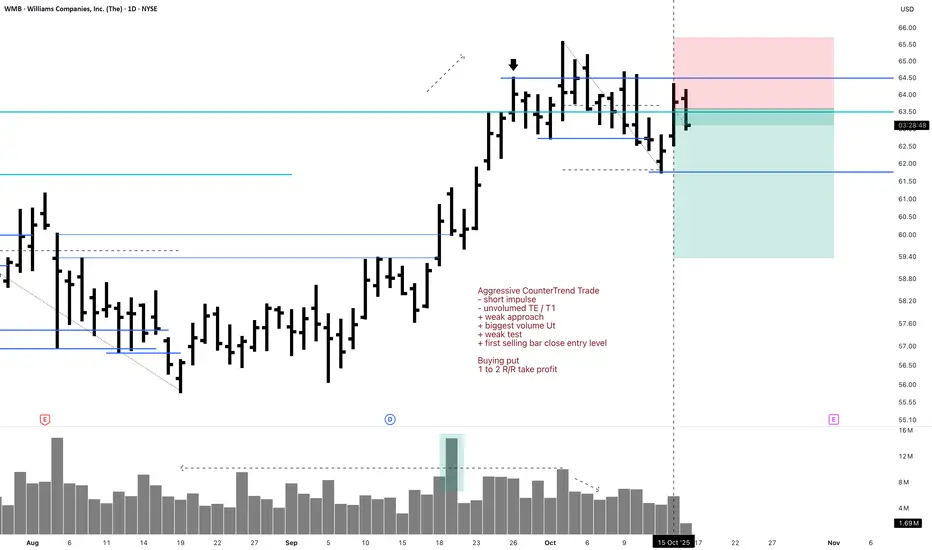
WMB 1D Short Aggressive CounterTrend Trade (Put Buy to Open)Aggressive CounterTrend Trade
- short impulse
- unvolumed TE / T1
+ weak approach
+ biggest volume Ut
+ weak test
+ first selling bar close entry level
Buying put
1 to 2 R/R take profit
Monthly CounterTrend
"- short balance
+ volumed expanding CREEK
+ resistance level
= wrong volume distribution w
Next report date
—
Report period
—
EPS estimate
—
Revenue estimate
—
1.94 USD
2.23 B USD
10.75 B USD
1.22 B
About Williams Companies, Inc. (The)
Sector
Industry
CEO
Chad J. Zamarin
Website
Headquarters
Tulsa
Founded
1908
Identifiers
3
ISIN US9694571004
The Williams Cos., Inc. operates as an energy infrastructure company, which explores, produces, transports, sells and processes natural gas and petroleum products. It operates through the following segments: Transmission and Gulf of Mexico, Northeast G&P, and West. The Transmission and Gulf of Mexico segment consists of interstate natural gas pipelines, the Transco and Northwest Pipelines, as well as natural gas gathering and processing and crude oil production handling and transportation assets in the Gulf Coast region. The Northeast G&P segment includes midstream gathering, processing, and fractionation businesses in the Marcellus Shale region primarily in Pennsylvania and New York, and the Utica Shale region of eastern Ohio. The West segment consists of gas gathering, processing, and treating operations in the Rocky Mountain region of Colorado and Wyoming, the Barnett Shale region of north-central Texas, the Eagle Ford Shale region of south Texas, the Haynesville Shale region of northwest Louisiana, and the Mid-Continent region which includes the Anadarko, Arkoma, and Permian basins. The company was founded by David Williams and Miller Williams in 1908 and is headquartered in Tulsa, OK.
Related stocks
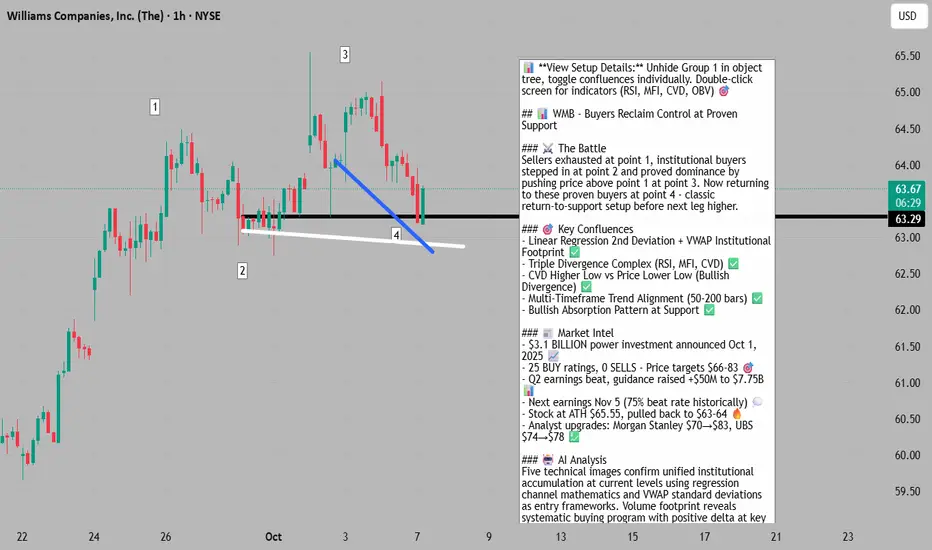
Buyers Reclaim Control - $3.1B Catalyst Ignites Breakout📊 **To view my confluences and linework:**
Step 1️⃣: Grab the chart
Step 2️⃣: Unhide Group 1 in the object tree
Step 3️⃣: Hide and unhide specific confluences one by one
💡 **Pro tip:** Double-click the screen to reveal RSI, MFI, CVD, and OBV indicators alongside divergence markings! 🎯
Title: WMB:
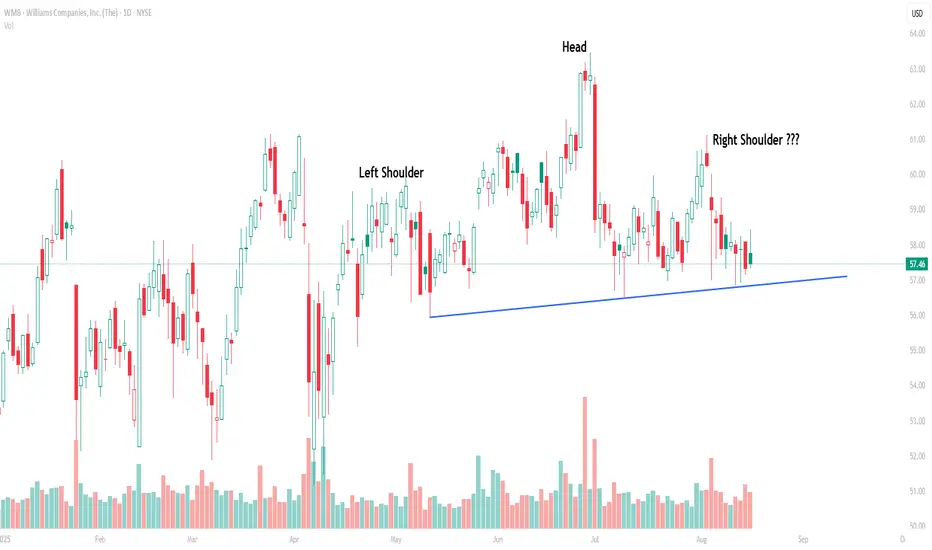
Pattern Decoded: WMB’s Potential Head & Shoulders in the MakingKey Note: Let’s keep it straight — until the neckline breaks, this remains a potential Head
& Shoulders (H&S), not a confirmed one. A close below $56.5 on strong volume would
be the real confirmation trigger.
Currently, WMB is sketching what looks like a bearish Head & Shoulders pattern. The
left sh
WMB eyes on $61.xx: Significant Resistance should give a Dip-BuyWMB moving up nicely with energy stocks for AI.
Just hit a significant resistance at $61.14-61.26
Looking for a Dip-to-Fib or Break-n-Retest here.

WMB Breakout from Ascending Triangle 🚀
📝 Description:
WMB is showing strong bullish momentum after forming a clean ascending triangle. Price broke above horizontal resistance near $61.10 with higher lows intact. This move could signal trend continuation.
📍 Entry: $61.12
🎯 Target: $61.97
🛑 Stop Loss: $60.80
📊 Setup Type: Breakout / Tr

WMB ShortI expect a retracement in price of WMB stock to 40$ for the following reasons:
- Price is in a Major resistance
- Divergence on MACD
- Ascending wedge

Buy Williams CompaniesShort Term Trading Advice by Naranj Capital
Buy Williams Companies
● Buy Range- 42.3 - 42.8
● Target- 45 - 45.5
● StopLoss- 41.3
● Potential Return- 5-6%
● Duration- 14-15 Trading Days

Williams Companies ,,, Pullback Uptrend
As you see, the pullback has been completed. There is a good pullback to a broken price level and a good bullish candle, as a trigger, after that. I suppose setting a SL of about 39.5 can be sure and next target about $46.

Williams Inc ,,, Buy opportunity Uptrend
New rising has been started after about one month moving side. Seems the next target at about 46 will be reached very soon and after passing that 60 will be available. Do not forget SL is vital for traders (37 suggested) .

WMB - Pullback within trendTook entry here Jul 18 after WMB closed below the 9 - first time since Jun 23 - and took out the Jul 18 O in the opening bars. Looking for a new SH here over $34.25. Thirteen days to earnings so plenty of time for this to print a higher high and test that DTLR around $34.65. Volume has been below av

See all ideas
Summarizing what the indicators are suggesting.
Neutral
SellBuy
Strong sellStrong buy
Strong sellSellNeutralBuyStrong buy
Neutral
SellBuy
Strong sellStrong buy
Strong sellSellNeutralBuyStrong buy
Neutral
SellBuy
Strong sellStrong buy
Strong sellSellNeutralBuyStrong buy
An aggregate view of professional's ratings.
Neutral
SellBuy
Strong sellStrong buy
Strong sellSellNeutralBuyStrong buy
Neutral
SellBuy
Strong sellStrong buy
Strong sellSellNeutralBuyStrong buy
Neutral
SellBuy
Strong sellStrong buy
Strong sellSellNeutralBuyStrong buy
Displays a symbol's price movements over previous years to identify recurring trends.
B
BRMQ4645595
Blue Racer Finance Corp. 6.625% 15-JUL-2026Yield to maturity
6.69%
Maturity date
Jul 15, 2026
M
D3700033
MountainWest Pipeline, LLC 4.875% 01-DEC-2041Yield to maturity
6.09%
Maturity date
Dec 1, 2041
See all WMB bonds
Curated watchlists where WMB is featured.

Midstream oil: The middlemen of the energy sector
35 No. of Symbols
See all sparks
Frequently Asked Questions
The current price of WMB is 60.53 USD — it has increased by 1.46% in the past 24 hours. Watch Williams Companies, Inc. (The) stock price performance more closely on the chart.
Depending on the exchange, the stock ticker may vary. For instance, on NYSE exchange Williams Companies, Inc. (The) stocks are traded under the ticker WMB.
WMB stock has risen by 0.27% compared to the previous week, the month change is a −3.44% fall, over the last year Williams Companies, Inc. (The) has showed a 8.17% increase.
We've gathered analysts' opinions on Williams Companies, Inc. (The) future price: according to them, WMB price has a max estimate of 83.00 USD and a min estimate of 58.00 USD. Watch WMB chart and read a more detailed Williams Companies, Inc. (The) stock forecast: see what analysts think of Williams Companies, Inc. (The) and suggest that you do with its stocks.
WMB stock is 2.20% volatile and has beta coefficient of 0.46. Track Williams Companies, Inc. (The) stock price on the chart and check out the list of the most volatile stocks — is Williams Companies, Inc. (The) there?
Today Williams Companies, Inc. (The) has the market capitalization of 72.66 B, it has decreased by −1.81% over the last week.
Yes, you can track Williams Companies, Inc. (The) financials in yearly and quarterly reports right on TradingView.
Williams Companies, Inc. (The) is going to release the next earnings report on Feb 23, 2026. Keep track of upcoming events with our Earnings Calendar.
WMB earnings for the last quarter are 0.49 USD per share, whereas the estimation was 0.51 USD resulting in a −3.31% surprise. The estimated earnings for the next quarter are 0.57 USD per share. See more details about Williams Companies, Inc. (The) earnings.
Williams Companies, Inc. (The) revenue for the last quarter amounts to 2.92 B USD, despite the estimated figure of 2.88 B USD. In the next quarter, revenue is expected to reach 3.00 B USD.
WMB net income for the last quarter is 647.00 M USD, while the quarter before that showed 546.00 M USD of net income which accounts for 18.50% change. Track more Williams Companies, Inc. (The) financial stats to get the full picture.
Yes, WMB dividends are paid quarterly. The last dividend per share was 0.50 USD. As of today, Dividend Yield (TTM)% is 3.36%. Tracking Williams Companies, Inc. (The) dividends might help you take more informed decisions.
Williams Companies, Inc. (The) dividend yield was 3.51% in 2024, and payout ratio reached 104.57%. The year before the numbers were 5.14% and 68.91% correspondingly. See high-dividend stocks and find more opportunities for your portfolio.
As of Jan 7, 2026, the company has 5.83 K employees. See our rating of the largest employees — is Williams Companies, Inc. (The) on this list?
EBITDA measures a company's operating performance, its growth signifies an improvement in the efficiency of a company. Williams Companies, Inc. (The) EBITDA is 6.38 B USD, and current EBITDA margin is 53.72%. See more stats in Williams Companies, Inc. (The) financial statements.
Like other stocks, WMB shares are traded on stock exchanges, e.g. Nasdaq, Nyse, Euronext, and the easiest way to buy them is through an online stock broker. To do this, you need to open an account and follow a broker's procedures, then start trading. You can trade Williams Companies, Inc. (The) stock right from TradingView charts — choose your broker and connect to your account.
Investing in stocks requires a comprehensive research: you should carefully study all the available data, e.g. company's financials, related news, and its technical analysis. So Williams Companies, Inc. (The) technincal analysis shows the strong buy rating today, and its 1 week rating is buy. Since market conditions are prone to changes, it's worth looking a bit further into the future — according to the 1 month rating Williams Companies, Inc. (The) stock shows the buy signal. See more of Williams Companies, Inc. (The) technicals for a more comprehensive analysis.
If you're still not sure, try looking for inspiration in our curated watchlists.
If you're still not sure, try looking for inspiration in our curated watchlists.