Long bitcoinwe have buying some volume comes from the bottom, so far looks good, not decline below the 50% yet, still have some selling forces. Looking for the second low volume test at bottom, good luck and manage the risk;
XBTUSD.P trade ideas

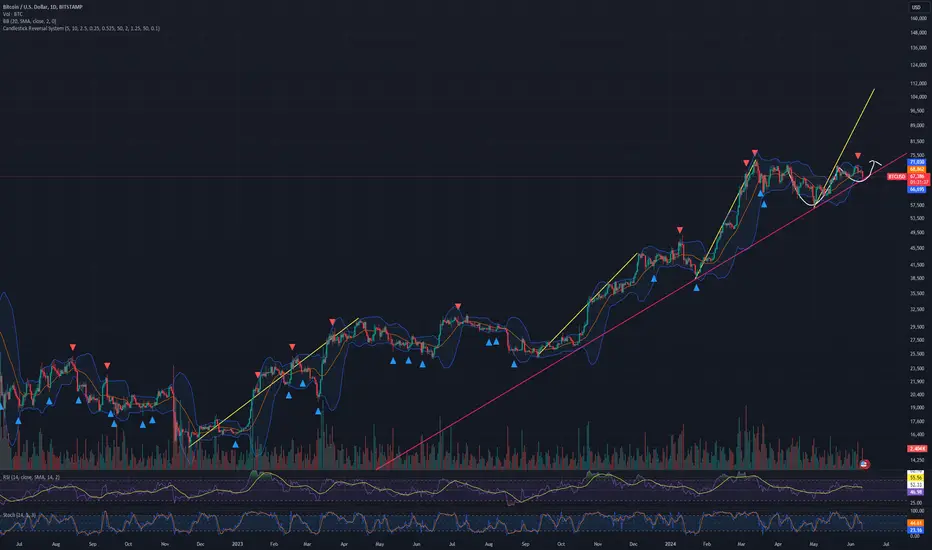
(BTC) bitcoin some line divides as a potential coverage of the placement of different momentum between progress of the cryptocurrency chart for Bitcoin. Ignore the gray line because it was only the line used to draw the distances not necessarily there as a particular direction or angle of the chart of BTC.

2024-06-12 - a daily price action after hour update - bitcoinGood Evening and I hope you are well.
comment: Interesting day. I did almost no updates on the posted chart. The pink breakout line was king again and I shorted it a second time for another 3000 points. I don’t care if the triangle is broken to the upside, when the market turns around again, it was a trap and the pattern lives on in my world. This market is not behaving as bullish as almost everyone on twitter tells you. Today nasdaq had an almost 2% day while Bitcoin stayed below 70000.
current market cycle: trading range
key levels: small range 66600 - 70000 / big range 56000 - 74000
bull case: Bulls tried to break to the upside but the breakout price around 70000 proofed strong resistance again. I don’t know how many times they will try again but I think the number is very low. Triangle will break tomorrow. Bulls need 70000 and above, otherwise it’s lights out.
Invalidation is below 66000.
bear case: My target for the bears, if they break 66000 is 65000. There I will decide how strong the move is and if we can get to 64000 fast. If they fail to close tomorrow below the daily ema at 68600, my bearish wave series is probably wrong and we more more sideways until we get a bigger impulse.
Invalidation is above 70000.
short term: Neutral here inside the triangle. —unchanged
medium-long term: down to 40000 (could take 3-6 months). Could also drop to 20000 again but let’s make 40000 first and see how many want to buy there. —unchanged
current swing trade: None.
trade of the day: Short the breakout price around 70000, was good for 3000 points.

BTCUSDLooking for short position within the current price range towards the FVG and possibilities to tap the bullish trendline.
Price is rejection the resistance level in the same level "71980" as the PMH (previous month high)

Bitcoin PA and the FED Rate rises History since 2021
The chart explains itself really but we can see that BTC PA has not been effected Directly but more by the impact on other organisations, Mostly Banks.
What will be interesting to see i nt eh coming months, is what happens when the FED curs rates, probably in September 2024.
On average, when the FED Pivots, Stocks fall...people tend to forget this.
We shall have to wait and see if Bitcoin can ride it out, thoguhj I feel ETF's have changed the game a LOT

Expired BTC.USD Weekly outlook. 2nd WK JUNE 2024Expired BTC.USD Weekly outlook. 2nd WK JUNE 2024
> BULLISH 📈 CORRECT
Closed Price: 70,769
Target Price: 71,895 | Strike Price: 71,992 JUNE12 24'
Upper Range: 87,841
Lower Range: 55,949

Bearish Ascending TriangleBTC could drop 30% by the end of July if it breaks down from the ascending triangle pattern.

Bitcoin bullish outlookI like how Bitcoin is respecting the support I have marked out. Off we can end the day with a string bullish candle to give a bullish engulfing I would like to see price go back to the highs. Maybe break them and retrace and continue the bullish trend

$BTC dip oppurtunity/shakeout before 100k #CupNHandleI think the MonStars ie; BTC, NVDA, TSLA, AAPL, all shaking weak hands before breaking shorts summer plans... Yellow lines showing "parabolic" / hyper growth... increasing angles/ of breakout... this will be last call under 70k for a while if right...
Haven't figured out exactly how to play this, maybe BITO options?
Stay tuned...
BTC Next levels to look at above You can see here on the chart that there is a 4hr breaker block above the REH marked out on the chart, I will set alerts here to to see if we dig into that for a short set up.
As we are currently at the previous days high and holding around there i would only consider a short here if we start building another breaker block on the 15m and come back and retest it to short it.
For now it's just monitoring what is going to happen for the next set up

BITCOIN ( BRAKING TURNING LEVEL )BITCOIN
Tendency the price is under BULLISH pressure at 67,241
Turning level : The turning 67,241 , so as long as the price above this level, there will be a bullish trend
resistance level : the trading above the turning level 67,241 , the price will rise to 70,059 stabilize this level , there will be reach 72,154 and 73,154
support level : The trading stabilizing below 67,241 , the price will reach the support level of 64,764
corrective level : price will attempt 67,241 , correct itself before rising

A Bullish Outlook for BTCUSDIn the ever-evolving world of cryptocurrency trading, recent developments in global monetary policy have sparked renewed interest in the BTCUSD market. With the European Central Bank's (ECB) recent decision to trim interest rates and today's release of better-than-expected Consumer Price Index (CPI) data, coupled with ongoing speculation of potential interest rate cuts by the Federal Reserve (Fed), traders are eyeing long positions in Bitcoin (BTC) with a bullish outlook.
Adding to the narrative, recent market dynamics reveal a pattern of range-bound trading in the BTCUSD market, with the $72,000 level serving as a key resistance level. As we anticipate a repetition of this pattern, informed traders are positioning themselves strategically to capitalize on potential price movements.
Here's how traders are navigating these market conditions:
Capitalizing on Central Bank Policies: The ECB's decision to lower interest rates underscores the prevailing sentiment of accommodative monetary policies aimed at stimulating economic growth. In response, traders are flocking to Bitcoin as a hedge against potential currency devaluation and inflationary pressures, driving demand and upward price momentum.
Interpreting CPI Data and Market Expectations: Today's release of CPI data, slightly below expectations but still indicative of moderate inflationary pressures, has provided clarity on economic conditions. With the Fed expected to follow the ECB's lead and implement rate cuts, traders are anticipating a favorable environment for Bitcoin investments, as lower interest rates reduce the opportunity cost of holding cryptocurrencies.
Technical Analysis and Strategic Positioning: Building on recent market trends, traders are employing technical analysis to identify key support and resistance levels. With the $72,000 level emerging as a significant resistance barrier, traders are setting profit-taking targets (TP) at this level, anticipating a potential retracement or consolidation. For risk management purposes, a stop-loss (SL) level at $67,000 is being widely utilized to mitigate downside risk.
Market Sentiment and Long-Term Outlook: Despite short-term volatility, sentiment remains overwhelmingly bullish among long-term investors, driven by Bitcoin's growing adoption as a store of value and inflation hedge. Institutional interest, coupled with increasing retail participation, further validates Bitcoin's status as a viable investment asset, with the potential for substantial long-term gains.
In conclusion, the convergence of central bank policies, economic data releases, and technical market analysis paints a compelling picture for traders seeking opportunities in the BTCUSD market. By leveraging strategic insights and risk management techniques, traders can position themselves to capitalize on potential price movements while navigating market volatility effectively.
As always, traders are encouraged to conduct thorough research, stay informed of market developments, and adhere to disciplined trading strategies to achieve their financial objectives in the dynamic world of cryptocurrency trading.

Bitcoin | btcusdt | btcusd on the verge of a brekout Bitcoin | btcusdt | btcusd on the verge of a brekout BINANCE:BTCUSDT
btc looks extremely bullish above $69305 , support $66660

BTC Bounces At SupportWelcome to The Wolf Den! This is where I share the news, my ideas about the market, technical analysis, education and my random musings. The newsletter is released every weekday and is completely FREE. Subscribe!
The Wolf Den Is Sponsored By BLENDR!
Why $BLENDR? The world of GPU computing is changing fast, and there's a huge need for affordable and powerful computing power, especially in fields like artificial intelligence and content rendering.
Purpose: Blendr is introducing a new decentralized network that utilizes unused GPU resources all over the world, in order to give access to high-performance computing. Blendr uses blockchain technology to create a marketplace for GPU power, making computing more efficient and cheaper. This new approach makes the process scalable and cost-effective.
This newsletter is made possible thanks to BLENDR. Show them some love!
In This Issue:
F-O-M-C
Bitcoin Thoughts And Analysis
Altcoin Charts
Legacy Markets
FTX Is Still A Mess
Crypto And AI Will Be Epic
Elizabeth Warren Begs For Rate Cuts
This Chinese Bank Is Praising Bitcoin And Ethereum
Bitcoin Sinks | Here Is What Happened And What To Do Now (Buy The Dip)
F-O-M-C
Eight times a year, a group of influential policymakers convenes to set economic policies that profoundly impact the value of everything we own, consume, and experience. Their decisions shape the financial landscape and reverberate through our daily lives.
The seven governors, who serve 14-year terms, wield significant power. They are appointed by the President and confirmed by the Senate. The only officials who typically outlast them in their positions are Supreme Court Justices, who serve for a lifetime, subject to good behavior.
The decisions of these individuals not only deeply affect Americans but also have global implications, as the United States continues to exert dominance in banking, capital markets, and fiat currency worldwide.
Today, these individuals will meet for the fourth time this year to deliberate on policy, form opinions on the market and economy, and ultimately decide on the necessity of rate cuts. While I've always maintained that the market and Bitcoin will act independently, significant shifts in tone or posture are bound to have lasting and far-reaching effects.
Interestingly, these meetings have had a notable impact on a particular asset class that operates outside traditional markets: cryptocurrency. Both risk-on and risk-off assets tend to experience heightened volatility in the days surrounding these meetings, with Bitcoin and the broader cryptocurrency market often standing out as the most reactive.
A trend has emerged, which I believe has not garnered sufficient recognition.
I conducted a retrospective analysis of Bitcoin's response to these meetings, beginning with the most recent and going back to the middle of last year. While volatility isn't perfectly aligned from meeting to meeting, the patterns are remarkably consistent. It's almost as if one could predict the timing of FOMC meetings just by looking at the chart. See below for the results.
I didn’t adhere to strict guidelines when collecting this data; at most, I looked just a couple of days before or after the meeting. Barely a stretch.
2024 FOMC Meetings:
June 11-12: $70,000 to $66,500 then… TBD
April/May 30-1: $64,500 to $57,000 then springs back in a few days
March 19-20: $67,500 to $61,500 then springs back same day
Jan 30-31: $43,500 to $42,000 then springs back in one day
2023 FOMC Meetings:
Dec 12-13: $43,800 to $40,700 then springs back same day
Oct/Nov 31-1: $34,500 to $35,600 then falls back in a couple of days
Sep 19-20: Insignificant volatility
July 25-27: Insignificant volatility
June 13-14: Insignificant volatility
What you will notice is that the FOMC tends to have a more pronounced impact when the market is already in a reactive state. For example, from June 2022 to September 2023, Bitcoin price action was relatively stable. However, in October 2023, Bitcoin began to rise, and subsequently, FOMC meetings became highly volatile profit-taking/deleveraging opportunities for the market.
Based on this data, my prediction is that Bitcoin will experience a sharp upward move in the next few days, rebounding most, if not all, of the drop. I’m not taking a trade based on this hunch, and neither should you. My thoughts should never dictate your strategy, but that’s my guess. Any deviation from this trend would mark a departure from the four/five consecutive, nearly identical data points we've observed leading up to this point.
Moreover, an unaccounted-for hiccup, nose scratch, or twitch of the right arm from Jerome Powell could send the market into a frenzy. I don’t make the rules; they do.
The trend remains upward; do not risk your Bitcoin with leverage unless you are extremely confident, well-capitalized, and comfortable with the possibility of 100% losses.
Godspeed. Valhalla awaits.
Bitcoin Thoughts And Analysis
DAILY CHART
I am beginning to annoy myself. The compulsion to share a bitcoin chart in every newsletter, every day is problematic, when we all know that nothing has changed.
Months of sideways were expected, and that is what we are getting.
And at the moment, a highly predictable bounce (hopefully it lasts) at support in the middle of the range.
Yawn.

CPI & FOMC JUNE 12th Massive day for BTC, crypto and the broader markets as CPI and FOMC take place in a time where BTC has taken a dive back towards the range MIDPOINT.
Both CPI & FOMC are forecast to be non movers, with 3.4% and 5.5% respectively. Last month CPI was the catalyst for the move from 0.25 to range high, however some of that hard work has been undone in recent days.
I would like to see the same kind of move but this time from the MIDPOINT which often provides a better starting point to a move. What we don't want to see if BTC is to keep bullish HTF momentum is lingering around the midpoint level with a view to target range lows yet again. Buyers need to come in fast before momentum is lost.
With sentiment so low but price constantly knocking at the door of ATH, ETF's being approved leading to institutional investment, mining rewards halved and a US election on the way this year. Big things are about to happen in the world of cryptocurrency and Bitcoin is the one leading the charge as it so often does.
Be greedy when others are fearful springs to mind. There is definitely fear in the market and its participants, The chart once you zoom out does not give me reason to be fearful just yet, this is a Bullrun and dips like these can be turned into wins.

Is it time for a Bitcoin rally?
BTCUSD :
Bitcoin is out of our flag channel but should hold above 67000.
The movement we expect from Bitcoin is to move up to the specified targets.
But we have two scenarios in mind.
1. Shorts position scenario:
If it loses the support range of 67,000, it will move to the price of 65,000
And you can wait for the price to return to 67000 for a sell position down to 63000.
2. Long position scenario:
Consider the flag is completed.
And open your position at this point for buying with a stop loss of 59800
Or to be more sure of the start of the upward trend, we should set our buy stop position at the limit of 72500 and 74000.
For the specified targets:
84
100
110

BTC local levels to watch out for You can see here the FVG below that was taken during the Asian Range, and there's an order block above. These are key levels to watch out for when we get the NY-AM open for the CPI release today.
I suspect we'll see a trade setup form around that time. Right now, I'm just eyeballing these levels, with the REH (relatively equal highs) just above the Asian range. This could act as a reversal point if we get a displacement from this level or the order block above.
It's a bit too early to tell what will happen, so let's wait for the setups to develop.
#BTC #Crypto #Trading #CryptoTrading #SmartMoneyConcepts #TradingView

Short BTCUSD Now ! Bitcoin has already reached a resistance that is suitable for whales to sell. I am waiting for it to drop from 67000 to 63000 and because I think it will drop to 50000, so I have no idea about the right price for Long position.

BTCUSD forms a double top patternOn the daily chart, BTCUSD fell back after testing the 72,000 mark, forming a double top pattern in the short term. At present, attention can be paid to the resistance near 68,450. If there is resistance at this position, short selling can be considered, and the downward target is the 60,500-63,000 area.

correction It is expected that the upward trend will change in the resistance range and the resistance trend line and continue the downward trend.
If the price crosses the 127% level, the downward trend will be canceled

June 11 Bitcoin Bybit chart analysisHello
It's a Bitcoinguide.
If you have a "follower"
You can receive comment notifications on real-time travel routes and major sections.
If my analysis is helpful,
Please would like one booster button at the bottom.
Bitcoin 30-minute chart.
Tomorrow is the day when the CPI meets on Wednesday evening and the FOMC meets on Thursday morning.
There is no separate indicator announcement from NASDAQ today.
The beat alone continues to decline.
In the long run, Bitcoin is on the rise, but
From a mid-term perspective, just the two of us with Tether Dominance
An endless power struggle continues.
It seems like the direction will be decided tomorrow rather than today.
The section where the rising pattern breaks in tether dominance and
Based on the recovery of Bitcoin's medium-term pattern
I created today's strategy.
*Sky blue finger movement path
Two-way neutral
Short -> Long switching strategy
1. Short position entry area of $67907.5 / Stop loss when the pink resistance line is broken
2. Long position switching at $66795.5 / Stop loss when the green support line breaks away
3. $68,700 long position primary target -> Top secondary target
After a vertical decline in an ambiguous position on the Bollinger Band 6-hour chart
There was no clear short position entry point.
You can operate as a short->long or long position waiting strategy.
If you touch the bottom first, the green support line is $66795.5.
The long waiting period can be in contact with the Bollinger Band daily chart support line.
It becomes a seat.
In that case, it is directly connected to the downward trend line.
Bottom -> You can deviate significantly from section 1.
You must be careful.
Today I shook it moderately.
After connecting after tomorrow, from CPI
I think we need to come up with a new strategy.
It's hard to explain, but as I left a comment,
For beginners or those who only operate spot exchanges,
I think it would be a good idea to run it after CPI and FOMC.
Please note that my analysis up to this point is merely for reference and use.
I hope you operate safely with principled trading and stop loss required.
thank you

$BTC Daily UpdateCRYPTOCAP:BTC #BTC broke below $68,546 support down to $66,323 support which tested and held on last dip, $67,716 being tested as of now, RSI on 4H and 1D getting better, $68,546 support to be regained to reattempt at $71,379-$72,162 resistance area. Watch given s/r

BTC possible setups Weekly, 2024/6/9Tomorrow Monday 10th, I see a strong possibility of downward movement first, dropping to 67000 - 66000 area. Then, we need to observe whether there is possible for upward movement.
Possible long area:
1. 68400-68700
if it breaks down, then,
2.67000-66400
If 66000 breaks,
then t0 62000 area is possible.
Let's see how the week plays out.
