The Fed Eases Its Stress Tests,Giving WallStreet Some BreathThe Fed Eases Its Stress Tests, Giving Wall Street Some Breathing Room
By Ion Jauregui – Analyst at ActivTrades
The U.S. Federal Reserve (Fed) has announced a major reform to its banking stress tests — the resilience checks that, since the 2008 financial crisis, have served as the key barometer
Key facts today
Next report date
—
Report period
—
EPS estimate
—
Revenue estimate
—
17.25 EUR
56.15 B EUR
269.20 B EUR
2.74 B
About JP Morgan Chase & Co.
Sector
Industry
CEO
James Dimon
Website
Headquarters
New York
Founded
1799
ISIN
US46625H1005
FIGI
BBG000HT5P97
JPMorgan Chase & Co. is a financial holding company, which engages in the provision of financial and investment banking services. It focuses on investment banking, financial services for consumers and small businesses, commercial banking, financial transaction processing, and asset management. It operates through the following segments: Consumer and Community Banking (CCB), Commercial and Investment Bank (CIB), Asset and Wealth Management (AWM), and Corporate. The CCB segment originates and services mortgage loans. The CIB segment makes markets and services clients across fixed income, foreign exchange, equities, and commodities. The AWM segment provides initial capital investments in products such as mutual funds and capital invested alongside third-party investors. The Corporate segment manages its liquidity, funding, capital, structural interest rate, and foreign exchange risks. The company was founded in 1799 and is headquartered in New York, NY.
Related stocks

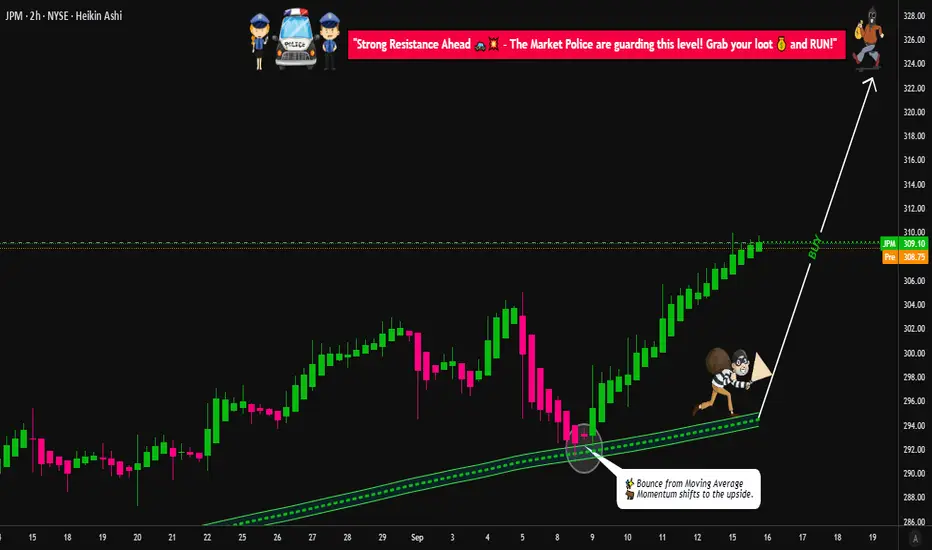
JPM - Potential move to ATH and beyond=======
Volume
=======
- neutral
==========
Price Action
==========
- Uptrend line intact
- Supported at $290 region
=================
Technical Indicators
=================
- Ichimoku
>>> price above cloud
>>> Green kumo contracting slightly
>>> Tenken - Above clouds
>>> Kijun - Above clouds

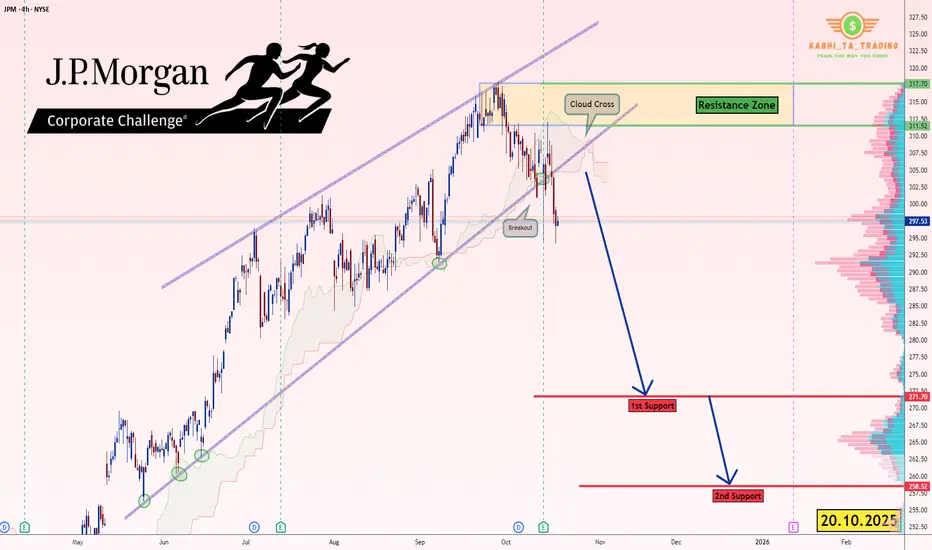
JP Morgan (JPM) - H4 - Breakout Pattern (20.10.2025)📊 Setup Overview:
J.P. Morgan ( NYSE:JPM ), presenting a bearish outlook based on the price action.
📈 Trade Plan:
Bias: Bearish below $310
1st Target: $272 ✅
2nd Target: $258.52 🎯
Resistance Zone: $311 – $318
🧩 Technical Confluence:
1.Price Breaks the Wedge Pattern.
2.Trendline break confirm
The #1 Reason For The Butter Knife Strategy.Its been a while since i used the fibnoccai
indicator.
Even as I place this indicator into action
I kept doubting my analysis.
But because I have been trading using the simulation
trading account for a long time.
I can still remember the trades that went well
and the ones that didn't.
Using t

JPMorgan Chase — rebound after earnings?After posting stronger-than-expected Q3 results ($5.07 EPS vs $4.37 YoY), NYSE:JPM is holding the lower boundary of its ascending channel near $303.
Technical setup:
Support: $300 – 303 (channel bottom + psychological level)
Target: $311 – 312 (+ ≈ 3%)
MACD is turning upward — early sign o

JPM is on the radarThe JP Morgan stock is testing the dynamic support area, moving inside of the 14-day swing from the peak of 29-th of September, 2025. The downside move may reverse off the support zone, as the swing is already mature, and according to statistical studies, directional moves rarely last for more than

JPM watch $310-315: Major Resistance at ATH could give a DIPJPM has been flying high amongst the big banks.
Just hit a major resistance zone $310.91-315.24
Looking for a DIP, perhaps to green zone below.
.
Previous Analysis that caught a PERFECT DIP buy:
Hit BOOST and FOLLOW for more such PRECISE and TIMELY charts.
=======================================

JPM Swing Plan → Layered Entries & Profit Targets Mapped😂 JPMorgan Chase (JPM) Swing/Day Trade: The Great Heist Blueprint 🤑💰
🚀 Asset: JPMorgan Chase & Co. ( NYSE:JPM )🎯 Market Profit Realization Plan: Swing/Day Trade📈 Outlook: Bullish vibes confirmed! 💪
📜 The Setup: Why JPM is Ready to Pop! 🎉
Bullish Confirmation: The chart is screaming BULLISH! 📈 A
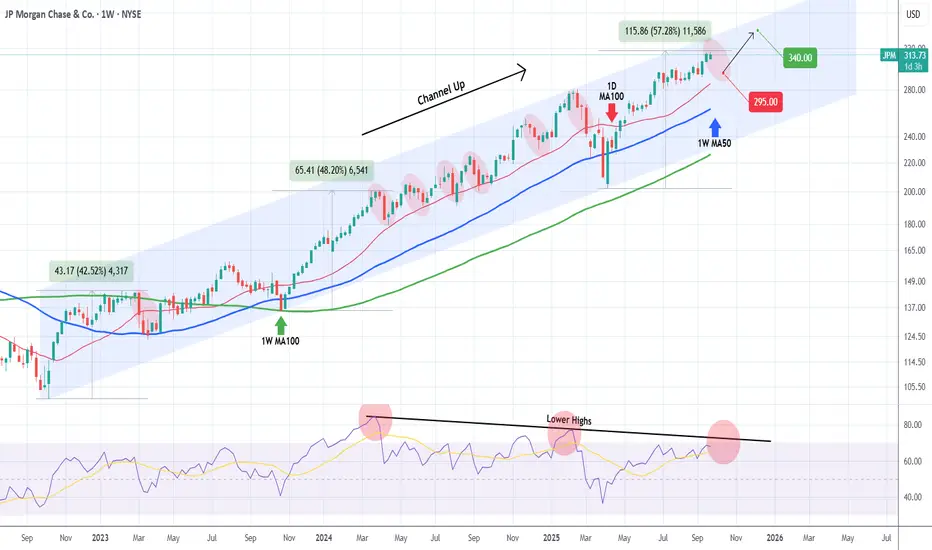
JP MORGAN In need of a relief correction.Last time we took a look at JP Morgan Chase (JPM) was 5 months ago (April 28, see chart below), issuing a strong long-term buy signal, which 2 weeks ago hit our $310 Target:
This time, having already completed a +57.28% rise from the April 07 bottom (Higher Low for the 3-year Channel Up), we ex
JPM + $500B Capital Forecast + Banks to Profit from Tar NYSE:JPM , 4H chart
ALVO13 Insight: A strong mix of technical structure and positive fundamentals.Technical Setup (Elliott Waves):
The chart suggests a potential start of wave (5) after a completed correction (4).
Stochastic is in the oversold zone, and $280 support is holding — a key signal for

See all ideas
Summarizing what the indicators are suggesting.
Neutral
SellBuy
Strong sellStrong buy
Strong sellSellNeutralBuyStrong buy
Neutral
SellBuy
Strong sellStrong buy
Strong sellSellNeutralBuyStrong buy
Neutral
SellBuy
Strong sellStrong buy
Strong sellSellNeutralBuyStrong buy
An aggregate view of professional's ratings.
Neutral
SellBuy
Strong sellStrong buy
Strong sellSellNeutralBuyStrong buy
Neutral
SellBuy
Strong sellStrong buy
Strong sellSellNeutralBuyStrong buy
Neutral
SellBuy
Strong sellStrong buy
Strong sellSellNeutralBuyStrong buy
Displays a symbol's price movements over previous years to identify recurring trends.
XS1879188552
JPMorgan Chase Bank, NA (New York Branch) 0.0% 16-DEC-2025Yield to maturity
239.65%
Maturity date
Dec 16, 2025
XS1569768143
JPMorgan Chase Bank, NA (New York Branch) 0.0% 20-APR-2026Yield to maturity
209.78%
Maturity date
Apr 20, 2026
XS1569765396
JPMorgan Chase Bank, NA (New York Branch) 0.0% 19-OCT-2026Yield to maturity
205.37%
Maturity date
Oct 19, 2026
XS1879176623
JPMorgan Chase Bank, National Association (417) 0.0% 25-AUG-2026Yield to maturity
199.60%
Maturity date
Aug 25, 2026
XS1879190533
JPMorgan Chase Bank, NA (New York Branch) 0.0% 29-APR-2026Yield to maturity
198.88%
Maturity date
Apr 29, 2026
XS1879172044
JPMorgan Chase Bank NA 0.0% 14-SEP-2026Yield to maturity
180.39%
Maturity date
Sep 14, 2026
XS1879170006
JPMorgan Chase Bank NA 0.0% 12-OCT-2026Yield to maturity
170.92%
Maturity date
Oct 12, 2026
XS1569755322
JPMorgan Chase Bank, NA (New York Branch) 0.0% 02-NOV-2026Yield to maturity
147.52%
Maturity date
Nov 2, 2026
JPM5515395
JPMorgan Chase Financial Co. LLC 0.0% 20-DEC-2027Yield to maturity
145.58%
Maturity date
Dec 20, 2027
XS1569761999
JPMorgan Chase Bank, NA (New York Branch) 0.0% 28-MAR-2028Yield to maturity
117.89%
Maturity date
Mar 28, 2028
XS1569760082
JPMorgan Chase Bank, NA (New York Branch) 0.0% 18-APR-2028Yield to maturity
105.28%
Maturity date
Apr 18, 2028
See all CMC bonds
Curated watchlists where CMC is featured.


Frequently Asked Questions
The current price of CMC is 268.80 EUR — it has increased by 0.13% in the past 24 hours. Watch JPMorgan Chase & Co. stock price performance more closely on the chart.
Depending on the exchange, the stock ticker may vary. For instance, on XETR exchange JPMorgan Chase & Co. stocks are traded under the ticker CMC.
CMC stock has risen by 6.25% compared to the previous week, the month change is a 0.96% rise, over the last year JPMorgan Chase & Co. has showed a 30.17% increase.
We've gathered analysts' opinions on JPMorgan Chase & Co. future price: according to them, CMC price has a max estimate of 320.70 EUR and a min estimate of 216.69 EUR. Watch CMC chart and read a more detailed JPMorgan Chase & Co. stock forecast: see what analysts think of JPMorgan Chase & Co. and suggest that you do with its stocks.
CMC stock is 2.19% volatile and has beta coefficient of 1.32. Track JPMorgan Chase & Co. stock price on the chart and check out the list of the most volatile stocks — is JPMorgan Chase & Co. there?
Today JPMorgan Chase & Co. has the market capitalization of 741.52 B, it has decreased by −2.48% over the last week.
Yes, you can track JPMorgan Chase & Co. financials in yearly and quarterly reports right on TradingView.
JPMorgan Chase & Co. is going to release the next earnings report on Jan 13, 2026. Keep track of upcoming events with our Earnings Calendar.
CMC earnings for the last quarter are 4.32 EUR per share, whereas the estimation was 4.13 EUR resulting in a 4.63% surprise. The estimated earnings for the next quarter are 4.28 EUR per share. See more details about JPMorgan Chase & Co. earnings.
JPMorgan Chase & Co. revenue for the last quarter amounts to 39.56 B EUR, despite the estimated figure of 38.75 B EUR. In the next quarter, revenue is expected to reach 39.77 B EUR.
CMC net income for the last quarter is 12.21 B EUR, while the quarter before that showed 12.66 B EUR of net income which accounts for −3.56% change. Track more JPMorgan Chase & Co. financial stats to get the full picture.
Yes, CMC dividends are paid quarterly. The last dividend per share was 1.28 EUR. As of today, Dividend Yield (TTM)% is 1.78%. Tracking JPMorgan Chase & Co. dividends might help you take more informed decisions.
JPMorgan Chase & Co. dividend yield was 2.00% in 2024, and payout ratio reached 24.30%. The year before the numbers were 2.41% and 25.27% correspondingly. See high-dividend stocks and find more opportunities for your portfolio.
As of Nov 3, 2025, the company has 317.23 K employees. See our rating of the largest employees — is JPMorgan Chase & Co. on this list?
Like other stocks, CMC shares are traded on stock exchanges, e.g. Nasdaq, Nyse, Euronext, and the easiest way to buy them is through an online stock broker. To do this, you need to open an account and follow a broker's procedures, then start trading. You can trade JPMorgan Chase & Co. stock right from TradingView charts — choose your broker and connect to your account.
Investing in stocks requires a comprehensive research: you should carefully study all the available data, e.g. company's financials, related news, and its technical analysis. So JPMorgan Chase & Co. technincal analysis shows the strong buy rating today, and its 1 week rating is strong buy. Since market conditions are prone to changes, it's worth looking a bit further into the future — according to the 1 month rating JPMorgan Chase & Co. stock shows the buy signal. See more of JPMorgan Chase & Co. technicals for a more comprehensive analysis.
If you're still not sure, try looking for inspiration in our curated watchlists.
If you're still not sure, try looking for inspiration in our curated watchlists.