E3X1 trade ideas


EXPE on pent up demandGood consolidation spot for a re-entry on good data for travel. Airbnb more expensive so we'll go on the VRBO revenue that can push Expedia up.

Clear short opportunity..!You can wait for a better entry in a possible pullback! But it may not happen..!


EXPE on pent up demandSimilar to our play on WYNN this EXPE long is on the notion that people are chomping at the bit to get out and travel.
It's better a better play than that airlines as these booking systems use technology and cover more than just air travel.
MACD looks splendid!
R isn't the best on this initial set-up but we will set an alert and move it higher if it starts going our way.
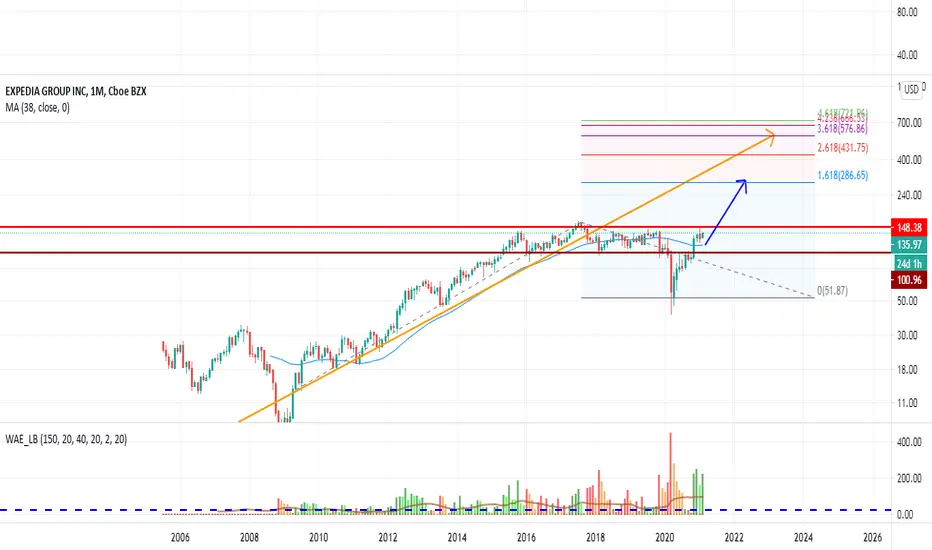
Definitely a long term weekly chart play here.

Interesting Volume ShelfExpedia will explode when travel demand picks up as vaccine distribution continues. It is currently sitting on an attractive entry point.
Volume has decreased in the past few days, indication the sell off from the last few days might be at an end.
EXPE , Short Reasons for short :
-I believe EXPE will underpreform it's peers ( BKNG and TCOM ) . I have compared the three and EXPE has the worst fundamental metrics ( BKNG and TCOM look good ) .
-Forward P/E of 228.7
-Price to book is 12.18, high
-Although with a quick ratio of 1.20, they have cash to meet short term debt payments , EXPE Debt over equity at 5.41 is still bad , especially compared to industry peers. For example, to give you a comparison TCOM D/E is 0.67 and BKNG D/E is 2.4
-EXPE also has the worst margins of the three (BKNG is the winner there)
-High short float at 11%.
I think a good way to trade this, while reducing market exposure, is to short EXPE and long TCOM with equal position sizing per side . BKNG is good too but needs to come down some before I personally would enter , whereas TCOM and EXPE are near entry points .
Good luck ~


$EXPE - golden cross and has not yet runWatching it because I have a brain and I do not think its time for EXPE yet, but the chart disagrees... or does it?
IRON TARIHi guys!
New Iron condor, check my last trades, and get my script for free!
Enjoy your wallet!
Tari.

SUNDAY WATCHLIST 12/6/2020Perfect swing trade set up here! Ascending triangle on daily with some gap above it that still needs filled! Huge Resistance point near 140 which is where I am setting my PT. Will look to take a position at any dip inside of this pattern.

EXPE Bull Flag/Wedge I really like this EXPE long above 130.05 because it has been tightening up and is forming a wedge formation breaking out through the bull flag. Do I think this trade will reach the 5:1 quick? No, but I can see this slowly grind to the 5:1 and cross through ATH at 161.


EXPE - 1DAll time frames look good (1D, 4HR, 1 week, 1M)
Extremely bullish on this will add a position

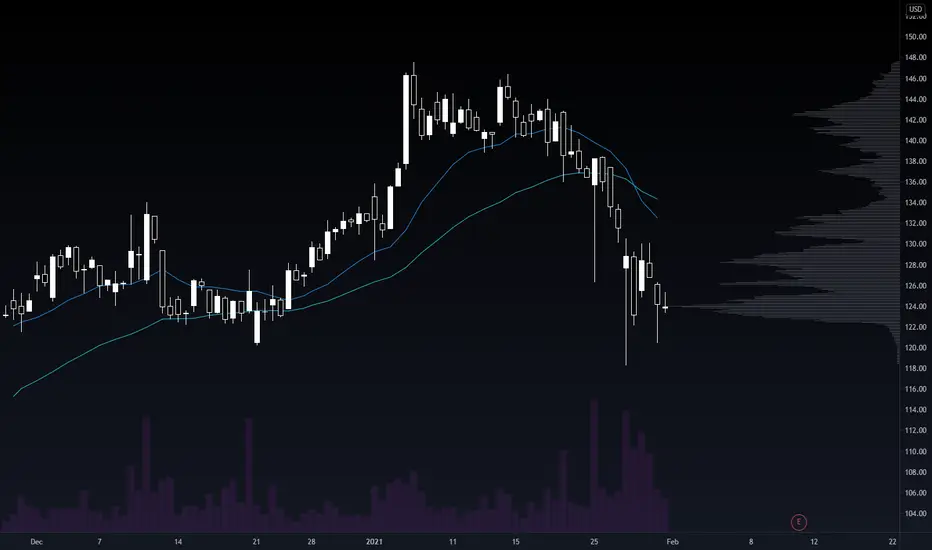
$EXPE with a bearish outlook after a negative earning release$EXPE posted worse than expected earnings with the PEAD projecting a bearish outlook for the stock, Currently price is trading between the lower boundary of the PEAD cone and the median line.
If you would like to see the Drift for another stock please message us. Also click on the Like Button if this was useful and follow us or join us.

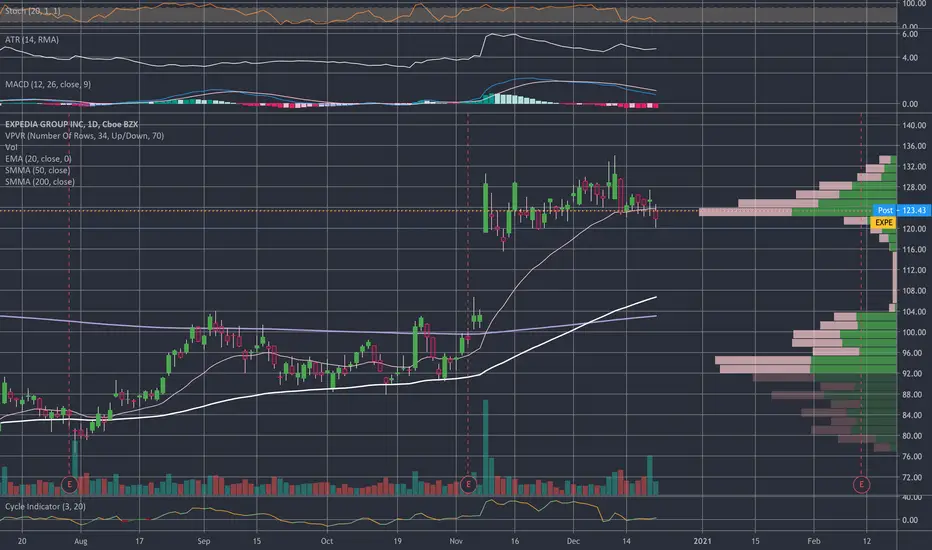
EXPE, price moved above its 50-day Moving Average on Oct 22, 20This price move could indicate a change in the trend, and may be a buy signal for investors. Tickeron A.I.dvisor found 41 similar cases, and 31 were successful. Based on this data, the odds of success are 76%. Current price $102.80 crossed the support line at $100.65 and is trading between $106.65 resistance and $100.65 support lines. Throughout the month of 09/22/20 - 10/22/20, the price experienced a +8% Uptrend. During the week of 10/15/20 - 10/22/20, the stock enjoyed a +12% Uptrend growth.
Bullish Trend Analysis
The Stochastic Indicator suggests the stock price trend may be in a reversal from a downward trend to an upward trend. 41 of 56 cases where EXPE's Stochastic Oscillator exited the oversold zone resulted in an increase in price. Tickeron's analysis proposes that the odds of a continued upward trend are 73%.
The Momentum Indicator moved above the 0 level on October 22, 2020. You may want to consider a long position or call options on EXPE as a result. Tickeron A.I. detected that in 61 of 90 past instances where the momentum indicator moved above 0, the stock continued to climb. The odds of a continued upward trend are 68%.
The Moving Average Convergence Divergence (MACD) for EXPE just turned positive on October 22, 2020. Looking at past instances where EXPE's MACD turned positive, the stock continued to rise in 30 of 42 cases over the following month. The odds of a continued upward trend are 71%.
The 50-day Moving Average for EXPE moved above the 200-day moving average on September 08, 2020. This could be a long-term bullish signal for the stock as the stock shifts to an upward trend.
Following a +2.48% 3-day Advance, the price is estimated to grow further. Considering data from situations where EXPE advanced for three days, in 245 of 339 cases, the price rose further within the following month. The odds of a continued upward trend are 72%.

Travel amid lockdowns and long-term recovery I'll be looking for a long term buy from December. Currently we have a precarious situation.

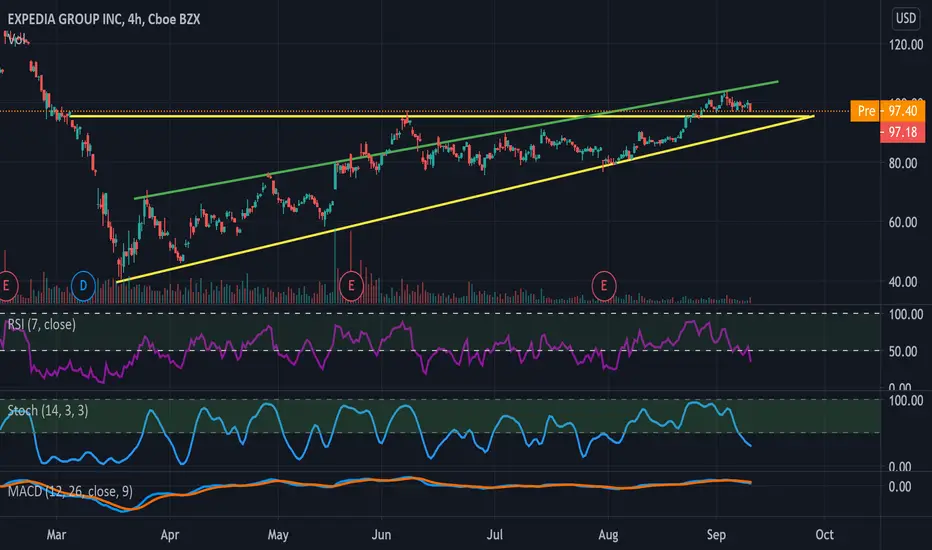
EXPE - 7.75% Potential Profit - Ascending TriangleWe traded EXPE a couple of weeks ago , and we made a decent 4% return.
Ascending Triangle broken out after a 3-month correction following a great bull run. Multiple support confirmation on the 5-min chart. Support manage to hold up quite well even during the recent meltdown. Indicators are obviously not on our side, since we are playing the bounce.
- 6-month Uptrend
- RSI + Stoch below 50 (!)
- MACD below Signal (!)
Target Entry $97.50
Target Stop Loss $96.95
Target Exit $104.98
About me
- August P/L: +203.83% | Wins 85.19% | No Trades without Analysis
- Note that I tend to adjust stop losses in order to secure profits early and preserve capital. This means that the target price is going to be achieved as long as there are no strong pullbacks that trigger my new adjusted stop loss.
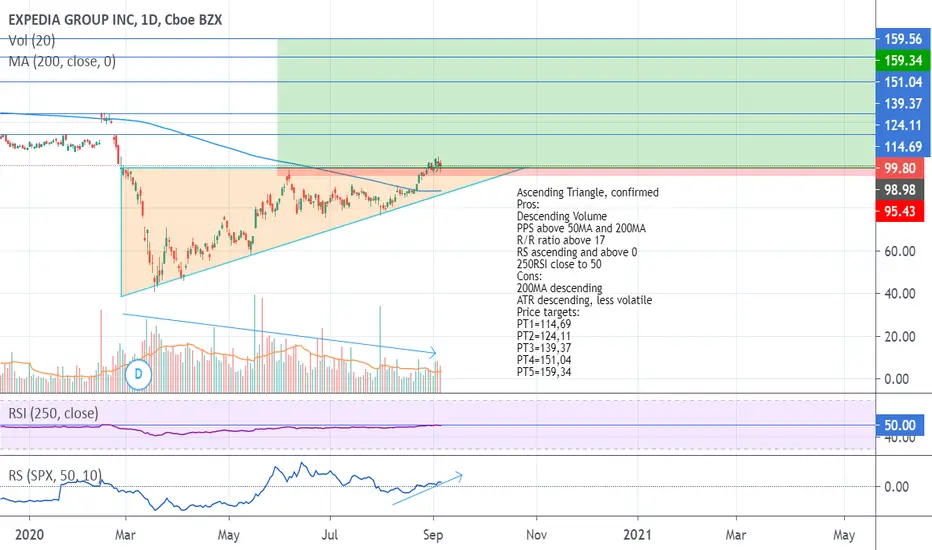
EXPE: Ascending TriangleAscending Triangle, confirmed
Pros:
Descending Volume
PPS above 50MA and 200MA
R/R ratio above 17
RS ascending and above 0
250RSI close to 50
Cons:
200MA descending
ATR descending, less volatile
Price targets:
PT1=114,69
PT2=124,11
PT3=139,37
PT4=151,04
PT5=159,34