$MSFT Call Alert – Oct 31 ’25 $515 Calls | 125% ROI PotentialEnter: NASDAQ:MSFT OCT 31 2025 $515 CALLS
Buy in Price: $16.89 - $17.00
Take Profit: $38.00
Stop Bleeding: $14.86
ROI Potential: 125%
Exit Within: 160 Minutes
Key facts today
Next report date
—
Report period
—
EPS estimate
—
Revenue estimate
—
13.70 USD
101.83 B USD
281.72 B USD
7.32 B
About Microsoft Corp.
Sector
Industry
CEO
Satya Nadella
Website
Headquarters
Redmond
Founded
1975
ISIN
US5949181045
FIGI
BBG000BPH459
Microsoft Corp engages in the development and support of software, services, devices, and solutions. It operates through the following business segments: Productivity and Business Processes; Intelligent Cloud; and More Personal Computing. The Productivity and Business Processes segment comprises products and services in the portfolio of productivity, communication, and information services of the company spanning a variety of devices and platform. The Intelligent Cloud segment refers to the public, private, and hybrid serve products and cloud services of the company which can power modern business. The More Personal Computing segment encompasses products and services geared towards the interests of end users, developers, and IT professionals across all devices. The firm also offers operating systems; cross-device productivity applications; server applications; business solution applications; desktop and server management tools; software development tools; video games; personal computers, tablets; gaming and entertainment consoles; other intelligent devices; and related accessories. The company was founded by Paul Gardner Allen and William Henry Gates III in 1975 and is headquartered in Redmond, WA.
Related stocks
Microsoft (MSFT) — The Titan at a Tipping Point! Can Bulls Defend $510 or Will Bears Take Over?
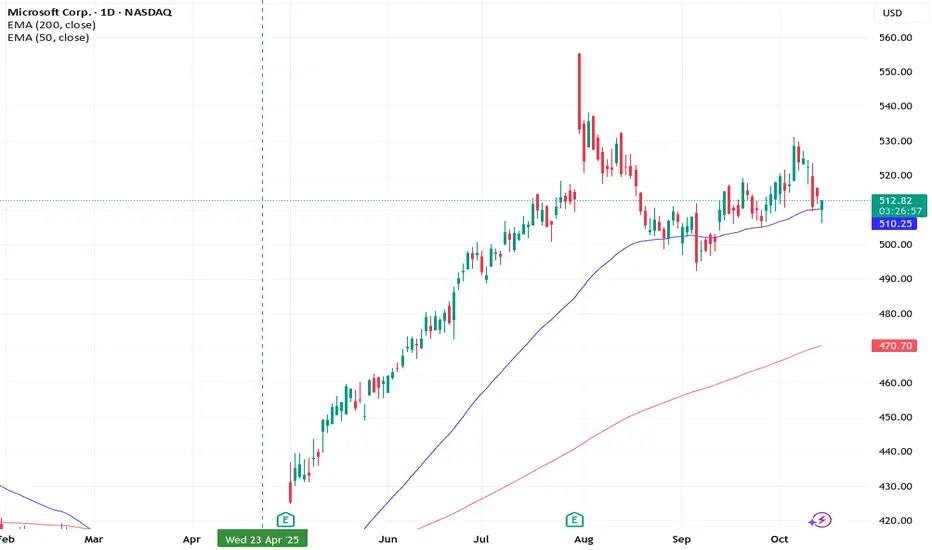
🧭 Weekly Chart — Macro Structure & Trend Direction
MSFT’s weekly structure shows a clean bullish trend since its March 2024 low, but now, that momentum is showing cracks. The chart reveals a CHoCH (Change of Character) just below the previous BOS (Brea

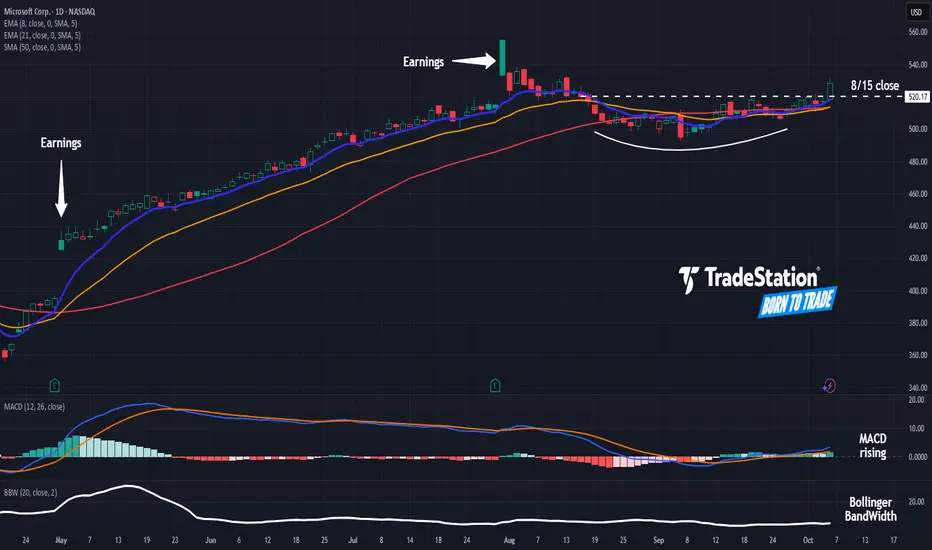
Microsoft May Be Moving AgainMicrosoft has been snoozing since the summer, but some traders may think the tech giant is ready to start moving again.
The first pattern on today’s chart is the pair of bullish gaps following quarterly results, which may reflect positive sentiment.
Second is the August 15 weekly close of $520.17.
MSFT Daily: Eyes on 555 - Will 515-520 Support Hold?MSFT Daily: Eyes on 555 - Will 515-520 Support Hold?
Microsoft (MSFT) has established a solid bullish recovery from the "Key Support 500" level and is currently consolidating above the flipped "Current Support 515 to 520" zone.
The immediate bullish objective is a push towards "Initial Resist

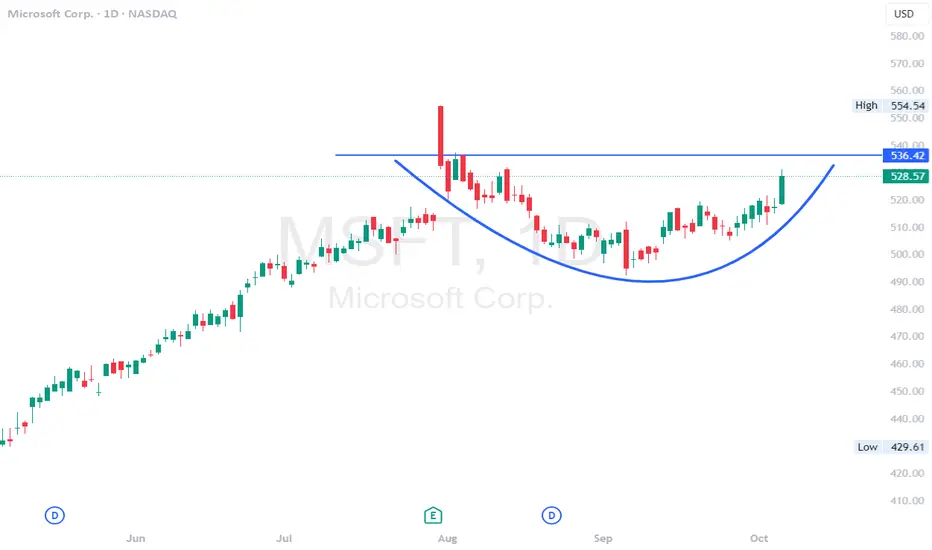
MSFT - Cup style reversal here. upside move incomingMSFT - Stock making a cup style reversal on the daily time frame after post earnings pull back. Looking for calls above $530 for a move towards $536 and $550. 2 months out calls coming in here. looking strong for a move to the upside.
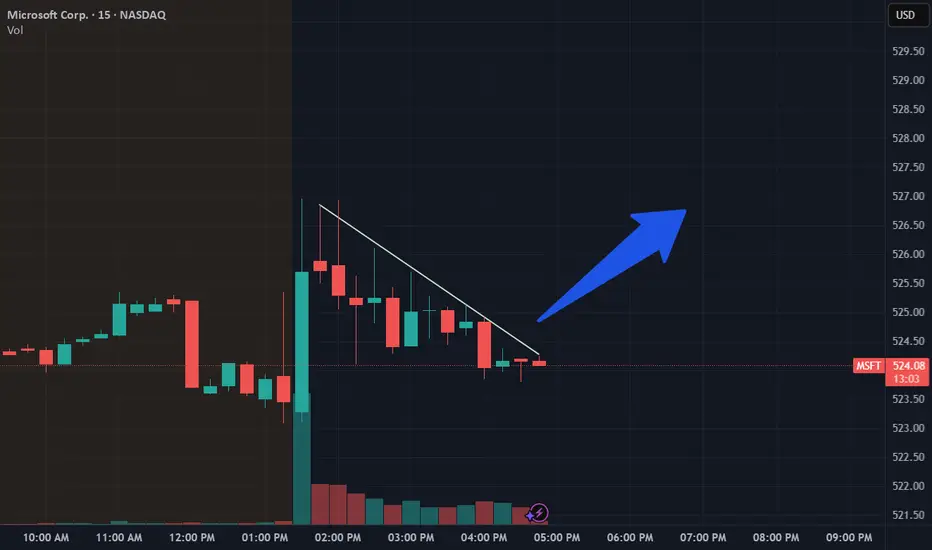
Possible break of Upper TrendlinePrice looks like it is set to break this trendline. If it breaks, watch for a retest and buy in after confirmation.
*Not financial advice, or whatever.
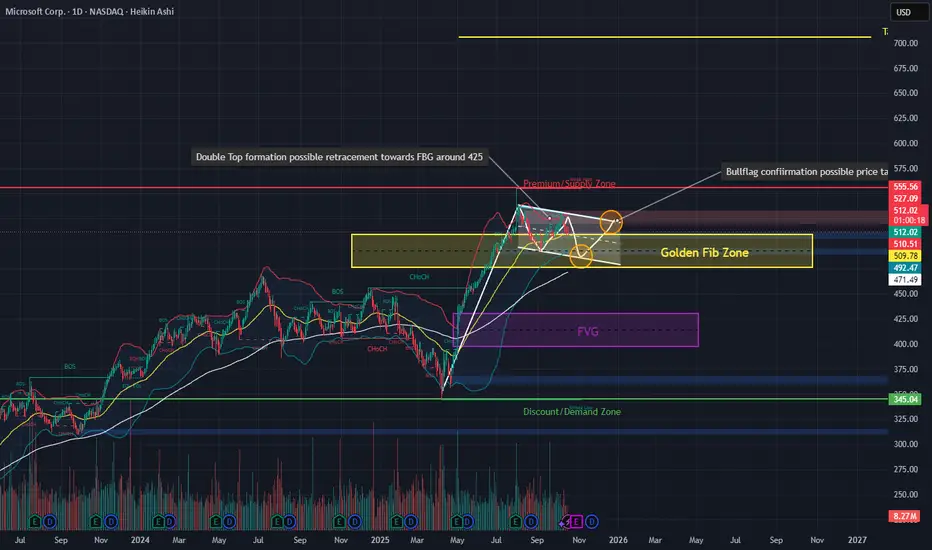
MSFT: Double Top or Bull Flag – The Next Big AI Move LoadingOverview:
Current structure shows confluence between a double-top formation near recent highs and a potential bull flag retracement setup. Price is consolidating around the $505–$510 zone, which overlaps with the 50 EMA and a mid-range supply area.
Pattern Outlook
Double-Top Possibility:
Price has
The #1 Stock:Microsoft (MSFT) – Rocket Booster Bullish Reversal Overview:
Microsoft is showing a monthly Rate of Change (ROC) above 0%, while the weekly ROC is below 0%, suggesting a potential reversal zone. This setup combines trend indicators with candlestick confirmation for a high-probability entry, part of what we call the Rocket Booster Strategy.
Rocket
Emerging Markets and Capital Flows1. Introduction
In the globalized economy of the 21st century, emerging markets have become a critical component of international trade, investment, and finance. These nations—often transitioning from developing to developed status—play a vital role in global growth, driven by demographic advantage
MSFT: The “Top Pick” Trap? Or Real Breakout Fuel?Microsoft is testing a critical support zone — and with Morgan Stanley just naming it a top pick in tech, buyers may be gearing up for control. 📈
Quantitative stats back the setup: Sortino Ratio of 0.42 and 90% win rate on this pattern.
👉 What’s your call — breakout to new highs… or one more dip b

See all ideas
Summarizing what the indicators are suggesting.
Neutral
SellBuy
Strong sellStrong buy
Strong sellSellNeutralBuyStrong buy
Neutral
SellBuy
Strong sellStrong buy
Strong sellSellNeutralBuyStrong buy
Neutral
SellBuy
Strong sellStrong buy
Strong sellSellNeutralBuyStrong buy
An aggregate view of professional's ratings.
Neutral
SellBuy
Strong sellStrong buy
Strong sellSellNeutralBuyStrong buy
Neutral
SellBuy
Strong sellStrong buy
Strong sellSellNeutralBuyStrong buy
Neutral
SellBuy
Strong sellStrong buy
Strong sellSellNeutralBuyStrong buy
Displays a symbol's price movements over previous years to identify recurring trends.
ATVI4499883
Activision Blizzard, Inc. 4.5% 15-JUN-2047Yield to maturity
6.87%
Maturity date
Jun 15, 2047
ATVI5026499
Activision Blizzard, Inc. 2.5% 15-SEP-2050Yield to maturity
6.15%
Maturity date
Sep 15, 2050
See all MSFT bonds
Curated watchlists where MSFT is featured.


Frequently Asked Questions
The current price of MSFT is 513.58 USD — it has increased by 0.39% in the past 24 hours. Watch Microsoft Corp. stock price performance more closely on the chart.
Depending on the exchange, the stock ticker may vary. For instance, on NASDAQ exchange Microsoft Corp. stocks are traded under the ticker MSFT.
MSFT stock has fallen by −1.17% compared to the previous week, the month change is a 0.58% rise, over the last year Microsoft Corp. has showed a 21.60% increase.
We've gathered analysts' opinions on Microsoft Corp. future price: according to them, MSFT price has a max estimate of 710.00 USD and a min estimate of 520.00 USD. Watch MSFT chart and read a more detailed Microsoft Corp. stock forecast: see what analysts think of Microsoft Corp. and suggest that you do with its stocks.
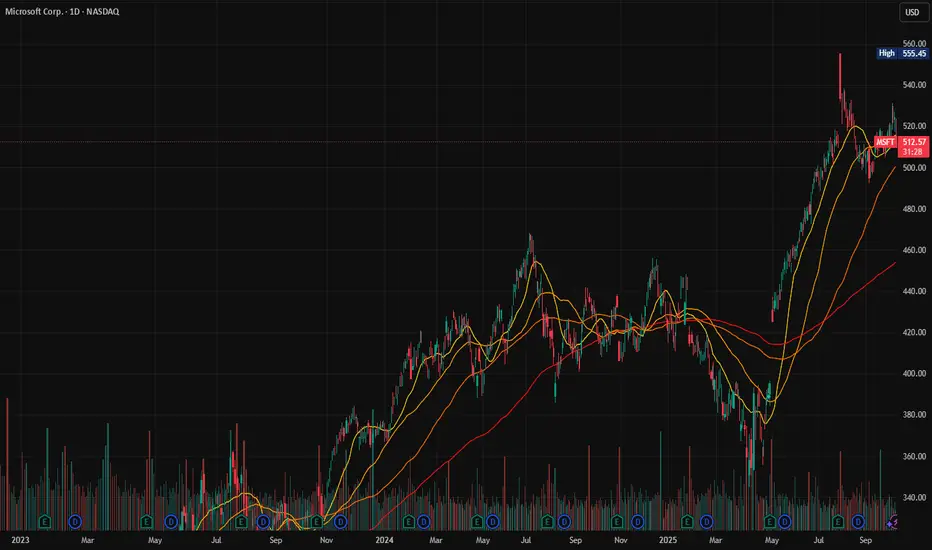
MSFT reached its all-time high on Jul 31, 2025 with the price of 555.45 USD, and its all-time low was 0.09 USD and was reached on Mar 13, 1986. View more price dynamics on MSFT chart.
See other stocks reaching their highest and lowest prices.
See other stocks reaching their highest and lowest prices.
MSFT stock is 1.61% volatile and has beta coefficient of 0.88. Track Microsoft Corp. stock price on the chart and check out the list of the most volatile stocks — is Microsoft Corp. there?
Today Microsoft Corp. has the market capitalization of 3.82 T, it has increased by 0.82% over the last week.
Yes, you can track Microsoft Corp. financials in yearly and quarterly reports right on TradingView.
Microsoft Corp. is going to release the next earnings report on Oct 29, 2025. Keep track of upcoming events with our Earnings Calendar.
MSFT earnings for the last quarter are 3.65 USD per share, whereas the estimation was 3.37 USD resulting in a 8.16% surprise. The estimated earnings for the next quarter are 3.66 USD per share. See more details about Microsoft Corp. earnings.
Microsoft Corp. revenue for the last quarter amounts to 76.44 B USD, despite the estimated figure of 73.93 B USD. In the next quarter, revenue is expected to reach 75.33 B USD.
MSFT net income for the last quarter is 27.23 B USD, while the quarter before that showed 25.82 B USD of net income which accounts for 5.46% change. Track more Microsoft Corp. financial stats to get the full picture.
Yes, MSFT dividends are paid quarterly. The last dividend per share was 0.83 USD. As of today, Dividend Yield (TTM)% is 0.65%. Tracking Microsoft Corp. dividends might help you take more informed decisions.
Microsoft Corp. dividend yield was 0.67% in 2025, and payout ratio reached 24.34%. The year before the numbers were 0.67% and 25.42% correspondingly. See high-dividend stocks and find more opportunities for your portfolio.
As of Oct 19, 2025, the company has 228 K employees. See our rating of the largest employees — is Microsoft Corp. on this list?
EBITDA measures a company's operating performance, its growth signifies an improvement in the efficiency of a company. Microsoft Corp. EBITDA is 162.68 B USD, and current EBITDA margin is 57.74%. See more stats in Microsoft Corp. financial statements.
Like other stocks, MSFT shares are traded on stock exchanges, e.g. Nasdaq, Nyse, Euronext, and the easiest way to buy them is through an online stock broker. To do this, you need to open an account and follow a broker's procedures, then start trading. You can trade Microsoft Corp. stock right from TradingView charts — choose your broker and connect to your account.
Investing in stocks requires a comprehensive research: you should carefully study all the available data, e.g. company's financials, related news, and its technical analysis. So Microsoft Corp. technincal analysis shows the neutral today, and its 1 week rating is buy. Since market conditions are prone to changes, it's worth looking a bit further into the future — according to the 1 month rating Microsoft Corp. stock shows the buy signal. See more of Microsoft Corp. technicals for a more comprehensive analysis.
If you're still not sure, try looking for inspiration in our curated watchlists.
If you're still not sure, try looking for inspiration in our curated watchlists.