BITCOIN The hidden Channel & the I. Head and Shoulders to $11000
I have analyzed extensively the reasons why I believe the bottom to the current (started in June) correction is most likely priced (you can find these studies at the bottom of this analysis).
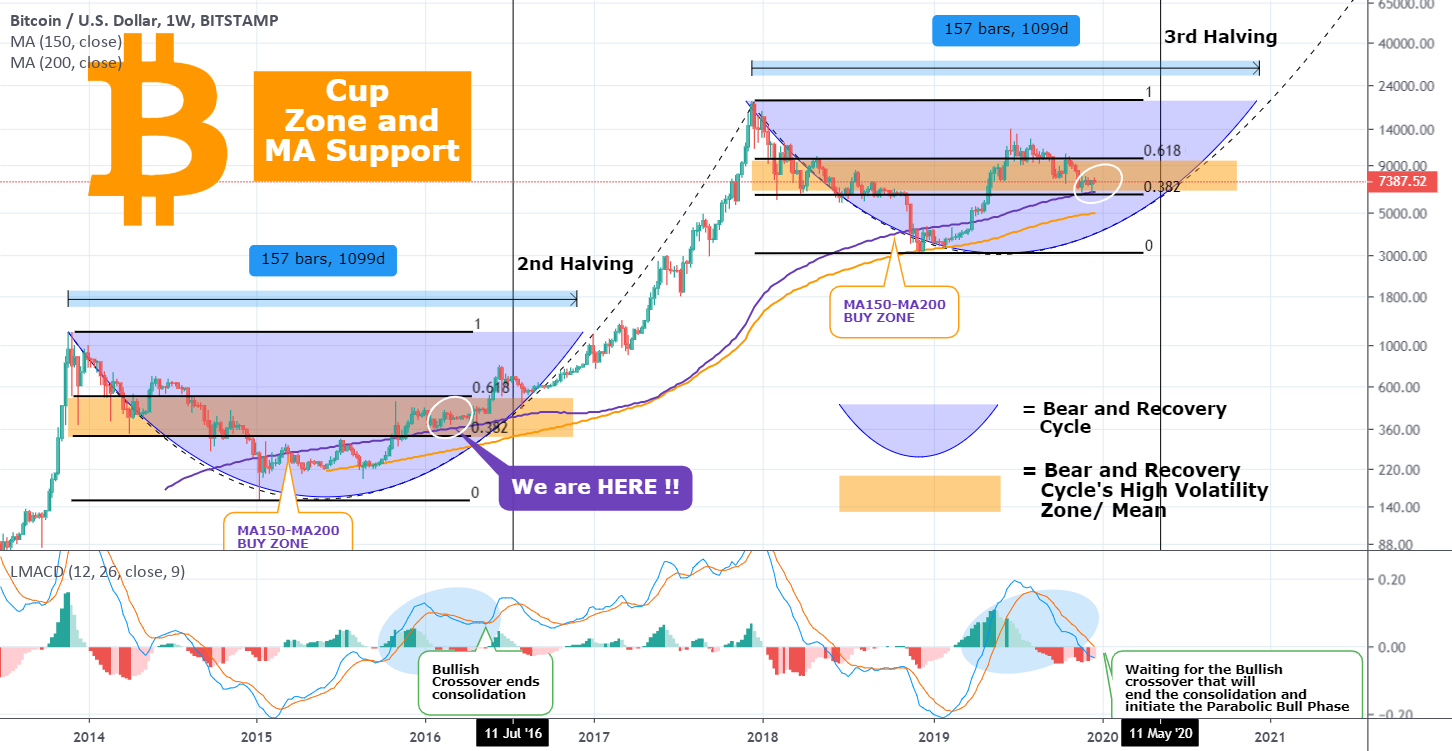
What I want to bring forward to your attention today is a "Hidden Channel" that explains much of Bitcoin's behavior in recent months, as well as an emerging Inverse Head and Shoulders pattern which can be used as a guide for the coming months prior to the May (3rd) Halving.
** The Hidden Channel **
This is the Fibonacci starting from the December 3k bottom and peaking on June's almost 14k top. Drawing the Fibonacci retracements on this Channel we can easily see why most bounces (rejections on Resistance levels and rebounds on Supports) took place. A good example is the correction after June. See how the 0.382 Fib retracement level contained the first bearish legs of the downtrend, making the price bounce 3 times (mid July - August). Same happened with the 0.618 level and very recently with the December low on the 0.786 Fib. A retracement to the 1.000 Fib is around $5500 currently but that is consider this highly unlikely first because of reasons explained on previous studies why I think 6.5k was the bottom (see the end of this analysis for examples) but also because we would have made a full Fib retracement on the Channel which is itself a very rare feat and may indicate a change on Bitcoin's long term direction.
** The emerging Inverse Head and Shoulders **
So assuming (with the strong evidence I've brought forward in recent studies) that the bottom has been made on the 0.786 Fibonacci, what happens next? Well the way I see it, a clear Inverse Head and Shoulders pattern is emerging (which is typically a change of direction pattern) with the $6500 bottom as the Head and roughly $7300 the top of the Shoulders (inversed of course). The orange Zone shown on the chart is the core and bottom of the neckline. As you see the 1D MA200 (orange line) plays a big part in shaping this level and currently acts as a Resistance.
Based on the above, I expect Bitcoin (BTCUSD) to retrace now back to roughly 7300 and price the top (inversed) of the Right Shoulder. Assuming the pattern is to a good degree symmetrical, I then expect a peak (before the May Halving) within $11000 - 11500. The Halving will then take effect and after an initial consolidation I expect the 20k ATH (All Time High) to be tested before the end of the year.
But what do you think? Is this Fibonacci Channel enough to explain to you some of its recent movements? Do you also see an Inverse Head and Shoulders emerging? Let me know in the comments section!
Please like, subscribe and share your ideas and charts with the community!
* * * Material showing why the Bottom is most likely priced:


👑Best Signals (Forex/Crypto+70% accuracy) & Account Management (+20% profit/month on 10k accounts)
💰Free Channel t.me/tradingshotglobal
🤵Contact info@tradingshot.com t.me/tradingshot
🔥New service: next X100 crypto GEMS!
💰Free Channel t.me/tradingshotglobal
🤵Contact info@tradingshot.com t.me/tradingshot
🔥New service: next X100 crypto GEMS!