BITCOIN Entering the final volatility phase. Is $20000 next?
We've discussed Bitcoin's short term symmetrical movement and how the new bottom is (most likely) in enough (see these recent studies at the bottom of this analysis).
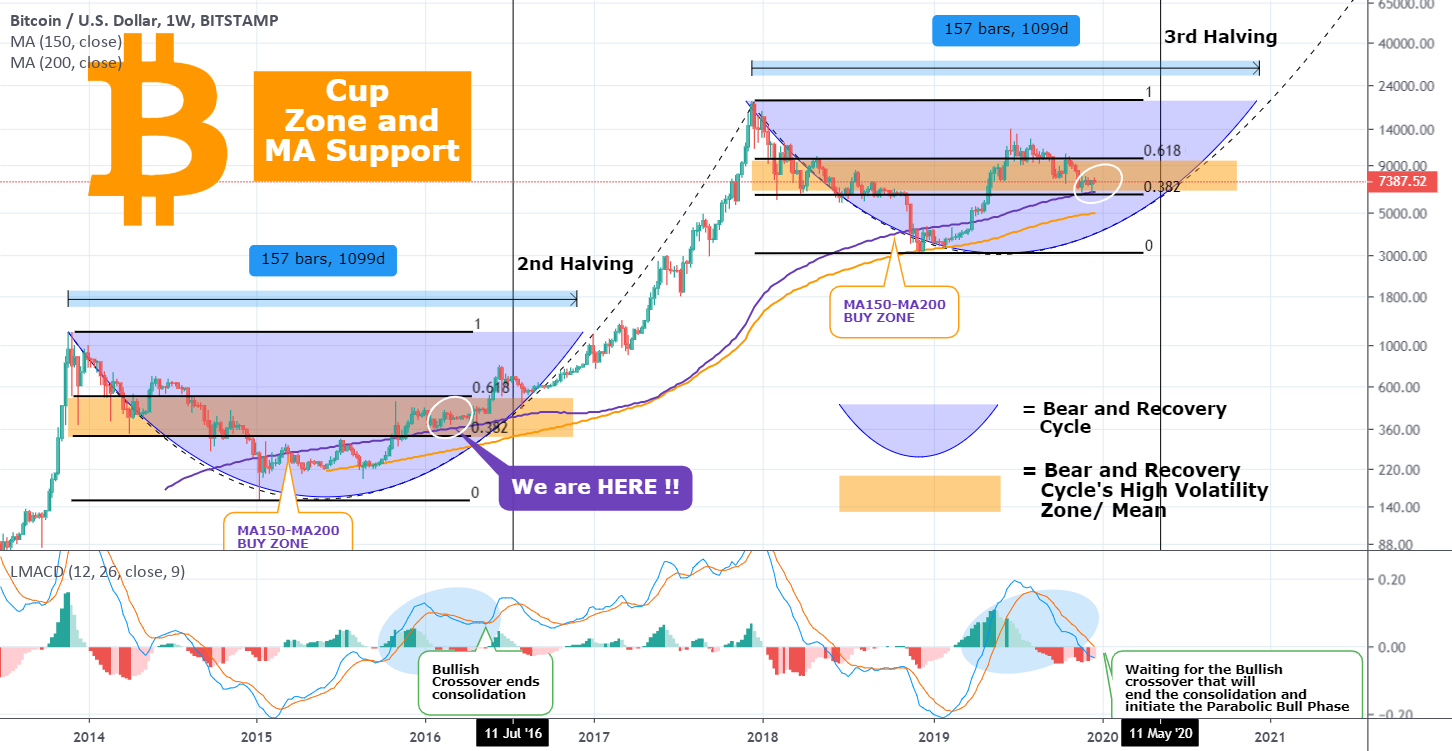
What I want to focus on this time is what my two most useful indicators show (RSI and LMACD) on the 1W chart with regards to which phase we are at now and what that shows for the (not so distant) future price action.
** The RSI **
The Relative Strength Index currently shows that Bitcoin, after making a Higher Low and symmetrical to the Dec 2018 Bottom, is gathering up bullish momentum to get back in the Volatility Zone. The Lower Low trend line (dashed line) should keep the value restrained within the Volatility Zone for at least until July 2020. Then I expect a bullish break-out which based on Bitcoin's previous Bull Cycle (2015 - 2017) should be the call for the start of the super aggressive part of the Parabolic Bull Run.
** The LMACD **
Similarly, the LMACD appears to have reached the symmetrical support line (dashed) from October 2015, and is making a bullish crossover on the Higher Low trend line (black bold). As with the RSI, this roll over should take the indicator back within its Volatility Zone but contained below the Lower High Resistance (dashed line). This should keep Bitcoin on a smooth, low-paced uptrend up until July 2020, after which (again) should initiate the super aggressive part of the Parabolic Bull Run.
Notice that on both indicators there is a descending trendline (bold blue) that connects the December 2013 Market Top with the December 2017 Market Top. Those were the All Time Highs at the time (2017 still is) for Bitcoin and the fact that is descending denotes the smooth long term trend regarding its volatility, but this is something I want to analyze in great detail on one of my following studies. However it can be assumed that the next time the indicators make contact with those lines, we may have/ or be close to the new All Time market High.
Under the above conditions, I have come up with a rough estimate that we will test $20000 (roughly the ATH) towards the end of 2020. Do you think this is realistic under these parameters or you have a different view and price projection? Let me know in the comments section!
Please like, subscribe and share your ideas and charts with the community!
With all eyes on the upcoming Halving in May, I have compiled several studies where I show that the bottom is most likely in. Take a look and tell me your view on that:

* * BONUS MATERIAL * *
Similar study showing $20000 by the end of the year:
Recent analysis on the current short term symmetrical price action:
What I want to focus on this time is what my two most useful indicators show (RSI and LMACD) on the 1W chart with regards to which phase we are at now and what that shows for the (not so distant) future price action.
** The RSI **
The Relative Strength Index currently shows that Bitcoin, after making a Higher Low and symmetrical to the Dec 2018 Bottom, is gathering up bullish momentum to get back in the Volatility Zone. The Lower Low trend line (dashed line) should keep the value restrained within the Volatility Zone for at least until July 2020. Then I expect a bullish break-out which based on Bitcoin's previous Bull Cycle (2015 - 2017) should be the call for the start of the super aggressive part of the Parabolic Bull Run.
** The LMACD **
Similarly, the LMACD appears to have reached the symmetrical support line (dashed) from October 2015, and is making a bullish crossover on the Higher Low trend line (black bold). As with the RSI, this roll over should take the indicator back within its Volatility Zone but contained below the Lower High Resistance (dashed line). This should keep Bitcoin on a smooth, low-paced uptrend up until July 2020, after which (again) should initiate the super aggressive part of the Parabolic Bull Run.
Notice that on both indicators there is a descending trendline (bold blue) that connects the December 2013 Market Top with the December 2017 Market Top. Those were the All Time Highs at the time (2017 still is) for Bitcoin and the fact that is descending denotes the smooth long term trend regarding its volatility, but this is something I want to analyze in great detail on one of my following studies. However it can be assumed that the next time the indicators make contact with those lines, we may have/ or be close to the new All Time market High.
Under the above conditions, I have come up with a rough estimate that we will test $20000 (roughly the ATH) towards the end of 2020. Do you think this is realistic under these parameters or you have a different view and price projection? Let me know in the comments section!
Please like, subscribe and share your ideas and charts with the community!
With all eyes on the upcoming Halving in May, I have compiled several studies where I show that the bottom is most likely in. Take a look and tell me your view on that:


* * BONUS MATERIAL * *
Similar study showing $20000 by the end of the year:

Recent analysis on the current short term symmetrical price action:

👑Best Signals (Forex/Crypto+70% accuracy) & Account Management (+20% profit/month on 10k accounts)
💰Free Channel t.me/tradingshotglobal
🤵Contact info@tradingshot.com t.me/tradingshot
🔥New service: next X100 crypto GEMS!
💰Free Channel t.me/tradingshotglobal
🤵Contact info@tradingshot.com t.me/tradingshot
🔥New service: next X100 crypto GEMS!