Wow, i am a bit amazed to see how ETH' got pumped so much so fast. It reached the target of that inverse H&S within a day, which took 35 days to form. And look at the volume at Bitmex, it's almost 3 times the volume we had in Dec. This strong rally could be a sign for the bigger picture, but it will depend on the coming week or so.
Going to do a bigger picture analysis for ETH' now instead of the lower time frames of what your used to from me. So i wont get into the details now and will just talk about the bigger picture. On the left we can see that previous resistance (green zone), that level can not be breached anymore. Since the volume is this big for ETH', we should prob not even get below the 140/138.
On the right we can see the long term resistance zone around 180/200. Similar to my Bitcoin analysis, that zone needs to break, to make the difference between an ABC' correction or an impulse wave up.
So corrections are normal after a rally, but if we would see them slow down like we did in Dec, than the red line is more likely. If we would see a big consolidation between 150/140 coming week or so and break out, if that rally goes above the 160ish, than the blue version is more likely. That right shoulder is just an assumption, but a likely scenario if we do continue to rally the coming weeks.
Please don't forget to like if you appreciate this :)
Previous analysis:

Lower time frame:
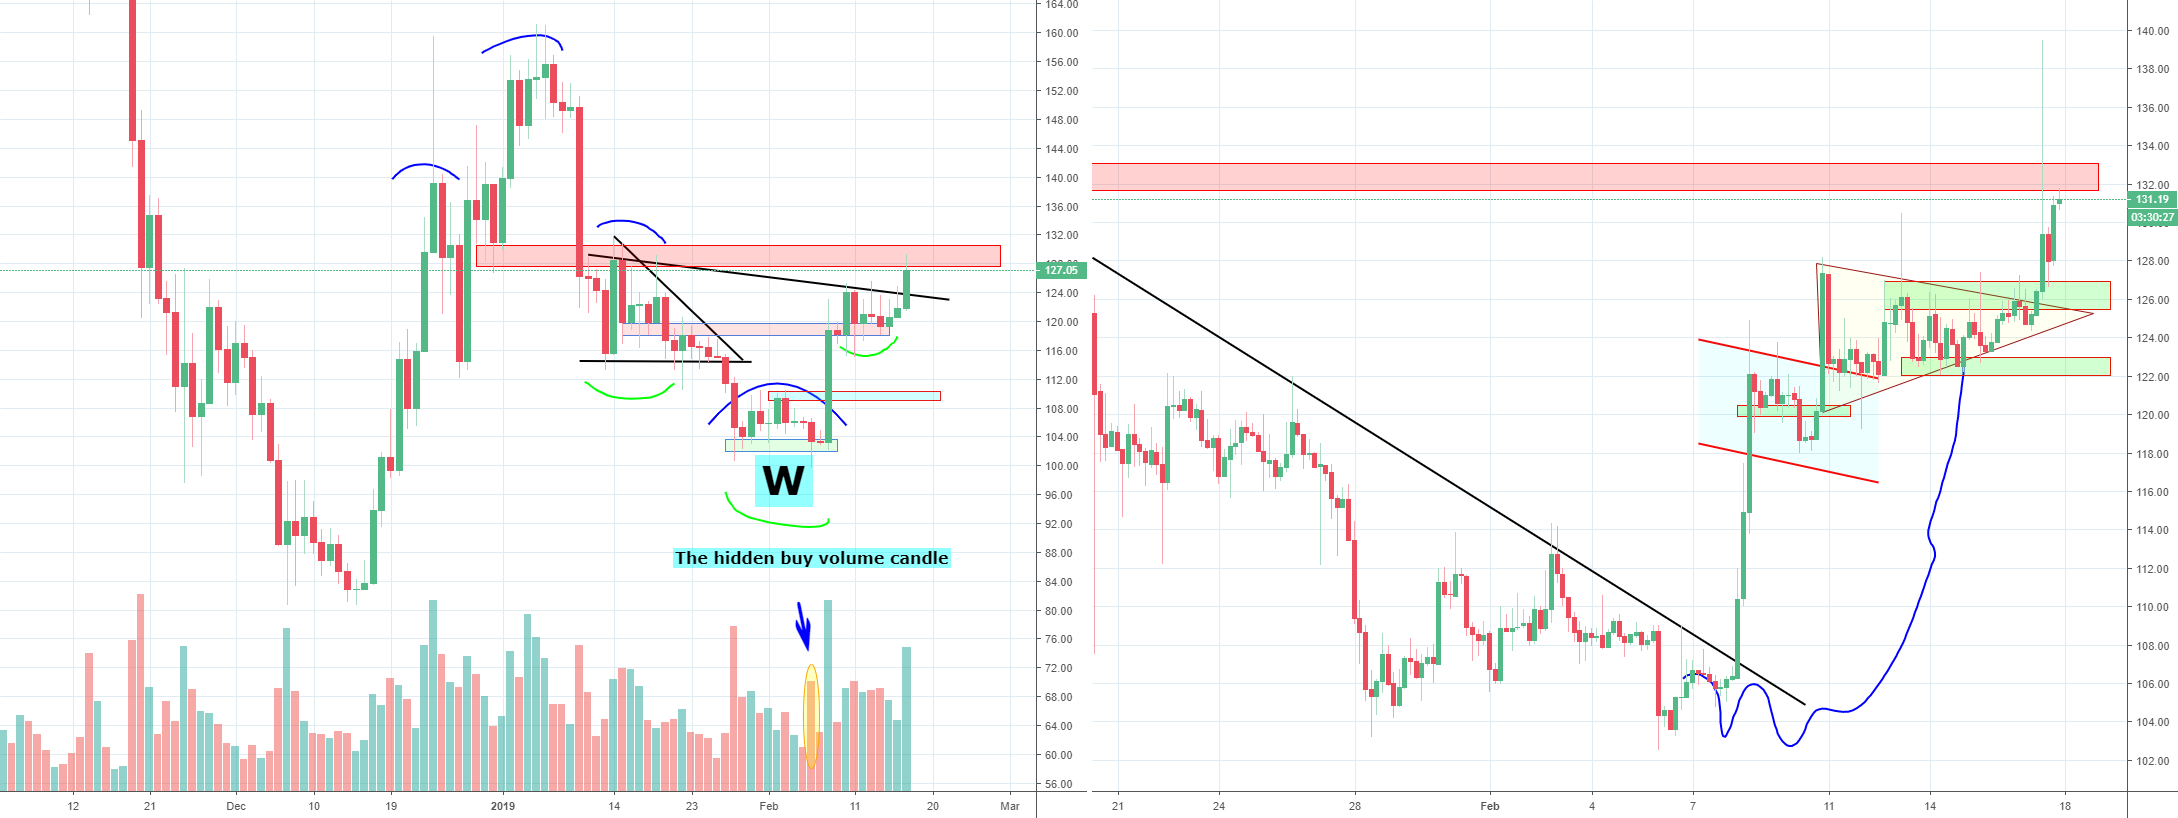
I put the Dec rally next to the current one, Bitcoin' seems to be in the red circle, but when ignoring that i would say ETH' is in the blue one. Small H&S in the middle, neckline already broke (just like Bitcoin') Ideally it stays above the first green support, but a test of the second one could happen as well. While i am writing this, Bitcoin' already reached the target of that small H&S.
Going to do a bigger picture analysis for ETH' now instead of the lower time frames of what your used to from me. So i wont get into the details now and will just talk about the bigger picture. On the left we can see that previous resistance (green zone), that level can not be breached anymore. Since the volume is this big for ETH', we should prob not even get below the 140/138.
On the right we can see the long term resistance zone around 180/200. Similar to my Bitcoin analysis, that zone needs to break, to make the difference between an ABC' correction or an impulse wave up.
So corrections are normal after a rally, but if we would see them slow down like we did in Dec, than the red line is more likely. If we would see a big consolidation between 150/140 coming week or so and break out, if that rally goes above the 160ish, than the blue version is more likely. That right shoulder is just an assumption, but a likely scenario if we do continue to rally the coming weeks.
Please don't forget to like if you appreciate this :)
Previous analysis:
Lower time frame:
I put the Dec rally next to the current one, Bitcoin' seems to be in the red circle, but when ignoring that i would say ETH' is in the blue one. Small H&S in the middle, neckline already broke (just like Bitcoin') Ideally it stays above the first green support, but a test of the second one could happen as well. While i am writing this, Bitcoin' already reached the target of that small H&S.
Comment:
That red line broke and now we seem to be below a small resistance. If that red zone does not break in the middle, we will drop some more and test those supports. Ideally we see something happen like that red circle on the right, still following that idea so far.
Comment:
New ETH analysis:

Want to support me? My affiliates:
partner.bybit.com/b/botje12
onelink.to/quantfury
Add invite code AFTER signing up, bonus up to $250: 4JU345F3
1 trade, 30 day wait, to claim bonus
www.kucoin.com/r/af/rMQN2A5
partner.bybit.com/b/botje12
onelink.to/quantfury
Add invite code AFTER signing up, bonus up to $250: 4JU345F3
1 trade, 30 day wait, to claim bonus
www.kucoin.com/r/af/rMQN2A5
Think if the red support line breaks around 144, we could make a bigger correction towards those greens supports.