Top 3 Forex Gold Setups I Will Be Trading in 2026
Among the different strategies and signals that I relied on in 2025, there were 3 exceptional setups that showed the highest accuracy and profitability.
In this article, I will explain the structure and price model of these setups and equip you with the best entry signals for trading in 2026.
Discover what worked best in Forex and Gold trading in 2025.
The first powerful setup that showed great results last year is based on an old-school price action chart pattern - double top & bottom .
But don't trade each double top & bottom that you spot.
To achieve the highest win rate, these patterns should form on specific time frames and on specific price levels.
Please, study a bullish model:
The price should test a key daily support level.
After that, a double bottom pattern should form on 1H time frame.
Your signal to buy will be a breakout and an hourly candle close above its neckline.
Set your buy limit order on a retest of that,
stop loss will lie below the bottoms,
take profit will be the closest intraday resistance.
Here is an example:
Now, examine a bearish model.
The price should test a key daily resistance level.
After that, a double top pattern should form on 1H time frame.
Your signal to sell will be a breakout and an hourly candle close below its neckline.
Set your sell limit order on a retest of that,
stop loss will lie above the bottoms,
take profit will be the closest intraday support.
Here is an example on NZDUSD forex pair:
Meeting all the required criteria, this setup achieved 76% accuracy in 2025.
The second setup that had a high win rate last year is from Smart Money Concepts trading.
It is based on a combination of liquidity zones, traps, and imbalances.
Please, examine a bullish model of that setup.
We need a t est of a daily liquidity demand zone and a bearish trap below that.
After a trap, a bullish imbalance should occur on an hourly time frame.
I suggest looking for a bullish engulfing candle and return of the price within or even above a liquidity zone with a close of that candle.
Buy the market immediately after a candle close.
Set your stop loss below the low of the trap.
Your take profit will be the closest intraday supply zone.
Please, study an example on EURAUD:
Now, study a bearish model.
We need a test of a daily liquidity supply zone and a bullish trap above that.
After a trap, a bearish imbalance should occur on an hourly time frame.
I recommend looking for a b earish engulfing candle and return of the price within or even below a liquidity zone with a close of that candle.
Sell the market immediately after a candle close.
Set your stop loss above the high of the trap.
Your take profit will be the closest intraday demand zone.
Please, check the example:
Meeting all the conditions, this setup showed 79% accuracy.
The last setup worked phenomenally well in Gold trading last year.
Because of a crazy bullish rally that the market started straight from the beginning of 2025, this simple pattern provided huge gains.
I am talking about a bullish flag pattern.
Please, note that the first 2 setups were bullish and bearish.
In a current case, we are considering only a bullish flag.
Make sure that the market is bullish .
After an update of a new high and a formation of a new higher high higher close, expect a correctional movement on a 4H time frame.
The price should start falling , forming an expanding, parallel or contracting channel - a bullish flag.
Your strong signal to buy will be a bullish breakout and a 4H candle close above a resistance of the flag and the last lower high within that.
Set your buy limit order on a retest of the broken level of the last LH,
Set stop loss below the lows of the flag,
Your take profit will be the closest psychological level above a current high.
Alternatively, you can trade this model without take profit and apply trailing stop loss.
That's the example of this price model:
This pattern achieved 69% accuracy.
But because of a strong bullish momentum, each profitable signal produced enormous gains.
If Gold continues rallying next year, and I think it definitely will, keep an eye on bullish flags as your signal to buy.
Using these 3 setups, you can successfully trade Forex and Gold in 2026.
Integrate them in your trading strategy, learn to recognize them and follow the rules that I provided.
Let these setups bring you huge gains this year.
❤️Please, support my work with like, thank you!❤️
I am part of Trade Nation's Influencer program and receive a monthly fee for using their TradingView charts in my analysis.
Wedge

The Anatomy of a Trap: Why Structure Alone Isn’t EnoughMarkets often look their most convincing right before they become the most deceptive. Clean chart patterns, widely recognized levels, and textbook formations can create a powerful sense of certainty — especially when many traders are seeing the same thing at the same time. Yet, certainty in markets is often where risk quietly concentrates.
The current structure on E-mini Dow Jones futures offers a textbook example of this dynamic. A rising wedge on the daily timeframe, a retracement toward a prior all-time high, and growing bearish conviction all appear neatly aligned. On the surface, the setup looks straightforward. Underneath, however, the market structure tells a more nuanced story — one centered on positioning, order flow, and the risk of traders getting trapped.
This article explores why structure alone is rarely enough, and how technically “correct” ideas can fail when they ignore what sits beneath price.
YM and MYM Futures: Setting the Context
The Dow Jones index futures complex is represented by two primary contracts:
E-mini Dow Jones Futures (YM)
Micro E-mini Dow Jones Futures (MYM)
Both track the same underlying index and reflect the same market structure, with differences primarily in contract size and capital exposure. On the daily timeframe, YM has been trading within a rising wedge — a structure that typically signals slowing upside momentum and an increased risk of a downside resolution.
What makes this moment particularly important is location. The market is not breaking down from a random price zone, but from a region tightly connected to historical reference points and trader memory.
The Rising Wedge: A Structure Everyone Recognizes
Rising wedges are among the most commonly taught chart patterns. They reflect higher highs and higher lows, but with diminishing upside slope — often interpreted as bullish exhaustion.
In this case, price has been retracing within the wedge, drifting toward its lower boundary. From a purely structural standpoint, a break below that lower trendline would appear to confirm the bearish thesis. Many traders anticipate that:
Support failure invites momentum sellers
Stops from late longs are triggered
Short sellers gain directional confirmation
This is where structure becomes compelling — and where risk begins to build.
The Prior All-Time High: A Psychological Fault Line
Just beneath the lower boundary of the rising wedge sits a highly visible reference level: the prior all-time high at 48,528.
Former highs often play a dual role. They act as:
Support for dip buyers expecting continuation
Trigger levels for bearish participation if broken
A decisive trade below such a level tends to shift sentiment quickly. Longs may exit, and short sellers often step in aggressively, expecting downside follow-through. From a traditional technical perspective, this behavior is logical.
But markets are not driven by logic alone — they are driven by positioning.
The Trap: Where Conviction Meets UnFilled Orders
Directly below the wedge and the prior all-time high lies a key element that changes the entire narrative: a notable UFO (UnFilled Order) support zone near 48,004.
UFOs represent areas where significant order flow previously entered the market but was not fully resolved. These zones often act as latent liquidity pockets, capable of absorbing aggressive participation when price revisits them.
Here is where the trap forms.
If price trades below the wedge and below the prior all-time high, it is likely to attract a surge of short sellers acting on:
Pattern breakdown logic
Momentum confirmation
Bearish sentiment reinforcement
However, if that downside move runs directly into unresolved demand from the UFO zone, the market may not continue lower. Instead, selling pressure can be absorbed faster than expected.
At that point, short sellers — confident moments earlier — may find themselves positioned on the wrong side of the market.
Why Structure Alone Isn’t Enough
This is the limitation of standalone technical analysis.
Chart patterns describe shape, not intent. They show where price has been, not how participants are positioned or where liquidity is likely to respond. A structure can break “correctly” and still fail to deliver continuation.
When too many traders act on the same signal at the same location, the market often does the opposite — not out of randomness, but out of mechanics.
In this case:
The rising wedge creates a bearish narrative
The prior high validates that narrative
The UFO support beneath invalidates trader expectations
Understanding this interaction is critical. Structure must always be evaluated alongside order flow context, not independently.
Illustrative Trade Scenario: Understanding Asymmetry
The following is a purely illustrative case study, designed to demonstrate risk logic — not to provide trading instructions.
One hypothetical framework might involve:
Price trading below the wedge and prior all-time high
Short sellers committing aggressively on perceived confirmation
Price interacting with the UFO support zone near 48,004
If selling pressure fails to extend and price stabilizes or reclaims broken structure, short sellers may be forced to cover. That covering process can accelerate upside movement, not because of new bullish conviction, but because trapped positions must be unwound.
In such scenarios:
Risk is defined by invalidation below the support
Reward emerges from forced repositioning
The edge comes from asymmetry, not prediction
The key lesson is not direction, but context.
Risk Management: Traps Cut Both Ways
Traps do not always work. Support and resistance zones based on order flow could fail too, and price can continue lower. This is why risk management remains non-negotiable.
Key principles include:
Predefined risk before engagement
Acceptance of invalidation
Position sizing aligned with volatility
Markets punish certainty. Risk management exists to survive uncertainty.
YM and MYM Contract Specifications
Understanding contract mechanics is essential when applying any analysis.
E-mini Dow Jones Futures (YM)
Contract multiplier: $5 × Dow Jones Index
Minimum tick: 1 index point
Tick value: $5 per contract
Current margin requirement: ~$14,250
Micro E-mini Dow Jones Futures (MYM)
Contract multiplier: $0.50 × Dow Jones Index
Minimum tick: 1 index point
Tick value: $0.50 per contract
Current margin requirement: ~$1,425
Margin requirements vary by broker and market conditions. Micro contracts offer reduced exposure and granularity, while standard contracts provide higher notional exposure. Both reflect identical market structure.
Key Takeaways
This YM case study highlights several enduring market lessons:
Widely recognized structures attract crowded positioning
Breakdowns near major reference levels amplify conviction
UnFilled Orders can absorb participation and reverse expectations
Structure without order flow context is incomplete
Markets don’t move because patterns exist. They move because traders are positioned — and sometimes trapped.
Data Consideration
When charting futures, the data provided could be delayed. Traders working with the ticker symbols discussed in this idea may prefer to use CME Group real-time data plan on TradingView: www.tradingview.com - This consideration is particularly important for shorter-term traders, whereas it may be less critical for those focused on longer-term trading strategies.
General Disclaimer
The trade ideas presented herein are solely for illustrative purposes forming a part of a case study intended to demonstrate key principles in risk management within the context of the specific market scenarios discussed. These ideas are not to be interpreted as investment recommendations or financial advice. They do not endorse or promote any specific trading strategies, financial products, or services. The information provided is based on data believed to be reliable; however, its accuracy or completeness cannot be guaranteed. Trading in financial markets involves risks, including the potential loss of principal. Each individual should conduct their own research and consult with professional financial advisors before making any investment decisions. The author or publisher of this content bears no responsibility for any actions taken based on the information provided or for any resultant financial or other losses.

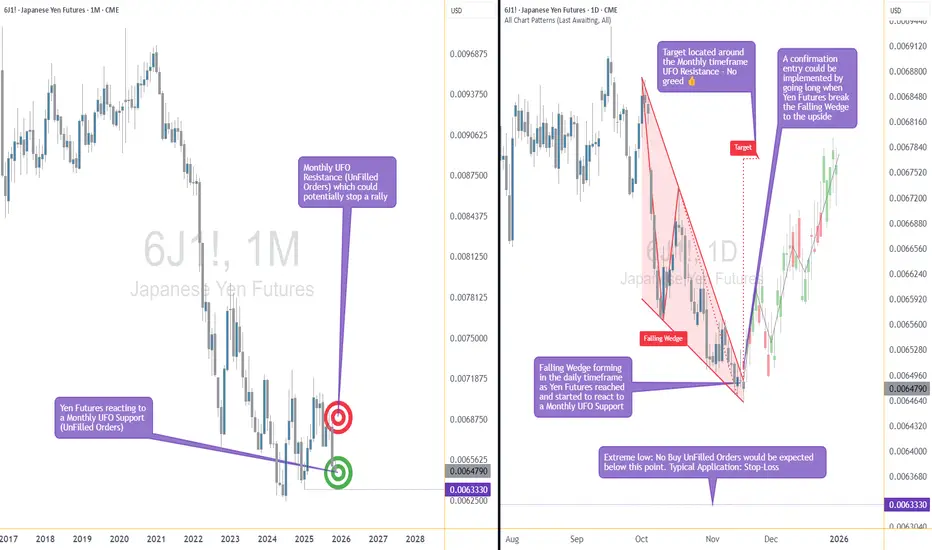
The Support Zone That Refused To Be IgnoredSome chart zones whisper. This one practically waved its arms.
Price slid right into a hefty support area on the higher timeframe… and suddenly started behaving like it had forgotten how to move lower. Classic clue.
Zoom in, and the daily chart shows price squeezing itself into a falling wedge — the market’s equivalent of someone pacing in a hallway, unsure whether to sit down or sprint. Sellers kept trying to push prices lower, but each attempt had less conviction than the last.
When you stack those two pieces together — a big support zone from the monthly chart and a daily pattern running out of room — things start to get interesting. Not predictive, just… interesting.
A breakout above the wedge (around 0.0065030) would basically say, “Alright, I’m done compressing.”
A stop tucked below the lower support range (roughly 0.0063330) keeps the scenario clean.
And a structural projection toward 0.0067695 gives the idea a tidy endpoint if momentum decides to stretch its legs.
Of course, leverage cuts both ways, and traders working with the standard or micro contracts often choose size based on how much room they want between entry and invalidation. When traders choose between the standard and micro versions of this market, it usually comes down to scale. The bigger contract represents 12,500,000 units of the underlying with a $6.25 tick, while the micro mirrors the behavior at 1,250,000 units with a $1.25 tick. Estimated margins also differ — roughly $2,800 for the larger contract and about $280 for the micro. Same chart logic, just two very different footprints on the account.
The real takeaway? When a major zone teams up with a compression pattern, it’s usually worth paying attention. Maybe it leads to a beautiful breakout. Maybe it fizzles. But structurally, this is one of those “save the screenshot” moments.
And whatever the outcome, risk management keeps the whole thing sensible — size smartly, define failure points, and let the chart prove itself instead of assuming it will.
Want More Depth?
If you’d like to go deeper into the building blocks of trading, check out our From Mystery to Mastery trilogy, three cornerstone articles that complement this one:
🔗 From Mystery to Mastery: Trading Essentials
🔗 From Mystery to Mastery: Futures Explained
🔗 From Mystery to Mastery: Options Explained
When charting futures, the data provided could be delayed. Traders working with the ticker symbols discussed in this idea may prefer to use CME Group real-time data plan on TradingView: www.tradingview.com - This consideration is particularly important for shorter-term traders, whereas it may be less critical for those focused on longer-term trading strategies.
General Disclaimer:
The trade ideas presented herein are solely for illustrative purposes forming a part of a case study intended to demonstrate key principles in risk management within the context of the specific market scenarios discussed. These ideas are not to be interpreted as investment recommendations or financial advice. They do not endorse or promote any specific trading strategies, financial products, or services. The information provided is based on data believed to be reliable; however, its accuracy or completeness cannot be guaranteed. Trading in financial markets involves risks, including the potential loss of principal. Each individual should conduct their own research and consult with professional financial advisors before making any investment decisions. The author or publisher of this content bears no responsibility for any actions taken based on the information provided or for any resultant financial or other losses.

A High-Impact Support Zone Meets a Breakout StructureIntroduction
Markets occasionally compress into areas where structure, momentum, and historical buying pressure align with surprising precision. When that compression occurs at a major higher-timeframe floor, traders often pay closer attention—not because the future is predictable, but because the chart reveals a location where price behavior typically becomes informative.
The current case study centers on a market pressing into a high-impact support zone visible on the monthly chart, while the daily chart displays a falling wedge pattern that has gradually narrowed the range of movement. This combination often highlights moments where the auction process is nearing a decision point. The purpose here is to dissect that confluence using multi-timeframe structure, pattern logic, and broad order-flow principles—strictly for educational exploration.
Higher-Timeframe Structure (Monthly)
The monthly chart shows price approaching a well-defined support area between 0.0065425 and 0.0063330, a region that has acted in the past as a base for significant reactions. These areas often develop because markets rarely absorb all buy interest in a single pass; pockets of unfilled orders may remain, leading to renewed reactions when price returns.
This type of zone does not guarantee a reversal. However, historically, when price reaches such levels, traders tend to monitor whether selling pressure slows or becomes less efficient. In this case, the structure suggests a recurring willingness from buyers to engage at these prices, forming a foundation that has held multiple swings.
The presence of a clear, higher-frame resistance at 0.0067530 anchors the broader range. When price rotates between such boundaries, the monthly context often acts as a roadmap: major support below, major resistance above, and room in between for tactical case-study exploration.
Lower-Timeframe Structure (Daily)
Shifting to the daily chart, price action has carved a falling wedge, a pattern often associated with decelerating downside movement. In wedges, sellers continue to push price lower, but with diminishing strength, as each successive low becomes less effective.
This type of compression structure can provide early evidence that the auction is maturing. Traders studying such patterns often watch for:
tightening of the range,
shorter waves into new lows,
initial signs that buyers are defending intraday attempts to drive price lower.
The daily wedge in this case sits directly on top of the monthly support zone—an alignment that strengthens its analytical relevance. The upper boundary of the wedge sits near 0.0065030, and a break above that line is often interpreted as price escaping the compression phase.
Multi-Timeframe Confluence
Multi-timeframe confluence arises when higher-frame structure provides the background bias and lower-frame patterns offer the tactical trigger. In this case:
The monthly chart signals a historically responsive support zone.
The daily chart shows structural compression and slowing downside momentum.
The interaction between them creates a scenario where educational case studies tend to focus on breakout behavior, as the daily timeframe may provide the first evidence that higher-frame buyers are engaging.
This confluence does not imply certainty. It simply highlights a location where structure tends to become more informative, and where traders often study the transition from absorption to response.
Order-Flow Logic (Non-Tool-Specific)
From an order-flow perspective, strong support zones typically develop where prior buying activity left behind unfilled interest. When price returns to that region, two things often happen:
Sellers begin to encounter difficulty driving price lower, as remaining buy orders absorb their activity.
Compression patterns form, as the market oscillates in a tightening range while participants test whether enough liquidity remains to cause a directional shift.
A breakout of the daily wedge represents a potential change in the auction dynamic. While sellers are still active inside the wedge, a breakout suggests their pressure may have become insufficient to continue the sequence of lower highs and lower lows. Traders studying market transitions often use such moments as part of hypothetical scenarios to understand how imbalances evolve.
Forward-Looking Trade Idea (Illustrative Only)
For educational purposes, here is how a structured case study could frame a potential opportunity using the discussed charts:
Entry: A hypothetical entry could be placed above the falling wedge, around 0.0065030, once buyers demonstrate the ability to break outside the compression structure.
Stop-Loss: A logical invalidation area in this case study would be at or below the monthly support, around 0.0063330, where failure would indicate the higher-timeframe zone did not hold.
Target: A purely structural wedge projection would suggest a target near 0.0067695, aligning closely with the broader resistance region on the monthly chart.
These price points yield a reward-to-risk profile that is measurable and logically linked to structure, though not guaranteed. This case study exists solely to illustrate how support-resistance relationships and pattern logic can be combined into a coherent, rules-based plan, not as an actionable idea for trading.
Yen Futures Contract Context
The larger (6J) and micro-sized (MJY) versions of this futures market follow the same underlying price but differ in exposure and margin scale. The standard contract generally carries a greater notional value and therefore translates each price movement into a larger monetary change. The micro contract mirrors the same structure at a reduced size, allowing traders to adjust position scaling more precisely when navigating major zones or breakout structures such as the one discussed in this case study:
6J equals 12,500,000 Japanese Yen per contract, making it suitable for larger, institutional players. (1 Tick = 0.0000005 per JPY increment = $6.25. Required Margin = $2,800)
MJY equals 1,250,000 Japanese Yen per contract, making it suitable for larger, institutional players. (1 Tick = 0.000001 per JPY increment = $1.25. Required Margin = $280)
Understanding margin requirements is essential—these products are leveraged instruments, and small price changes can result in large percentage gains or losses.
Risk Management Considerations
Strong support zones can attract interest, but risk management remains the foundation of any structured approach. Traders studying these transitions typically:
size positions relative to the distance between entry and invalidation,
maintain clear exit criteria when structure fails,
avoid adjusting stops unless the market has invalidated the original reasons for the plan,
adapt to new information without anchoring to prior expectations.
These principles emphasize the importance of accepting uncertainty. Even at major support zones, markets can remain volatile, and scenarios may unfold differently than anticipated.
When charting futures, the data provided could be delayed. Traders working with the ticker symbols discussed in this idea may prefer to use CME Group real-time data plan on TradingView: www.tradingview.com - This consideration is particularly important for shorter-term traders, whereas it may be less critical for those focused on longer-term trading strategies.
General Disclaimer:
The trade ideas presented herein are solely for illustrative purposes forming a part of a case study intended to demonstrate key principles in risk management within the context of the specific market scenarios discussed. These ideas are not to be interpreted as investment recommendations or financial advice. They do not endorse or promote any specific trading strategies, financial products, or services. The information provided is based on data believed to be reliable; however, its accuracy or completeness cannot be guaranteed. Trading in financial markets involves risks, including the potential loss of principal. Each individual should conduct their own research and consult with professional financial advisors before making any investment decisions. The author or publisher of this content bears no responsibility for any actions taken based on the information provided or for any resultant financial or other losses.
What’s a Wedge Pattern?What's up traders! 👋
Wedge patterns are a powerful tool in technical analysis that can give you a heads-up about potential price moves. Whether you’re spotting a falling wedge or a rising wedge, these formations can reveal key signals about market direction.
What’s a Wedge Pattern?
A wedge pattern forms when price moves between two converging trendlines, creating a shape resembling a triangle. These patterns usually appear when the market is slowing down or consolidating before making a bigger move. Wedges can slope upwards or downwards, and the key difference lies in whether the trendlines are converging in an uptrend (rising wedge) or a downtrend (falling wedge).
Falling Wedge Pattern: Bullish Reversal 📈
The falling wedge pattern is a bullish reversal signal. This formation occurs when price moves between two downward-sloping trendlines, creating a series of lower highs and lower lows. The downward momentum weakens as the trendlines converge, indicating that sellers are losing strength, which sets up the potential for a bullish breakout.
How to Trade the Falling Wedge
Entry: Wait for the price to break above the upper trendline. This is your signal to enter long.
Target: Measure the height of the wedge at its widest point and project it upwards from the breakout point.
Stop Loss: Place it just below the most recent swing low to protect your position if the breakout doesn’t happen.
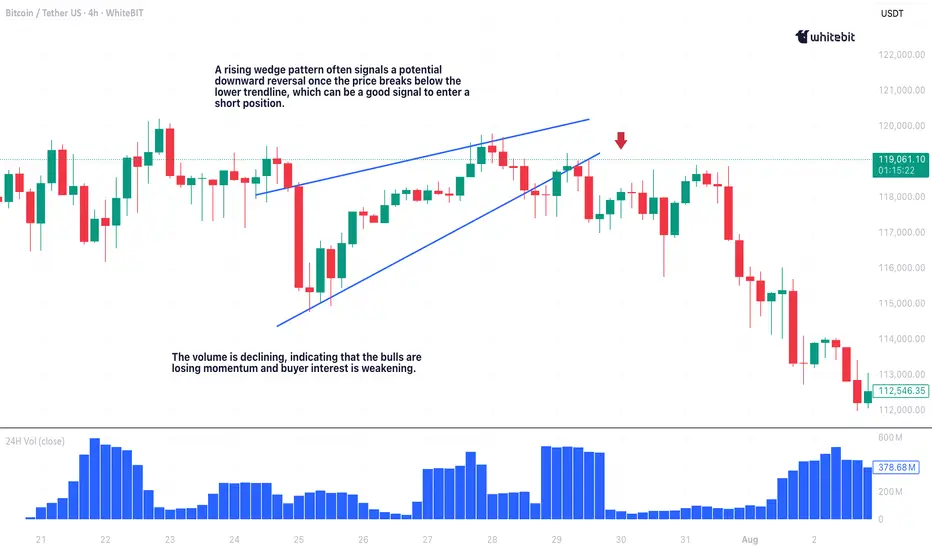
The chart illustrates a falling wedge pattern on the Bitcoin / Tether US pair with a 1-hour timeframe. Price action is contained within two converging downward-sloping trendlines, suggesting weakening bearish momentum. The breakout above the upper trendline signals a bullish reversal, and the subsequent uptick in price confirms the shift in momentum.
In rare cases, a breakout failure can lead to a bearish falling wedge pattern, but this scenario is less common. Keep an eye on the price action for signs of continued upward momentum.
Rising Wedge Pattern: Bearish Reversal 📉
The rising wedge pattern is a bearish reversal signal. This formation happens when price moves between two upward-sloping trendlines, creating higher highs and higher lows. The rising wedge indicates weakening buying pressure and a potential reversal to the downside.
How to Trade the Rising Wedge
Entry: Enter a short position once the price breaks below the lower trendline.
Target: Measure the height of the wedge and project it downward from the breakout point.
Stop Loss: Set it just above the most recent swing high to protect your trade.
Wedge Chart Pattern Trading: Key Tips ⚡
Context is everything when trading wedge patterns. If a bullish wedge pattern appears in an uptrend, it’s more likely to break to the upside. If a bearish wedge shows up in a downtrend, expect a breakdown.
Here are a few quick tips to improve your wedge trading pattern game:
Trendlines are key: Ensure your trendlines are drawn accurately. Properly drawn trendlines lead to better trades.
Breakout confirmation: Confirm breakouts with increased volume and, ideally, by checking for confluence with other indicators like RSI or MACD. A breakout without volume is often a false signal.
Risk management: Always use a stop loss to protect your capital.
Use other indicators: Wedge patterns work well with additional tools such as RSI, moving averages, or MACD. The more confluence, the better!
Final Thoughts 🏁
Wedge patterns, whether it’s the falling wedge pattern signaling a bullish reversal or the rising wedge pattern trading indicating bearish pressure, are some of the most reliable chart formations out there. But remember: no setup is perfect, so always use a stop loss and never rely on a single indicator.
With practice, you’ll get better at spotting these setups and timing your entries and exits like a pro. Happy trading, and may the charts be in your favor! 💰📊
From Strength to Weakness: ETH Validates a Key Bearish PatternIntroduction (Market Context)
Ether Futures (ETH) and Micro Ether Futures (MET) have been at the center of market attention since April 2025, when prices staged a remarkable rally of more than +250%. This surge was not just a technical phenomenon—it came in the wake of major macro events such as Liberation Day and the reemergence of U.S. tariff policies under Donald Trump’s administration. Those developments sparked speculative flows into digital assets, with Ether acting as one of the prime beneficiaries of capital rotation.
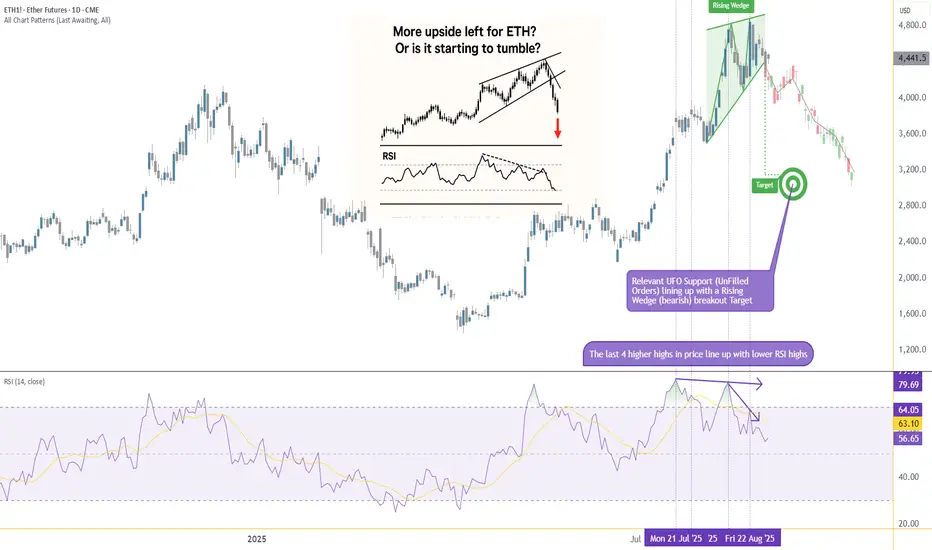
Yet markets rarely move in one direction forever. After such a sharp rise, technical exhaustion often follows, and signs of that exhaustion are beginning to surface on ETH’s daily chart. Traders who enjoyed the rally now face a critical juncture: whether to protect gains or to consider new opportunities in the opposite direction. The key lies in a pattern that has appeared many times in history, often marking important reversals—the Rising Wedge.
What is a Rising Wedge?
A Rising Wedge is one of the most recognizable bearish reversal formations in technical analysis. It typically develops after a strong uptrend, where price continues to push higher but does so with diminishing momentum. On the chart, the highs and lows still point upward, but the slope of the highs is shallower than the slope of the lows, creating a narrowing upward channel.
The psychology behind the wedge is critical: buyers are still in control, but they are running out of strength with every push higher. Sellers begin to absorb demand more aggressively, and eventually, price breaks through the lower boundary of the wedge. This breakdown often accelerates as trapped buyers unwind positions.
From a measurement perspective, technicians project the maximum width of the wedge at its start, and then apply that distance downward from the point of breakdown. This projection offers a technical target for where price may gravitate in the following weeks. In the case of Ether Futures, that target points toward the 3,200 area, a level of strong technical interest and a logical area for traders to watch closely.
RSI and Bearish Divergence
Alongside the wedge, momentum indicators add further weight to the bearish case. The Relative Strength Index (RSI) is a widely used oscillator that measures momentum on a scale of 0 to 100. Values above 70 are generally interpreted as “overbought,” while values below 30 suggest “oversold.”
The most powerful signals often emerge not when RSI is at an extreme, but when it diverges from price action. A bearish divergence occurs when price sets higher highs while RSI forms lower highs. This is an indication that upward momentum is weakening even as price appears to climb.
Ether Futures have displayed this phenomenon clearly over the past few weeks. The daily chart shows four successive higher highs in price, yet RSI failed to confirm these moves, instead tracing a series of lower peaks. Notably, RSI pierced the overbought zone above 70 twice during this period, but momentum faded quickly after each attempt. This divergence is a classic early warning sign that a bullish run is running out of steam.
Forward-Looking Trade Idea
With the Rising Wedge breakdown and RSI divergence in place, a structured trade plan emerges. Futures traders can express this view through either the standard Ether Futures contract (ETH) or its smaller counterpart, the Micro Ether Futures contract (MET).
Contract Specs & Margins
Ether Futures (ETH): Notional = 50 Ether, Tick size = 0.50, Tick value = $25.00, Initial margin ≈ $68,800 (subject to CME updates).
Micro Ether Futures (MET): Notional = 0.1 Ether, Tick size = 0.50, Tick value = $0.05, Initial margin ≈ $140 (subject to CME updates).
Trade Plan (Bearish Setup)
Direction: Short
Entry: 4,360
Target: 3,200
Stop Loss: 4,702 (coinciding with a minor resistance level)
Reward-to-Risk Ratio: ≈ 3.39 : 1
The projected wedge target around 3,200 is not only a measured move from the pattern but also sits close to a previously established UFO support zone. While anecdotal, this confluence reinforces the credibility of the level as a potential magnet for price.
Risk Management
Regardless of how compelling a technical setup may appear, the most decisive factor in trading remains risk management. Defining risk in advance ensures that losses are limited if the market behaves unexpectedly. In this case, placing the stop at 4,702 not only keeps risk under control but also aligns with a minor resistance level, making the trade plan technically coherent.
Position sizing also plays a crucial role. The availability of Micro Ether Futures (MET) allows traders to participate with significantly reduced capital requirements compared to the full-sized ETH contract. This flexibility makes it easier to fine-tune exposure and manage account risk more precisely.
Equally important is the discipline of adhering to precise entries and exits. Chasing a trade or ignoring pre-defined stop levels can erode the edge provided by technical analysis. Markets often deliver multiple opportunities, but without sound risk management, traders may not survive long enough to benefit from them. Ultimately, capital preservation is the foundation on which consistent performance is built.
Closing
Ether’s spectacular rally since April 2025 is a reminder of the asset’s ability to deliver explosive moves under the right conditions. Yet history shows that parabolic advances rarely continue uninterrupted. The combination of a Rising Wedge breakdown and a confirmed RSI divergence provides strong evidence that the current uptrend is losing momentum, and the market may be entering a corrective phase.
For traders, this is less about predicting the future and more about recognizing when probabilities align in favor of a defined setup. With clear entry, target, and stop levels, the ETH and MET contracts offer a structured opportunity for those willing to take a bearish stance while managing their risk appropriately.
When charting futures, the data provided could be delayed. Traders working with the ticker symbols discussed in this idea may prefer to use CME Group real-time data plan on TradingView: www.tradingview.com - This consideration is particularly important for shorter-term traders, whereas it may be less critical for those focused on longer-term trading strategies.
General Disclaimer:
The trade ideas presented herein are solely for illustrative purposes forming a part of a case study intended to demonstrate key principles in risk management within the context of the specific market scenarios discussed. These ideas are not to be interpreted as investment recommendations or financial advice. They do not endorse or promote any specific trading strategies, financial products, or services. The information provided is based on data believed to be reliable; however, its accuracy or completeness cannot be guaranteed. Trading in financial markets involves risks, including the potential loss of principal. Each individual should conduct their own research and consult with professional financial advisors before making any investment decisions. The author or publisher of this content bears no responsibility for any actions taken based on the information provided or for any resultant financial or other losses.
Bullish Energy in Natural Gas: -DMI Extreme + Wedge BreakoutThe Spark in the Gas Market
Natural gas has been quietly simmering in recent weeks, building pressure beneath a surface of consolidation. Traders watching closely will have noticed a rare alignment — one that history shows can potentially precede outsized moves. We’re talking about the convergence of two powerful signals: a -DMI yearly extreme and a falling wedge breakout.
In the past, this combination has marked moments when bearish momentum had run its course, giving way to swift and decisive bullish reversals. Now, that same alignment is flashing again, inviting a closer look at the technical landscape and the potential opportunities it presents.
Why This Setup Matters
The -DMI (Directional Movement Index) measures the strength of downward price moves. When it pushes beyond two standard deviations above its yearly linear regression channel, it signals an overextended bearish phase. Historically, these extremes have often coincided with market bottoms in Natural Gas Futures.
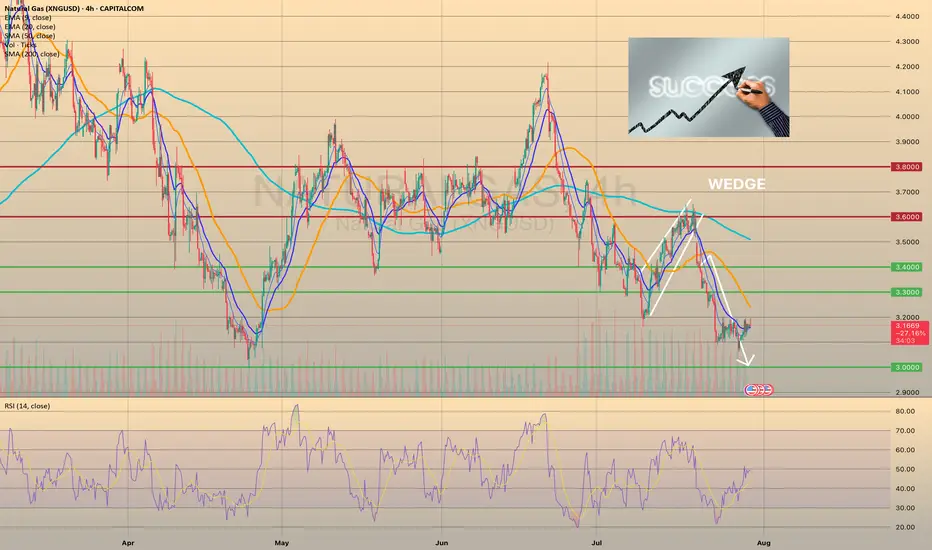
Layer on top a falling wedge — a bullish reversal chart pattern — and the probability of an upside move gains weight. The wedge compresses price action into a narrowing range, reflecting reduced volatility and setting the stage for a potential explosive breakout once resistance gives way. The current breakout level sits near 3.18, with technical projections aligning closely to a well-defined UFO resistance (UnFilled Orders) zone around 3.90.
The Technical Story Unfolds
Looking at the daily chart in the present, the -DMI has recently breached the +2 standard deviation boundary of its 252-period regression channel — a rare occurrence that, as said, has preceded multiple major bullish reversals in the past year. When this condition appeared, downside momentum often faded, making room for buyers to take control.
This time, the current signal aligns with a falling wedge that has been developing for weeks. Price is about to break above the wedge’s upper boundary at approximately 3.18, suggesting a potential trend reversal.
The Trade Blueprint
Direction: Long
Entry: 3.18 (confirmed breakout above wedge resistance)
Target: 3.90 (wedge projection + UFO resistance)
Stop Loss: 2.858 (below wedge and technical support floor)
Reward-to-Risk Ratio: ~2+ to 1
This structure allows traders to define risk tightly while targeting a meaningful upside move. The setup applies equally to both Natural Gas Futures (NG) and Micro Natural Gas Futures (MNG), offering flexibility in capital allocation. For smaller accounts or those wanting to reduce margin exposure, the MNG contract delivers the same tick size precision with only one-quarter of the notional value.
The Contract Advantage
Natural Gas Futures (NG) represent 10,000 MMBtu per contract, with a minimum tick size of 0.00025 — equivalent to $2.50 per tick.
Micro Natural Gas Futures (MNG) are one-tenth the size at 1,000 MMBtu per contract, with the same 0.00025 tick size equaling $0.25 per tick.
Margin requirements vary with volatility and exchange adjustments, but at the time of writing, the CME lists initial margin for NG in the range of $3,500 per contract, while MNG margins are proportionally lower at $350 per contract. This creates flexibility for traders to scale positions or manage risk without altering the technical logic of the trade. Both contracts trade nearly 24 hours per day, Sunday through Friday, offering the ability to react to global energy market shifts in real time.
Risk Management as the Safety Valve
Defining risk is the cornerstone of any trade plan. The stop loss at 2.858 is not arbitrary — it sits below both the wedge’s lower boundary and a nearby technical support level. If price were to close below this level, it would undermine the bullish thesis and call for an exit.
Using smaller MNG contracts can help align risk with account size, allowing for partial position scaling and better drawdown control. Equally important is avoiding undefined risk scenarios, particularly in a commodity as volatile as natural gas. Precision in both entries and exits reduces exposure to intraday whipsaws while maintaining the trade’s structural integrity.
Closing the Loop
The natural gas market has aligned a rare set of conditions — a -DMI yearly extreme and a falling wedge breakout — each of which has historically preceded significant upside moves on their own. Together, they offer a compelling technical case for a defined, risk-managed long position targeting the 3.90 zone.
While no setup guarantees success, this one seems to offer clarity: a well-defined entry, stop, and target, supported by historical probability and pattern structure. In volatile markets, those moments of clarity are worth paying attention to — and acting on with discipline, and always depending on the trader’s trading plan.
When charting futures, the data provided could be delayed. Traders working with the ticker symbols discussed in this idea may prefer to use CME Group real-time data plan on TradingView: www.tradingview.com - This consideration is particularly important for shorter-term traders, whereas it may be less critical for those focused on longer-term trading strategies.
General Disclaimer:
The trade ideas presented herein are solely for illustrative purposes forming a part of a case study intended to demonstrate key principles in risk management within the context of the specific market scenarios discussed. These ideas are not to be interpreted as investment recommendations or financial advice. They do not endorse or promote any specific trading strategies, financial products, or services. The information provided is based on data believed to be reliable; however, its accuracy or completeness cannot be guaranteed. Trading in financial markets involves risks, including the potential loss of principal. Each individual should conduct their own research and consult with professional financial advisors before making any investment decisions. The author or publisher of this content bears no responsibility for any actions taken based on the information provided or for any resultant financial or other losses.

Wedge Pattern: A Key to Trend Reversals and Continuations📈 Wedge Pattern: A Key to Trend Reversals and Continuations
A wedge pattern is a technical chart formation that signals a potential reversal or continuation in the market. It’s formed when price moves between two converging trendlines — either sloping upward or downward — creating a narrowing range over time.
There are two main types of wedge patterns:
🔻 Falling Wedge (Bullish)
Formed during a downtrend or as a correction in an uptrend.
Characterized by lower highs and lower lows, with the slope of the support line steeper than the resistance line.
Typically signals a bullish reversal as momentum builds for a breakout to the upside.
✅ Confirmation: Break above the resistance line with volume surge.
🔺 Rising Wedge (Bearish)
Appears during an uptrend or as a correction in a downtrend.
Shows higher highs and higher lows, but the support line is steeper than the resistance line.
Often leads to a bearish reversal, especially when volume declines into the pattern.
⚠️ Confirmation: Break below the support line with increasing volume.
🧠 Key Characteristics
Volume tends to decrease as the pattern forms, indicating a pause in momentum.
The breakout direction (up or down) determines whether it’s a continuation or reversal signal.
Wedges can appear on any time frame and are useful for both day traders and long-term investors.
📊 Trading Tip
Always wait for confirmation of the breakout before entering a trade. False breakouts can be common, especially in low-volume environments

Wedge Pattern — A Key to Trend Movements📐 Wedge Pattern — A Key to Trend Movements 📈
🔍 Introduction
The Wedge is a chart pattern that represents a phase of directional consolidation following a trending move. It can act as a continuation 🔄 or a reversal 🔃 signal, depending on the context. The structure consists of two converging trendlines, both sloping in the same direction.
🧩 Pattern Description
Unlike the Flag pattern 🚩, the Wedge has no flagpole and doesn’t depend on the direction of the previous move. The direction of the wedge body determines its type:
A falling wedge ⬇️ is bullish 🟢 (buy signal)
A rising wedge ⬆️ is bearish 🔴 (sell signal)
The breakout is the key point to watch. The two trendlines slope in the same direction but at different angles, causing them to converge. This reflects a loss of momentum ⚠️ and typically indicates that buyers or sellers are preparing to take control.
This pattern can act as:
A continuation signal 🧭 — appearing at the end of a correction
A reversal signal 🔄 — forming at the end of a strong trend
📉 Volume is usually low during the wedge and rises on breakout. A low-volume breakout increases the risk of a false breakout ❗. Often, price retests the breakout level 🔁, giving traders a second chance to enter.
🎯 Entry & Stop-Loss Strategy
📥 Entry: On breakout confirmation
🛑 Stop-loss: Below the pattern’s low (bullish) or above its high (bearish), or under/above the most recent local swing point
🎯 Target: Project the height of the widest part of the wedge from the breakout point. Alternatively, use key price levels 📊 or a trailing stop 🔂 to lock in profits.
💡 My Pro Tips for Trading the Wedge
✅ Pattern Criteria
Two converging trendlines ➡️➕➡️
Clearly defined structure ✏️
Prior trending move before the wedge 🚀
Low volume within the wedge 📉, high volume on breakout 📈
Retest of breakout level = confirmation 🔁
🔥 Factors That Strengthen the Signal
Breakout on strong volume 📊💥
Appears after an extended trend 🧭📉📈
More touches = stronger pattern ✍️
Breakout occurs close to the apex 🎯
⚠️ Factors That Weaken the Signal
Low volume on breakout 😐
Poorly defined trendlines 🫥
Few touches on lines
Early breakout (too far from apex) ⏱️
No prior trend / appears in a range-bound market 📏
✅ Examples of My Successful Wedge Trades
📸
❌Examples of Failed Wedge Overview
💥
💬 Do you use the wedge pattern in your trading?
It’s a powerful pattern, especially when confirmed by volume and market structure. Share your favorite wedge setups or ask questions below 👇👇
Understanding Wedge Patterns - A Real Bitcoin Case Study🎓📊 Understanding Wedge Patterns - A Real Bitcoin Case Study 🧠📈
Hi everyone, FXPROFESSOR here 👨🏫
From this moment forward, I will no longer be posting targets or trade setups here on TradingView. Instead, I’ll be focusing 100% on education only for here in Tradinfview.
Why? Because over time I’ve learned that even when traders receive the right charts, most still struggle to trade them effectively. So, from now on, FX Professor Crypto content here will be strictly educational — designed to teach you how to read and react to the markets like a professional. Unfortunately I cannot be posting on Tradingview frequent updates like I do all day. Education is always better for you guys. And i am very happy to share here with you what matters the most.
🧩 In today’s post, we dive into one of the most misunderstood formations: the wedge pattern.
Most resources show wedges breaking cleanly up or down — but real price action is messier.
🎥 I recorded a video a few days ago showing exactly how BTC respected a wedge formation.
⚠️ Note: Unfortunately, TradingView doesn’t play the audio of that clip — apologies that you can’t hear the live commentary — but the visuals are clear enough to follow the logic. (there is no advertising of any kind on the video so i hope i don't get banned again - i did make a mistake the last time and will avoid it-the community here is awesome and needs to stay clean and within the rules of TV).
Here’s what happened:
🔸 A clean wedge formed over several days
🔸 We anticipated a fake move to the downside, grabbing liquidity
🔸 BTC rebounded off support around a level marked in advance
🔸 Then price re-entered the wedge, flipping support into resistance
The lesson?
📉 Often price will exit the wedge in the wrong direction first — trapping retail traders — before making the real move. This is a classic liquidity trap strategy, exercised by the 'market'.
💡 Remember:
Wedges often compress price until it "runs out of space"
The initial breakout is often a trap
The true move tends to come after liquidity is taken
The timing of the 'exit' has a lot to do with the direction. In the future we will cover more examples so pay attention.
I stayed long throughout this move because the overall market context remained bullish — and patience paid off.
Let this be a reminder: it’s not about guessing the direction — it’s about understanding the mechanics.
More educational breakdowns to come — keep learning, keep growing.
One Love,
The FX PROFESSOR 💙
Disclosure: I am happy to be part of the Trade Nation's Influencer program and receive a monthly fee for using their TradingView charts in my analysis. Awesome broker, where the trader really comes first! 🌟🤝📈

Trading Divergences With Wedges in ForexTrading Divergences With Wedges in Forex
Divergence trading in forex is a powerful technique for analysing market movements, as is observing rising and falling wedges. This article explores the synergy between divergence trading and wedges in forex, offering insights into how traders can leverage these signals. From the basics to advanced strategies, learn how you could utilise this approach effectively, potentially enhancing your trading skills in the dynamic forex market.
Understanding Divergences
In forex trading, the concept of divergence plays a pivotal role in identifying potential market shifts. A divergence in forex, meaning a situation where price action and a technical indicator like the Relative Strength Index (RSI) or Moving Average Convergence Divergence (MACD) move in opposite directions, often signals a weakening trend. This discrepancy is a valuable tool in divergence chart trading, as it may indicate a possible reversal or continuation of the current trend.
There are two primary types of divergence in forex—regular and hidden. Regular divergence occurs when the price makes higher highs or lower lows while the indicator does the opposite, often signalling a reversal. Hidden divergence, on the other hand, happens when the price makes lower highs or higher lows while the indicator shows higher highs or lower lows, typically suggesting a continuation of the current trend.
Trading Rising and Falling Wedges
Rising and falling wedges are significant patterns in forex trading, often signalling potential trend reversals. A rising wedge, formed by converging upward trendlines, often indicates a bearish reversal if it appears in an uptrend. Conversely, a falling wedge, characterised by converging downward trendlines, typically reflects a bullish reversal if it occurs in a downtrend.
Traders often look for a breakout from these patterns as a signal to enter trades. For rising wedges, a downward breakout can be seen as a sell signal, while an upward breakout from a falling wedge is often interpreted as a buy signal. When combined with divergences, this chart pattern can add confirmation and precede strong movements.
Best Practices for Trading Divergences
Trading divergence patterns in forex requires a keen eye for detail and a disciplined, holistic approach. Here are key practices for effective trading:
- Comprehensive Analysis: Before trading on divergence and wedges, be sure to analyse overall market conditions.
- Selecting the Right Indicator: Choose a forex divergence indicator that suits your trading style. Common choices include RSI, MACD, and Stochastic.
- Confirmation Is Key: It’s best to watch for additional confirmation from price action or other technical tools before entering a trade.
- Risk Management: Traders always set stop-loss orders to manage risk effectively. Divergence trading isn't foolproof; protecting your capital is crucial.
- Patience in Entry and Exit: Be patient as the divergence develops and confirm with your chosen indicators before entering or exiting a trade.
Strategy 1: RSI and Wedge Divergence
Traders focus on regular divergence patterns when the RSI is above 70 (overbought) or below 30 (oversold), combined with a rising or falling wedge pattern. The strategy hinges on identifying highs or lows within these RSI extremes. It's not crucial if the RSI remains consistently overbought or oversold, or if it fluctuates in and out of these zones.
Entry
- Traders may observe a regular divergence where both the price highs/lows and RSI readings are above 70 or below 30.
- After the formation of a lower high (in an overbought zone) or a higher low (in an oversold zone) in the RSI, traders typically watch as the RSI crosses back below 70 or above 30. This is accompanied by a breakout from a rising or falling wedge, acting as a potential signal to enter.
Stop Loss
- Stop losses might be set just beyond the high or low of the wedge.
Take Profit
- Profit targets may be established at suitable support/resistance levels.
- Another potential approach is to exit when the RSI crosses back into the opposite overbought/oversold territory.
Strategy 2: MACD and Wedge Divergence
Regarded as one of the best divergence trading strategies, MACD divergence focuses on the discrepancy between price action and the MACD histogram. The strategy is particularly potent when combined with a rising or falling wedge pattern in price.
Entry
- Traders typically observe for the MACD histogram to diverge from the price. This divergence manifests as the price reaching new highs or lows while the MACD histogram fails to do the same.
- The strategy involves waiting for the MACD signal line to cross over the MACD line in the direction of the anticipated reversal. This crossover should coincide with a breakout from the rising or falling wedge.
- After these conditions are met, traders may consider entering a trade in anticipation of a trend reversal.
Stop Loss
- Stop losses may be set beyond the high or low of the wedge, which may help traders manage risk by identifying a clear exit point if the anticipated reversal does not materialise.
Take Profit
- Profit targets might be established at nearby support or resistance levels, allowing traders to capitalise on the expected move while managing potential downside.
Strategy 3: Stochastic and Wedge Divergence
Stochastic divergence is a key technique for divergence day trading in forex, especially useful for identifying potential trend reversals. This strategy typically employs the Stochastic Oscillator with settings of 14, 3, 3.
Entry
- Traders may look for divergence scenarios where the Stochastic readings are above 80 or below 20, mirroring the RSI approach.
- This divergence is observed in conjunction with price action, forming a rising or falling wedge.
- Entry may be considered following a breakout from the wedge, which signals a potential shift in market direction.
Stop Loss
- Setting stop losses just beyond the high or low of the wedge might be an effective approach.
Take Profit
- Profit targets may be set at key support/resistance levels.
The Bottom Line
Divergence trading, coupled with the analysis of rising and falling wedges, offers a comprehensive approach to navigating the forex market. By integrating the discussed strategies with sound risk management and market analysis, traders may potentially enhance their ability to make informed decisions in the dynamic world of forex.
This article represents the opinion of the Companies operating under the FXOpen brand only. It is not to be construed as an offer, solicitation, or recommendation with respect to products and services provided by the Companies operating under the FXOpen brand, nor is it to be considered financial advice.

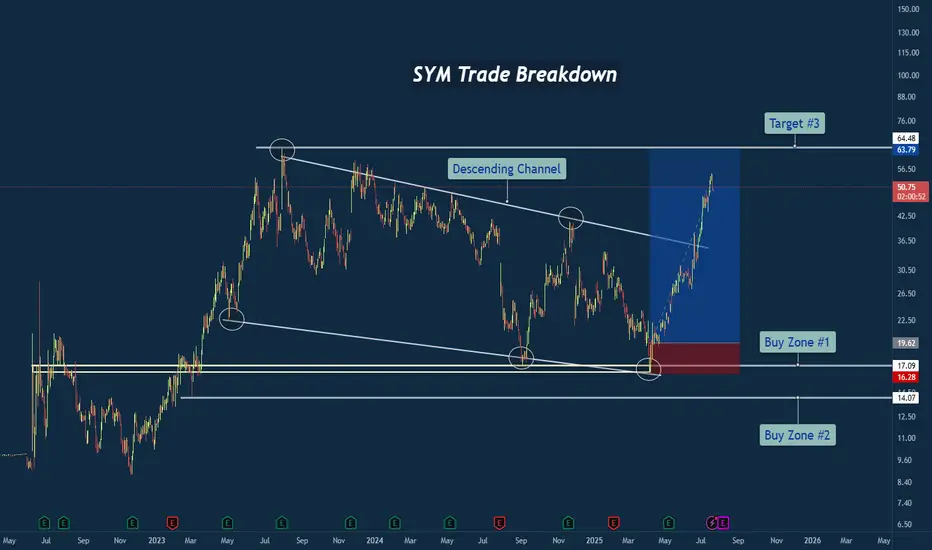
SYM Trade Breakdown – Robotics Meets Smart Technical's🧪 Company: Symbotic Inc. ( NASDAQ:SYM )
🗓️ Entry: April–May 2025
🧠 Trade Type: Swing / Breakout Reversal
🎯 Entry Zone: $16.28–$17.09
⛔ Stop Loss: Below $14.00
🎯 Target Zone: $50–$64+
📈 Status: Strong Rally in Motion
📊 Why This Trade Setup Stood Out
✅ Macro Falling Wedge Reversal
After nearly two years of compression inside a falling wedge, price finally tapped multi-year structural support and fired off with strength. This wasn’t just a bottom — it was a structural inflection point.
✅ Triple Tap at Demand Zone
Symbotic tapped the ~$17 area multiple times, signaling strong accumulation. Volume and momentum picked up with each successive test, showing institutional interest.
✅ Clean Break of Trendline
Price broke through the falling resistance trendline decisively, confirming the bullish reversal and unleashing stored energy from months of sideways structure.
🔍 Company Narrative Backdrop
Symbotic Inc. isn't just any tech stock. It’s at the forefront of automation and AI-powered supply chain solutions, with real-world robotics deployed in major retail warehouses. That kind of secular growth narrative adds rocket fuel to technical setups like this — especially during AI adoption surges.
Founded in 2020, Symbotic has quickly become a rising name in logistics and warehouse automation, serving the U.S. and Canadian markets. With robotics in demand and investors chasing future-ready tech, the price action aligned perfectly with the macro theme.
🧠 Lessons from the Trade
⚡ Compression = Expansion: Wedges like this build pressure. When they break, the moves are violent.
🧱 Structure Never Lies: The $17 zone was no accident — it was respected over and over.
🤖 Tech Narrative Boosts Confidence: Trading is easier when the fundamentals align with the technicals.
💬 What’s Next for SYM?
If price holds above the wedge and clears the $64 resistance, we could be looking at new all-time highs in the next cycle. Watching for consolidation and retests as opportunity zones.
#SYM #Symbotic #Robotics #Automation #AIStocks #BreakoutTrade #FallingWedge #SwingTrade #TechnicalAnalysis #TradingView #TradeRecap #SupplyChainTech
Wedge Pattern – Simple Explanation
📚 Wedge Pattern – Simple Explanation
A wedge pattern is a shape on the chart that looks like a triangle or cone. It tells us that the price is getting ready to break out — either up or down.
---
🔻 Falling Wedge (Bullish)
Looks like price is going down, but slowly.
Lines move closer together.
Usually means the price will go up soon.
It's a bullish signal (good for buying).
---
🔺 Rising Wedge (Bearish)
Price goes up, but losing strength.
Lines get closer together.
Usually means the price will go down soon.
It's a bearish signal (good for selling).
---
💡 Easy Tips:
Wait for breakout (big move out of the wedge).
Use a stop-loss below/above the pattern.
Target = height of the wedge.
---
📌 In Short:
Wedge = Squeeze pattern.
Falling wedge = Buy chance.
Rising wedge = Sell chance.
---
Let me know if you have sny doubt in comments

What is a Bearish Breakaway and How To Spot One!This Educational Idea consists of:
- What a Bearish Breakaway Candlestick Pattern is
- How its Formed
- Added Confirmations
The example comes to us from EURGBP over the evening hours!
Since I was late to turn it into a Trade Idea, perfect opportunity for a Learning Curve!
Hope you enjoy and find value!

Real Success Rates of the Falling Wedge in TradingReal Success Rates of the Falling Wedge in Trading
The falling wedge is a chart pattern highly valued by traders for its potential for bullish reversals after a bearish or consolidation phase. Its effectiveness has been extensively studied and documented by various technical analysts and leading authors.
Key Statistics
Bullish Exit: In 82% of cases, the exit from the falling wedge is upward, making it one of the most reliable patterns for anticipating a positive reversal.
Price Target Achieved: The pattern's theoretical target (calculated by plotting the height of the wedge at the breakout point) is achieved in approximately 63% to 88% of cases, depending on the source, demonstrating a high success rate for profit-taking.
Trend Reversal: In 55% to 68% of cases, the falling wedge acts as a reversal pattern, signaling the end of a downtrend and the beginning of a new bullish phase.
Pullback: After the breakout, a pullback (return to the resistance line) occurs in approximately 53% to 56% of cases, which can provide a second entry opportunity but tends to reduce the pattern's overall performance.
False Breakouts: False exits represent between 10% and 27% of cases. However, a false bullish breakout only results in a true bearish breakout in 3% of cases, making the bullish signal particularly robust.
Performance and Context
Bull Market: The pattern performs particularly well when it appears during a corrective phase of an uptrend, with a profit target reached in 70% of cases within three months.
Gain Potential: The maximum gain potential can reach 32% in half of cases during a bullish breakout, according to statistical studies on equity markets.
Formation Time: The wider the wedge and the steeper the trend lines, the faster and more violent the post-breakout upward movement will be.
Comparative Summary of Success Rates:
Criteria Rate Observed Frequency
Bullish Exit 82%
Price Target Achieved 63% to 88%
Reversal Pattern 55% to 68%
Pullback After Breakout 53% to 56%
False Breakouts (False Exits) 10% to 27%
Bullish False Breakouts Leading to a Downside 3%
Points of Attention
The falling wedge is a rare and difficult pattern to correctly identify, requiring at least five contact points to be valid.
Performance is best when the breakout occurs around 60% of the pattern's length and when volume increases at the time of the breakout.
Pullbacks, although frequent, tend to weaken the initial bullish momentum.
Conclusion
The falling wedge has a remarkable success rate, with more than 8 out of 10 cases resulting in a bullish exit and a price target being reached in the majority of cases. However, it remains essential to validate the pattern with other technical signals (volume, momentum) and to remain vigilant against false breakouts, even if their rate is relatively low. When mastered, this pattern proves to be a valuable tool for traders looking for optimized entry points on bullish reversals.

Falling Wedge Trading Pattern: Unique Features and Trading RulesFalling Wedge Trading Pattern: Unique Features and Trading Rules
Various chart patterns give an indication of possible market direction. A falling wedge is one such formation that indicates a possible bullish reversal. This FXOpen article will help you understand whether the falling wedge pattern is bullish or bearish, what its formation signifies about the market direction, and how it can be used to spot trading opportunities.
What Is a Falling Wedge Pattern?
Also known as the descending wedge, the falling wedge technical analysis chart pattern is a bullish formation that typically occurs in the downtrend and signals a trend reversal. It forms when an asset's price drops, but the range of price movements starts to get narrower. As the formation contracts towards the end, the buyers completely absorb the selling pressure and consolidate their energy before beginning to push the market higher. A falling wedge pattern means the end of a market correction and an upside reversal.
How Can You Spot a Falling Wedge on a Price Chart?
This pattern is usually spotted in a downtrend, which would indicate a possible bullish reversal. However, it may appear in an uptrend and signal a trend continuation after a market correction. Either way, the falling wedge provides bullish signals. The descending formation generally has the following features.
- Price Action. The price trades lower, forming lower highs and lower lows.
- Trendlines. Traders draw two trendlines. One connects the lower highs, and the other connects the lower lows. Finally, they intersect towards a convergence point. Each line should connect at least two points. However, the greater the number, the higher the chance of the market reversal.
- Contraction. The contraction in the price range signals decreasing volatility in the market. As the formation matures, new lows contract as the selling pressure decreases. Thus, the lower trendline acts as support, and the price consolidating within the narrowing range creates a coiled spring effect, finally leading to a sharp move on the upside. The price breaks through the upper trendline resistance, indicating that sellers are losing control and buyers are gaining momentum, resulting in an upward move.
- Volume. The trading volume ideally decreases as the pattern forms, and the buying volume increases with the breakout above the upper trendline, reflecting a shift in momentum towards the buyers.
Falling and Rising Wedge: Differences
There are two types of wedge formation – rising (ascending) and falling (descending).
An ascending wedge occurs when the highs and lows rise, while a descending wedge pattern has lower highs and lows. In an ascending formation, the slope of the lows is steeper and converges with the upper trendline at some point, while in a descending formation, the slope of the highs is steeper and converges with the support trendline at some point.
Usually, a rising wedge indicates that sellers are taking control, resulting in a downside breakdown. Conversely, a descending wedge pattern indicates that buyers are gaining momentum after consolidation, generally resulting in an upside breakout.
The Falling Wedge: Trading Rules
Trading the falling wedge involves waiting for the price to break above the upper line, typically considered a bullish reversal. The pattern’s conformity increases when it is combined with other technical indicators.
- Entry
According to theory, the ideal entry point is after the price has broken above the wedge’s upper boundary, indicating a potential upside reversal. Furthermore, this descending wedge breakout should be accompanied by an increase in trading volume to confirm the validity of the signal.
The price may retest the resistance level before continuing its upward movement, providing another opportunity to enter a long position. However, the entry point should be based on the traders' risk management plan and trading strategy.
- Take Profit
It is essential to determine an appropriate target level. Traders typically set a profit target by measuring the height of the widest part of the formation and adding it to the breakout point. Another approach some traders use is to look for significant resistance levels above the breakout point, such as previous swing highs.
- Stop Loss
Traders typically place their stop-loss orders just below the lower boundary of the wedge. Also, the stop-loss level can be based on technical or psychological support levels, such as previous swing lows. In addition, the stop-loss level should be set according to the trader's risk tolerance and overall trading strategy.
Trading Example
In the chart above, there is a falling wedge. A trader opened a buy position on the close of the breakout candlestick. A stop loss was placed below the wedge’s lower boundary, while the take-profit target was equal to the pattern’s widest part.
Falling Wedge and Other Patterns
Here are chart patterns that can be confused with a falling wedge.
Falling Wedge vs Bullish Flag
These are two distinct chart formations used to identify potential buying opportunities in the market, but there are some differences between the two.
A descending wedge is a bullish setup, forming in a downtrend. It is characterised by two converging trendlines that slope downward, signalling decreasing selling pressure. A breakout above the upper trendline suggests a bullish move.
A bullish flag appears after a strong upward movement and forms a rectangular shape with parallel trendlines that slope slightly downward or move sideways. This formation represents a brief consolidation before the market resumes its upward trajectory.
While the falling wedge indicates a potential shift in a downtrend, the bullish flag suggests a continuation of an uptrend.
Falling Wedge vs Bearish Pennant
The falling wedge features two converging trendlines that slope downward, indicating decreasing selling pressure and often signalling a bullish reversal when the price breaks above the upper trendline.
Conversely, the bearish pennant forms after a significant downward movement and is characterised by converging trendlines that create a small symmetrical triangle. This pattern represents a consolidation phase before the market continues its downward trend upon breaking below the lower trendline.
While the falling wedge suggests a potential bullish move, the bearish pennant indicates a continuation of the bearish trend.
Falling Wedge vs Descending Triangle
The falling wedge consists of two downward-sloping converging trendlines, indicating decreasing selling pressure and often signalling a bullish reversal when the price breaks above the upper trendline. In contrast, the descending triangle features a flat lower trendline and a downward-sloping upper trendline, suggesting a buildup of selling pressure and typically signalling a bearish continuation when the price breaks below the flat lower trendline.
While the falling wedge is associated with a potential bullish move, the descending triangle generally indicates a bearish trend.
Falling Wedge: Advantages and Limitations
Like any technical pattern, the falling wedge has both limitations and advantages.
Advantages
- High Probability of a Reversal. The falling wedge is often seen as a strong, bullish signal, especially when it occurs after a downtrend. It suggests that selling pressure is subsiding, and a reversal to the upside may be imminent.
- Clear Entry and Exit Points. The pattern provides clear points for entering and exiting trades. Traders often enter when the price breaks out above the upper trendline and set stop-loss orders below a recent low within the formation.
- Versatility. The wedge can be used in various market conditions. It is effective in both continuation and reversal scenarios, though it is more commonly associated with bullish reversals.
- Widely Recognised. Since the falling wedge is a well-known formation, it is often self-fulfilling to some extent, as many traders recognise and act on it, further driving the market.
Limitations
- False Breakouts. Like many chart patterns, the falling wedge is prone to false breakouts. Prices may briefly move above the resistance line but then fall back below, trapping traders.
- Dependence on Market Context. The effectiveness of the falling wedge can vary depending on broader market conditions. In a strong downtrend, it might fail to result in a significant reversal.
- Requires Confirmation. The wedge should be confirmed with other technical indicators or analysis tools, such as volumes or moving averages, to increase the likelihood of an effective trade. Relying solely on the falling wedge can be risky.
- Limited Use in Low-Volatility Markets. In markets with low volatility, the falling wedge may not be as reliable, as price movements might not be strong enough to confirm the falling wedge's breakout.
The Bottom Line
The falling wedge is a powerful chart pattern that can offer valuable insights into potential trend reversals or continuations, depending on its context within the broader market. By understanding and effectively utilising the falling wedge in your strategy, you can enhance your ability to identify many trading opportunities. As with all trading tools, combining it with a comprehensive trading plan and proper risk management is crucial.
FAQ
Is a Falling Wedge Bullish?
Yes, the falling wedge is a bullish continuation pattern in an uptrend, and it acts as a bullish reversal formation in a bearish market.
What Does a Falling Wedge Pattern Indicate?
It indicates that the buyers are absorbing the selling pressure, which is reflected in the narrower price range and finally results in an upside breakout.
What Is the Falling Wedge Pattern Rule?
The falling wedge is a technical analysis formation that occurs when the price forms lower highs and lower lows within converging trendlines, sloping downward. Its rule is that a breakout above the upper trendline signals a potential reversal to the upside, often indicating the end of a downtrend or the continuation of a strong uptrend.
How to Trade Descending Wedge Patterns?
To trade descending wedges, traders first identify them by ensuring that the price is making lower highs and lows within converging trendlines. Then, they wait for the price to break out above the upper trendline, ideally accompanied by increased trading volume, which confirms the breakout. After the breakout, a common approach is to enter a long position, aiming to take advantage of the anticipated upward movement.
What Is the Target of the Descending Wedge Pattern?
The target for a descending wedge is typically set by measuring the maximum width of the wedge at its widest part and projecting that distance upwards from the breakout point. This projection gives a potential price target.
What Is the Entry Point for a Falling Wedge?
The entry point for a falling wedge is ideally just after the breakout above the upper trendline. Some traders prefer to wait for a retest of the broken trendline, which may act as a new support level, before entering a trade to confirm the breakout.
*Important: At FXOpen UK, Cryptocurrency trading via CFDs is only available to our Professional clients. They are not available for trading by Retail clients. To find out more information about how this may affect you, please get in touch with our team.
This article represents the opinion of the Companies operating under the FXOpen brand only. It is not to be construed as an offer, solicitation, or recommendation with respect to products and services provided by the Companies operating under the FXOpen brand, nor is it to be considered financial advice.

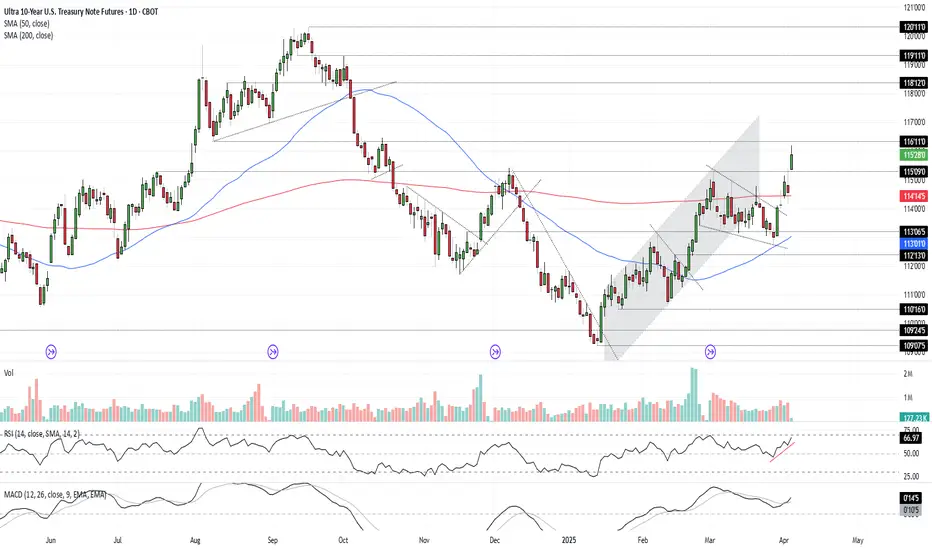
Bonds Don’t Lie: The Signal is ClearU.S. 10-year Treasuries are a crucial cog in the global financial machine, serving as a benchmark borrowing rate, a tool for asset valuation, and a gauge of the longer-term outlook for U.S. economic growth and inflation.
As such, I keep a close eye on 10-year note futures, as they can offer clues on directional risks for bond prices and yields. The price action over the past few days has sent a clear and obvious signal as to where the risks lie: prices higher, yields lower.
Futures had been grinding lower within a falling wedge for several weeks but broke higher last Friday on decent volumes following soft U.S. household spending data. It has since extended bullish the move, reclaiming the 200-day moving average before surging above key resistance at 115’09’0 after Trump’s reciprocal tariff announcement on Wednesday.
RSI (14) is trending higher but isn’t yet overbought, while MACD has crossed the signal line above 0, confirming the bullish momentum signal. That favours further upside, putting resistance at 116’11’0 and 118’12’0 on the immediate radar. For those who prefer it expressed in yield terms, that’s around 4% and 3.8% respectively.
Good luck!
DS
Best Chart Patterns to Buy Gold in Uptrend
One of the proven strategies to safely buy gold in uptrend is to look for THESE chart patterns.
In this article, I will teach 4 best bullish price action patterns for Gold trading.
All the patterns that we will discuss work perfectly on a daily, 4h, 1h time frames.
The first strong bullish pattern, that we will discuss, is a bullish flag pattern.
The pattern is based on 2 important elements:
a bullish impulse leg and a bearish correctional movement afterward.
The highs and lows of a correctional movement should respect 2 falling trend lines: one being a vertical resistance and one being a vertical support.
These 2 trend lines will compose a falling parallel channel.
Your strong bullish signal will be a breakout of the resistance of the flag - a candle close above that.
The trading strategy of this pattern is very straightforward .
After a violation of the resistance of the flag is confirmed , buy the market immediately or on a retest. Place stop loss order below the lowest low of the pattern, initial target - the high of the pattern with a potential bullish continuation to a new high.
Look at a bullish flag pattern on Gold on a 4H time frame. A bullish breakout of its upper boundary was a perfect signal to buy XAUUSD.
The variation of a bullish flag pattern is a falling wedge pattern.
In a wedge pattern, a correctional movement occurs within a contracting channel based on 2 converging trend lines.
The same strategy is applied for buying wedge pattern after a breakout .
Above, you can see a falling wedge on Gold chart on a daily that was formed after a completion of a sharp bullish wave. Bullish violation of the resistance line of the pattern was a strong call to open long position.
Trading hundreds of bullish flags and falling wedges, I noticed that the wedge patter has a little bit higher accuracy.
The next chart pattern for buying Gold is called Ascending Triangle.
After completing a bullish impulse and setting a higher high, the market should start consolidating .
A consolidation should have a specific shape: the price should start respecting a horizontal resistance based on the last high and drop from that, setting equal high and a consequent higher low after every bearish movement.
A reliable bullish signal will be a breakout - a candle close above a horizontal resistance line based on the equal highs.
Buy Gold immediately after a violation, or set a buy limit order on a retest of a broken resistance.
Safe stop loss will be at least below the last higher low.
If you are taking the trade on 1H time frame, set it below the first higher low.
Take profit will be the next potentially strong resistance.
With the absence of historic resistances, your goal can be the next psychological level based on round numbers.
That's a perfect example of the ascending triangle pattern that formed on Gold on a daily time frame. After a breakout of its resistance, a bullish rally initiated.
Usually, the pattern is considered to be completed when the price sets at least 3 higher lows and 3 highers highs.
If only 2 equals highs and 2 higher lows are set, such a pattern will be called Cup & Handle.
Entry, stop loss and target rules are the same as in ascending triangle trading.
That's a nice cup & handle pattern on Gold on a 4H. Violation of its resistance triggered a significant trend-following movement.
The last pattern for buying Gold is horizontal parallel channel.
It should form after a completion of a bullish wave and represent a consolidation and indecision.
The price should set equal highs and consequent equal lows, respecting horizontal support and resistance.
A strong bullish signal to buy Gold will be a breakout of a horizontal resistance of the channel and a candle close above.
The principles of its trading strategy are very similar.
Open long position on Gold immediately after a candle close above the resistance or on its retest.
Stop loss should be placed below the support of the channel.
Take profit will be the next historic or (if there is no) psychological level.
Check this horizontal channel that was spotted on a daily time frame on Gold chart. After quite an extended consolidation within, the price violated its upper boundary and went up.
All these chart patterns have a unique shape and structure and are very easy to recognize. Apply them for trend-trading Gold on any time frame and good luck in your journey.
❤️Please, support my work with like, thank you!❤️

Falling Wedge Pattern: Cocoa FuturesThis is the map of how to trade this rare chart pattern.
This is a textbook sample of Falling Wedge continuation pattern that played out with impressive accuracy.
We have a strong uptrend in 2024 that has been changed
by a large consolidation that took place for the rest of 2024
as it has built the large Falling Wedge (continuation) pattern.
One should focus on the following crucial points and measurements:
1. breakout point where price rises above trendline resistance
it acts as a buy entry trigger (green segment)
2. stop loss - it is located below the lowest valley preceding breakout (red segment)
3. widest part of the pattern - use it to measure the distance to the target adding it to breakout point (blue arc)
4. target (yellow dashed segment)
all of above key parameters are highlighted on the chart.
It's amazing how accurately the price grew towards the target booking over 60% profit.
Next time you can use this map as a guidance.

Uptrend & Downtrend Bullish Falling Wedge Pattern TutorialA bullish falling wedge is a charting pattern that signals a potential reversal from a downtrend to an uptrend. Here's a breakdown of its key characteristics:
Shape: The pattern forms a wedge that slopes downward, with the upper trendline connecting the highs and the lower trendline connecting the lows. The key is that the highs and lows get closer together as the pattern develops.
Trend: It typically forms during a downtrend, indicating that selling pressure is decreasing.
Breakout: The pattern is bullish when the price breaks above the upper trendline. This breakout suggests that the downward trend is losing momentum, and an upward trend may follow.
Volume: During the falling wedge formation, volume tends to decrease, which supports the idea that selling pressure is diminishing.
Retest: After the breakout, it's common for the price to retest the upper trendline, and if it holds, it provides further confirmation of the bullish reversal.
Example
Imagine a stock that has been falling for several months. The price forms lower highs and lower lows, creating a narrowing wedge. Suddenly, the price breaks above the upper trendline with increased volume, signaling a potential reversal and the start of an upward trend.

Learn Best Price Action Patterns For Trend-Following Trading
In this educational articles, I will teach you the best price action patterns for Trend-Following Trading Forex.
📍Ascending & Descending Triangles
The ascending triangle will be considered to be a trend-following pattern if the impulse leg preceding the formation of the pattern is bullish.
The pattern consist of 2 main elements:
a horizontal neckline based on the equal highs,
a rising trend line based on the higher lows.
❗️The trigger is a bullish breakout of a neckline of the pattern and candle close above.
📈The position is opened on a retest.
🔴Stop loss is lying at least below the level of the last higher low.
🎯Take profit is the next historical resistance.
Look at an ascending triangle formation on EURUSD on an hourly time frame.
On the left, you can see the structure of the pattern and on the right, the trading plan.
📍The descending triangle will be considered to be a trend-following pattern if the impulse leg preceding the formation of the pattern is bearish.
The pattern consist of 2 main elements:
a horizontal neckline based on the equal lows,
a falling trend line based on the lower highs.
❗️The trigger is a bearish breakout of a neckline of the pattern and candle close below.
📉The position is opened on a retest.
🔴Stop loss is lying at least above the level of the last lower high.
🎯Take profit is the next historical support.
Above is a perfect descending triangle pattern that I spotted on GBPUSD on a 4H time frame.
📍Bullish & Bearish Wedges
The bullish wedge pattern will be considered to be a trend-following pattern if the impulse leg preceding the formation of the pattern is bullish and the pattern is directed to the downside.
The pattern consist of 2 contracting falling trend lines based on the lower lows and lower highs.
❗️The trigger is a bullish breakout of a resistance of the pattern and candle close above.
📈The position is opened on a retest.
🔴Stop loss is lying below the low of the pattern.
🎯Take profit is the high of the pattern.
Above is a falling wedge pattern that I found on GBPUSD.
The pattern is formed after a strong bullish impulse.
A trigger to buy is a bullish breakout of its resistance.
——————
The bearish wedge pattern will be considered to be a trend-following pattern if the impulse leg preceding the formation of the pattern is bearish and the pattern is directed to the upside.
The pattern consist of 2 contracting rising trend lines based on the higher highs and higher lows.
❗️The trigger is a bearish breakout of a support of the pattern and candle close below.
📉The position is opened on a retest.
🔴Stop loss is lying above the high of the pattern.
🎯Take profit is the low of the pattern.
To correctly sell this rising wedge pattern on EURUSD, we should wait for a breakout of its horizontal support and then sell the market on its retest.
📍Bullish & Bearish Flags
The bullish flag pattern will be considered to be a trend-following pattern if the impulse leg preceding the formation of the pattern is bullish and the pattern is directed to the downside.
The pattern consist of 2 parallel falling trend lines based on the lower lows and lower highs.
❗️The trigger is a bullish breakout of a resistance of the pattern and candle close above.
📈The position is opened on a retest.
🔴Stop loss is lying below the low of the pattern.
🎯Take profit is the high of the pattern.
Above, you can see a perfect example of a bullish flag pattern on EURUSD on a 4H time frame and its trading strategy.
——————
The bearish flag pattern will be considered to be a trend-following pattern if the impulse leg preceding the formation of the pattern is bearish and the pattern is directed to the upside.
The pattern consist of 2 parallel rising trend lines based on the higher highs and higher lows.
❗️The trigger is a bearish breakout of a support of the pattern and candle close below.
📉The position is opened on a retest.
🔴Stop loss is lying above the high of the pattern.
🎯Take profit is the low of the pattern.
Above is a bearish flag pattern on GBPUSD and a full plan to sell the market based on it.
📍Bullish & Bearish Symmetrical Triangles
The bullish symmetrical triangle will be considered to be a trend-following pattern if the impulse leg preceding the formation of the pattern is bullish.
The pattern consist of 2 contracting symmetrical trend lines based on the higher lows and lower highs.
❗️The trigger is a bullish breakout of a resistance of the pattern and candle close above.
📈The position is opened on a retest.
🔴Stop loss is lying at least below the last higher low of the pattern.
🎯Take profit is the high of the pattern.
This bullish symmetrical triangle on EURUSD on an hourly time frame is a perfect example of a bullish trend-following pattern.
——————
The bearish symmetrical triangle will be considered to be a trend-following pattern if the impulse leg preceding the formation of the pattern is bearish.
The pattern consist of 2 contracting symmetrical trend lines based on the higher lows and lower highs.
❗️The trigger is a bearish breakout of a support of the pattern and candle close below.
📉The position is opened on a retest.
🔴Stop loss is lying at least above the last lower high of the pattern.
🎯Take profit is the low of the pattern.
On the left chart, you can see a structure of a valid symmetrical triangle.
On the right chart, you can see how to trade it properly.
The main difficulty related to trading these patterns is their recognition. You should train your eyes to recognize them on a price chart.
Once you learn to do that, I guarantee you that you will make tons of money trading them.

Real Success Rates of the "Rising Wedge" in TradingReal Success Rates of the "Rising Wedge" in Trading
Introduction
The rising wedge, also known as the "rising wedge" in English, is a chart pattern that has a remarkable success rate in trading. This analysis details its performance, reliability and complementary indicators to optimize its use.
Success Rate and Performance
-Key Statistics
Overall success rate: 81% in bull markets
Average potential profit: 38% in an existing uptrend
-Breakout Direction
Bearish: 60% of cases
Bullish: 40% of cases
Contextual Reliability
Bull market: 81% success, average gain of 38%
After a downtrend: 51% success, average decline of 9%
Important Considerations
The rising wedge is generally a bearish pattern, indicating a potential reversal.
Reliability increases with the duration of the pattern formation.
Confirmation of the breakout by other indicators, especially volume, is crucial.
Complementary Indicators
-Volume
Gradual decrease during formation
Significant increase during breakout
-Oscillators
RSI (Relative Strength Index): Identifies overbought/oversold conditions
Stochastics: Detects price/indicator divergences
-Moving Averages
Crossovers: Signal trend changes
-Dynamic Support/Resistance: Confirm the validity of the wedge
-Momentum Indicators
MACD: Identifies price/indicator divergences
Momentum: Assesses the exhaustion of the trend
-Other Elements
Fibonacci Levels: Identify potential support/resistance
Japanese Candlestick Analysis: Provides indications of reversals
Conclusion
The rising wedge is a powerful tool for traders, offering a high success rate and significant profit potential. The combined use of complementary indicators increases the reliability of the signal and improves the accuracy of trading decisions. It is essential to look for a convergence of signals from multiple sources to minimize false signals and optimize trading performance.
_______________________________________________
Here are the best times to enter a trade after a rising wedge, in a professional manner:
-The confirmed breakout
Wait for the candle to close below the support line of the wedge.
Look for a significant increase in volume during the breakout to confirm its validity.
-The retest
Look for a pullback on the broken support line, which has become resistance.
Enter when the price rebounds downward on this new resistance, confirming the downtrend.
-The post-breakout consolidation
Identify the formation of a flag or pennant after the initial breakout.
Enter when this mini-formation breaks in the direction of the main downtrend.
-The confirmed divergences
Spot bearish divergences on oscillators such as the RSI or the MACD.
Enter when price confirms divergence by breaking a nearby support.
-Timing with Japanese Candlesticks
Identify bearish formations such as the Evening Star, Bearish Harami, or Dark Cloud.
Enter as soon as the next candle confirms the bearish pattern.
-Important Considerations
Always place a stop-loss to manage risk effectively.
Be patient and wait for the setup to be confirmed before entering the trade
Check the trend on higher timeframes to ensure the consistency of the trade.
Integrate the analysis of the rising wedge with other technical indicators to improve the quality of decisions.
By following these recommendations, traders can optimize their entries on rising wedges while minimizing the risk of false signals.

A textbook reversal signal..And if you do not know what I mean then see the linked idea below ‘the study’. Now the market cap is way to small for my interest but it might appeal to someone or indeed someone who is interested in the long game.
The reversal pattern is one we see play out time and time again in all markets. Most recently on a crypto called CFX (see example below). The psychology between buyers and sellers is very specific and is told in great detail on this particular pattern. The last 6-day candle to print on this chart informed you of the great weakness amongst sellers. This crucial.. for the moment demand returns there practically no resistance until new buyers sell into the market.
Is it possible price action falls further? Sure.
It is probable? No
Ww
Type: trade
Risk: 1%
Timeframe: now
Return: At least 500%
The study
Example
