QE is Back, Why?When he said, 'cease the balance sheet runoff,' it means the Fed plans to keep its balance sheet stable — basically, to stop their balance sheet from shrinking any further under quantitative tightening. But that doesn’t mean they’re starting quantitative easing again.
10 Year Yield Futures
Ticker: 10Y
Minimum fluctuation:
0.001 Index points (1/10th basis point per annum) = $1.00
Disclaimer:
• What presented here is not a recommendation, please consult your licensed broker.
• Our mission is to create lateral thinking skills for every investor and trader, knowing when to take a calculated risk with market uncertainty and a bolder risk when opportunity arises.
CME Real-time Market Data help identify trading set-ups in real-time and express my market views. If you have futures in your trading portfolio, you can check out on CME Group data plans available that suit your trading needs www.tradingview.com
FOMC conference transcript on 29 Oct 25 pertaining to Fed's balance sheet:
"We also decided to conclude the reduction of our aggregate securities holdings as of December 1.
At today’s meeting, the Committee also decided to conclude the reduction of our aggregate securities holdings as of December 1. Our long-stated plan has been to stop balance sheet runoff when reserves are somewhat above the level we judge consistent with ample reserve conditions. Signs have clearly emerged that we have reached that standard. In money markets, repo rates have moved up relative to our administered rates, and we have seen more notable pressures on selected dates along with more use of our standing repo facility. In addition, the effective federal funds rate has begun to move up relative to the rate of interest on reserve balances. These developments are what we expected to see as the size of our balance sheet declined and warrant today’s decision to cease runoff.
Over the 3-1/2 years that we have been shrinking our balance sheet, our securities holdings have declined by $2.2 trillion. As a share of nominal GDP, our balance sheet has fallen from 35 percent to about 21 percent. In December, we will enter the next phase of our normalization plans by holding the size of our balance sheet steady for a time while reserve balances continue to move gradually lower as other non-reserve liabilities such as currency keep growing. We will continue to allow agency securities to run off our balance sheet and will reinvest the proceeds from those securities in Treasury bills, furthering progress toward a portfolio consisting primarily of Treasury securities. This reinvestment strategy will also help move the weighted average maturity of our portfolio closer to that of the outstanding stock of Treasury securities, thus furthering the normalization of the composition of our balance sheet.
CLAIRE JONES. Can I just ask you a quick follow-up on QT? How much of the fund impressions we've seen in money markets are related to the U.S. Treasury issuing more shortterm debt?
CHAIR POWELL. That could be one of the factors, but the reality is that we've seen --the things that we've seen, higher repo rates in the federal funds rate moving up, these are the very things that we -- that we look for. We actually have a framework for looking at the place we're trying to reach. What we said for a long time now is that when we feel like we're a little bit, or a bit above what we consider a level that's ample, that we would freeze the size of the balance sheet. Of course reserves will continue to decline from that point forward, as non-reserve liabilities grow. So this happened, some of it -- some things have been happening for some time now, showing a gradual tightening in money market conditions, really in the last, call it three weeks or so, you've seen more significant tightening, and I think a clear assessment that we're at that place. The other thing is, we're -- the balance sheet is shrinking at a very, very slow pace now. We've reduced it by half twice, and so there's not a lot of benefit to be, to be holding on for it to get the last few dollars, because again, when the balance sheet -- reserves are going to continue to shrink as non-reserves grow. So there was support on the Committee, as we thought about it, to go ahead with this and announce effective December 1 that we will be freezing the size of the balance sheet. And the December 1 date gives the markets a little bit of time to adapt.
STEVE LIESMAN. Just a follow-up on the balance sheet, if you stop it, the runoff now, does that mean you have to go back to actually adding assets sometime next year so that the balance sheet doesn't shrink as a percent of GDP and become a tightening factor?
CHAIR POWELL. So, you're right, the place we'll be on December 1 is that the size of the balance sheet is frozen, and as mortgage-backed securities mature, we'll reinvest those in treasury bills, which will foster both a more treasury balance sheet, and also a shorter duration.
So that's -- in the meantime, if you freeze the size of the balance sheet, the non-reserve liabilities, currency for example, they're going to continue to grow organically and because the size of the balance sheet is frozen, you have further shrinkage in reserves. And reserves is the thing that we're -- that we're managing that has to be ample. So, that'll happen for a time, but not a tremendously long time. We don't know exactly how long, but at a certain point, you'll want to start -- you'll want to start reserves to start gradually growing to keep up with the size of the banking system and the size of the economy. So we'll be adding reserves at a certain point, and that's the last point. Even then we'll be -- we didn't make decisions about this today, but we did talk today about the composition of the balance sheet. And there's a desire that the balance sheet be -- right now it's got a lot more duration than the outstanding universe of treasury securities and we want to move to a place where we're closer to that duration. That'll take some time. We haven't made a decision about the ultimate endpoint, but we all agree that we want to move more in the direction of a balance sheet that more closely reflects the outstanding treasuries. And that means a shorter duration balance sheet. Now, this is something that's going to be -- take a long time and move very, very gradually and I don't think you'll notice it in market conditions. But that's the direction of things.
10y

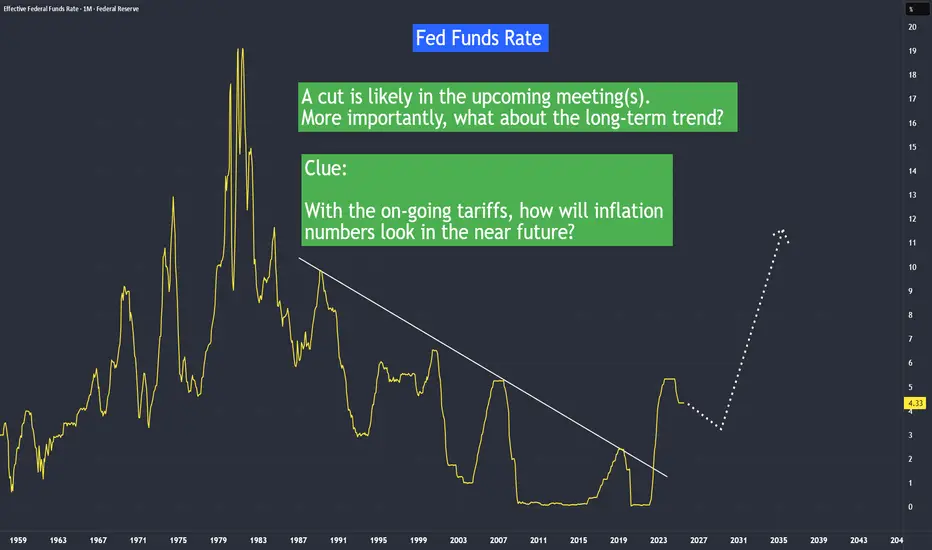
Interest Rate Projection In April, inflation was at its lowest point. It was also the month when the 'Liberation Day' tariffs were introduced, applying a 10% baseline tariff to most countries.
But it wasn’t until August—when the July Core CPI rose to 3.1% from its April low of 2.8%— and now investors began to question whether inflation will be trending higher in the near future with now higher tariffs set in after 1st August.
With a lower non farm payroll or job created the last three months, Fed has to pivot to the economy and likely to ease rates. The real challenge will be lower job numbers and higher inflation number in the coming months.
Which side will Fed pivot to?
Recession or Inflation?
10 Year Yield Futures
Ticker: 10Y
Minimum fluctuation:
0.001 Index points (1/10th basis point per annum) = $1.00
Disclaimer:
• What presented here is not a recommendation, please consult your licensed broker.
• Our mission is to create lateral thinking skills for every investor and trader, knowing when to take a calculated risk with market uncertainty and a bolder risk when opportunity arises.
CME Real-time Market Data help identify trading set-ups in real-time and express my market views. If you have futures in your trading portfolio, you can check out on CME Group data plans available that suit your trading needs tradingview.com/cme/
Tariffs Effect on InflationIn April, inflation was at its lowest point. It was also the month when the 'Liberation Day' tariffs were introduced, applying a 10% baseline tariff to most countries.
But it wasn’t until August—when the July Core CPI rose to 3.1% from its April low of 2.8%— and now investors began to question whether inflation will be trending higher in the near future with now higher tariffs set in after 1st August.
10 Year Yield Futures
Ticker: 10Y
Minimum fluctuation:
0.001 Index points (1/10th basis point per annum) = $1.00
Disclaimer:
• What presented here is not a recommendation, please consult your licensed broker.
• Our mission is to create lateral thinking skills for every investor and trader, knowing when to take a calculated risk with market uncertainty and a bolder risk when opportunity arises.
CME Real-time Market Data help identify trading set-ups in real-time and express my market views. If you have futures in your trading portfolio, you can check out on CME Group data plans available that suit your trading needs www.tradingview.com

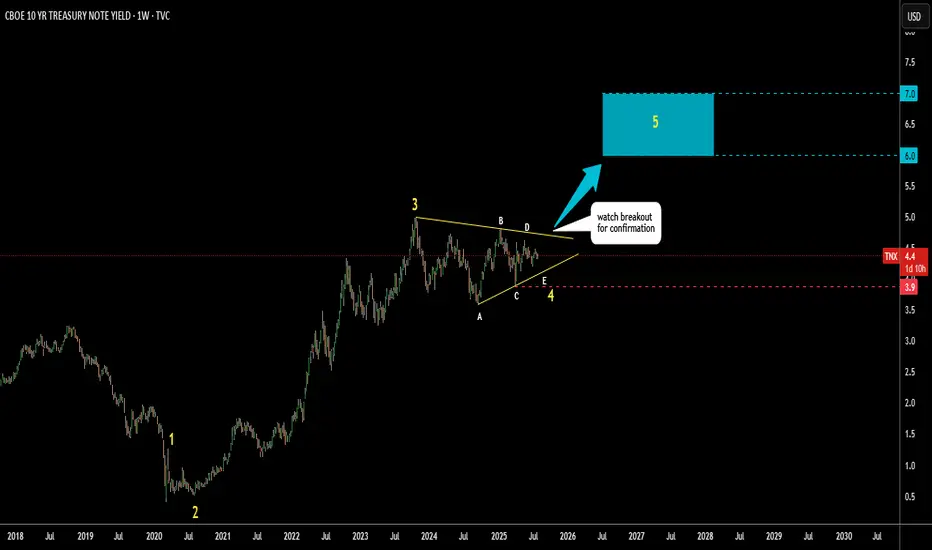
US 10Y yield: Triangular Consolidation, next 6-7%I’ve spotted a well-known triangular pattern forming on the US 10-year Treasury yield.
This appears to be the development of a large Wave 4.
Wave E of Wave 4 may still be unfolding.
Watch to see if it holds above the Wave C low at 3.9%.
A breakout above resistance near 4.7% would confirm the pattern.
The target zone is set between the 38.2% and 61.8% retracement levels of Waves 1 to 3,
highlighted with a blue box between 6% and 7%.
Could tariffs cause a major spike in yields—or will something else trigger it?
Share your thoughts in the comments below.
10Y Note Auction & Why Markets did %10 Movement with Last Data?Hello Traders tomorrow we have 10-Year Note Auction data and I wanted to prepare a nice little information for you about this topic because the data released last month showed an immediate 10% increase and from what I saw, many people had no idea what was happening.
📌 What is the 10-Year Note Auction?
The U.S. government regularly issues 10-year Treasury notes to finance its budget. The auction result reflects investor demand and long-term interest rate expectations. The yield (interest rate) that results from the auction is a key benchmark for financial markets globally.
🔄 Connection to U.S. Stocks and EUR/USD
🟢 If Demand Is Strong (Yields Stay Low):
Investors are eager to buy U.S. debt, pushing prices up and yields down.
This indicates confidence in the U.S. economy and little concern about inflation or rate hikes.
Stock markets generally react positively.
🔴 If Demand Is Weak (Yields Rise):
Investors require higher returns, possibly due to inflation fears or policy tightening expectations.
This pushes yields up, increasing borrowing costs and reducing the attractiveness of risk assets.
Stocks typically decline, and the dollar strengthens.
💱 Effect on EUR/USD
🟢 If Yields Rise:
U.S. dollar becomes more attractive due to higher returns.
Investors buy USD to invest in Treasuries.
EUR/USD typically falls.
🔴 If Yields Fall:
Lower yields reduce the appeal of the dollar.
Investors may move capital elsewhere.
EUR/USD tends to rise.
🗓️ Latest 10-Year Treasury Auction – April 9, 2025
Auction Size: $39 billion
High Yield: 4.435%
Expected (WI) Yield: 4.465%
Outcome: Strong demand – yield came in lower than expected.
📊 Post-Auction Market Reactions
🔹 10Y Treasury Yield:
Before auction: ~4.466%
After auction: Dropped to ~4.38%
➝ Reflects strong investor demand and confidence in long-term stability.
🔹 S&P 500 Index:
Lower yields reduce borrowing costs and support equity valuations.
Investors often shift toward riskier assets like stocks when yields fall.
The S&P 500 responded positively after the auction.
🔹 EUR/USD:
Falling yields reduce the dollar's relative appeal.
This may push EUR/USD higher, depending on other macroeconomic influences (like ECB policy or geopolitical risks).
✅ Conclusion
The April 9, 2025, 10-year Treasury auction showed strong demand with a yield lower than market expectations. This led to a drop in yields, a positive reaction in U.S. stock markets, and potential downward pressure on the dollar, which may support EUR/USD.

The Yield Curve is NOT InvertedLately I've been seeing a lot of people incorrectly state that the Yield Curve is currently inverted.
IT IS NOT.
Easily measurable 10Y - 2Y.
Google the definition if you need to.
I laid out the impact of the yield curve inverting against the S&P 500.
In most cases, you can see SP:SPX sells off slightly after inverting.
The higher the spread, the healthier the market is.
You want funds buying longer dated securities for market stability and confidence.

How to Track Inflation NumberHow to track inflation number?
When the Fed mentions their 2% inflation target, are they referring to the commonly published CPI that we often read about, or are they referring to Core CPI or Core PCE?
10-Year Yield Futures
Ticker: 10Y
Minimum fluctuation:
0.001 Index points (1/10th basis point per annum) = $1.00
Disclaimer:
• What presented here is not a recommendation, please consult your licensed broker.
• Our mission is to create lateral thinking skills for every investor and trader, knowing when to take a calculated risk with market uncertainty and a bolder risk when opportunity arises.
CME Real-time Market Data help identify trading set-ups in real-time and express my market views. If you have futures in your trading portfolio, you can check out on CME Group data plans available that suit your trading needs www.tradingview.com
Trading the Micro: www.cmegroup.com

DXY + 10Y TANKING = BULL MARKETAs expected, the DXY is TANKING alongside the 10Y, and the WMA9 is finally breaking below the 20.
This combo is turbo juice for markets, as it allows Central Banks around the world to stimulate and opens the door for more growth in the US economy.
Ignore asset prices.
Focus on the macro.
This is a leading indicator.
HODL.

Yield Curve Inversion Watch Chart - Fed Has To Cut!If you’re worried about a recession, you should be watching the Yield Curve Inverting.
Historically, an inversion signals a recession, but with a lag.
We can see this on the chart whenever the yield curve hits 0%
This shows the 2Y yield higher than the 10Y which is a signal that the market expects slow economic growth.
To counter-act the inversion, the Fed cuts the EFFR, although they are always late.
One would think that the Fed would learn from history, and get ahead of the curve this time around.
Only time will tell.
I’m cautiously optimistic as Treasury Secretary Bessent has stated that he has a weekly meeting with Fed Chair Powell.

Global Bonds New LowThe UK bonds have broken below the recent decades-low in the past weeks.
What has caused this turmoil? We will drill down into the specific dates that triggered this meltdown.
10-Year Yield Futures
Ticker: 10Y
Minimum fluctuation:
0.001 Index points (1/10th basis point per annum) = $1.00
Disclaimer:
• What presented here is not a recommendation, please consult your licensed broker.
• Our mission is to create lateral thinking skills for every investor and trader, knowing when to take a calculated risk with market uncertainty and a bolder risk when opportunity arises.
CME Real-time Market Data help identify trading set-ups in real-time and express my market views. If you have futures in your trading portfolio, you can check out on CME Group data plans available that suit your trading needs www.tradingview.com

Trump's Impact on Interest Rates: Higher Rates Ahead?After Trump’s decisive win on November 6th, Bitcoin, the USD, and yields (or interest rates) moved higher. In fact, these markets began moving upward in September, more than a month before Donald Trump became the 47th President of the United States.
We will study the direction of interest rates based on the actual market sentiment as reflected in U.S. bond yields.
10 Year Yield Futures
Ticker: 10Y
Minimum fluctuation:
0.001 Index points (1/10th basis point per annum) = $1.00
Disclaimer:
• What presented here is not a recommendation, please consult your licensed broker.
• Our mission is to create lateral thinking skills for every investor and trader, knowing when to take a calculated risk with market uncertainty and a bolder risk when opportunity arises.
CME Real-time Market Data help identify trading set-ups in real-time and express my market views. If you have futures in your trading portfolio, you can check out on CME Group data plans available that suit your trading needs www.tradingview.com

Lower inflation do not mean things will become cheaperLower inflation and interest rates do not necessarily mean that prices will decrease. If I annualize the inflation numbers instead of focusing on the monthly figures, the overall picture becomes much clearer.
2 and 10 Year Yield Futures
Ticker: 2YY, 10Y
Minimum fluctuation:
0.001 Index points (1/10th basis point per annum) = $1.00
Disclaimer:
• What presented here is not a recommendation, please consult your licensed broker.
• Our mission is to create lateral thinking skills for every investor and trader, knowing when to take a calculated risk with market uncertainty and a bolder risk when opportunity arises.
CME Real-time Market Data help identify trading set-ups in real-time and express my market views. If you have futures in your trading portfolio, you can check out on CME Group data plans available that suit your trading needs www.tradingview.com

Inverted Yield of 2022 Explained - Till TodayFor our housing loan, many of us, if you are in your 30s today and all the way to 70 years of age, will likely have chosen floating or short-term loan rates rather than longer-term loan rates. However, everything changed in 2022. Now, we are more likely to choose longer-term loan rates over floating rates. Why? Because today, longer-term loan rates are lower than floating rates.
This phenomenon is called an inverted yield curve.
In the 70s and 80s, there was also a period of inverted yields, and different markets moved accordingly as expected. Today, we are seeing an inverted yield once again, and the same markets are moving in a manner similar to those in the 70s and 80s.
We will do a comparison between the 70s and today’s inverted yield. Please let me know what opportunities you see after this tutorial.
2 Year Yield Futures
Ticker: 2YY
Minimum fluctuation:
0.001 Index points (1/10th basis point per annum) = $1.00
10 Year Yield Futures
Ticker: 10Y
Minimum fluctuation:
0.001 Index points (1/10th basis point per annum) = $1.00
Disclaimer:
• What presented here is not a recommendation, please consult your licensed broker.
• Our mission is to create lateral thinking skills for every investor and trader, knowing when to take a calculated risk with market uncertainty and a bolder risk when opportunity arises.
CME Real-time Market Data help identify trading set-ups in real-time and express my market views. If you have futures in your trading portfolio, you can check out on CME Group data plans available that suit your trading needs www.tradingview.com

The future of Interest RatesRough map pf rate expectation without pretension of accuracy for dates nor timing...

Interest Rate Cuts 3 Times This Year May Not Happen - Here's WhyMany interpreted from the latest FOMC meeting that the Fed is going to have three rate cuts this year, but Jerome Powell did not say that.
Let me quote directly from his transcript:
“If the economy evolves as projected, the median participant projects that the appropriate level of the federal funds rate will be 4.6 percent at the end of this year”
And he added:
“These projections are not a committee decision or plan”
In today’s tutorial we will discover why so many of us got it wrong in what he is trying to tell us.
And who are these participants?
10-Year Yield Futures
Ticker: 10Y
Minimum fluctuation:
0.001 Index points (1/10th basis point per annum) = $1.00
Disclaimer:
• What presented here is not a recommendation, please consult your licensed broker.
• Our mission is to create lateral thinking skills for every investor and trader, knowing when to take a calculated risk with market uncertainty and a bolder risk when opportunity arises.
CME Real-time Market Data help identify trading set-ups in real-time and express my market views. If you have futures in your trading portfolio, you can check out on CME Group data plans available that suit your trading needs www.tradingview.com

Why Central Banks Buying Gold & Institutions Hedging the Yields?While many of us celebrate the stock markets reaching new highs, central banks worldwide are actively purchasing gold, and institutions are hedging into treasuries and yields.
Interest rates are determined by the central banks whereas Yields are determined by the investors.
If you choose to lend or borrow money over a longer period, such as 10 or 30 years, you would typically expect to earn or pay more interest for this extended duration loan contract. However, currently, we are witnessing an inversion of this relationship, known as the inverted yield curve, where borrowers are required to pay higher interest on their short-term loans, such as the 2-year yield we're observing, compared to their longer-term borrowing.
2 Year Yield Futures
Ticker: 2YY
Minimum fluctuation:
0.001 Index points (1/10th basis point per annum) = $1.00
Disclaimer:
• What presented here is not a recommendation, please consult your licensed broker.
• Our mission is to create lateral thinking skills for every investor and trader, knowing when to take a calculated risk with market uncertainty and a bolder risk when opportunity arises.

Why are bonds falling today?I noticed a large waterfall sell off of both 2year and 10year. What was reason behind such a volatile move?

US 10Year - US03MO - Yield Inversion (Posted 01FEB23)In this chart you can see how inverted we are and for how long on the 10-3mo. I also have the 10-2YR chart that I will link to this also. This is a recession indicator. It will be interesting to follow this chart as the FOMC tries to bring the curve back under control. I will return frequently to run the "Play" and see how they do over the months!

BRIEFING Week #45 : Still some Incertainty in the short-termHere's your weekly update ! Brought to you each weekend with years of track-record history..
Don't forget to hit the like/follow button if you feel like this post deserves it ;)
That's the best way to support me and help pushing this content to other users.
Kindly,
Phil

$US10Y 10 Year Bonds Key Levels, Analysis and Targets $US10Y Key Levels, Analysis and Targets
Oh my goodness… 10 year bonds are breaking out on the monthly for the first time in 30 years… This is epic…. Equities are so screwed… I never thought that I would be saying that the bond market looks interesting... LOL... 🤷🏻♀️

Short Micro 10 Year Futures
*ACTUAL REAL LIVE TRADE I’M IN*
Another interesting setup tonight. Shorting the Micro 10 year futures.

US 10 YEAR BOND US 02 YEAR BOND US10YAlarm in the markets: a part of the US interest rate curve is inverted that has not been in 16 years
US five-year bond yields rose as much as 10 basis points to touch 2.64%, outperforming those on 30-year bonds.
Receive a cordial greeting, In Spain on 03/30/2022.
Sincerely, L.E.D.

US10y Follow UpFollow up w fib ma on US 10 looking at it back from 1981...
Trend line is still very much in tact - I know michael burry is short yields
