BTC CRITICAL: Bear Flag Breakdown! Next Stop $73k?Technical Analysis: Bitcoin (BTC) Bear Flag Breakdown
We are witnessing a textbook Bear Flag formation on the daily chart, and the breakdown is currently in progress.
The Setup:
The Pole: We saw a sharp, impulsive move down from the highs (approx. $126k) to the $90k region. This heavy selling pressure established the "flagpole."
The Flag: For the last few months, price has consolidated in a rising parallel channel (marked in blue). This counter-trend bounce is typical exhaustion from sellers and profit-taking, not a true reversal.
The Breakdown: As seen on the current candle, BTC has sliced through the bottom support line of this rising channel. This confirms the pattern is active.
The Scenario (Blue Arrows):
We are now entering the Break & Retest phase.
Step 1: The price breaks the channel support (Happening now).
Step 2: We may see a short-term bounce or "relief rally" to retest the broken trendline as resistance (the "Kiss of Death"). This is represented by the small upward blue arrow.
Step 3: If the retest is rejected, the measured move suggests a continuation of the downtrend.
Targets:
Immediate Target: The structural support around $80,000 .
Primary Target: The yellow horizontal line on the chart at $73,579 . This aligns with previous major structural support/resistance zones.
Invalidation:
This bearish outlook is invalidated if the price reclaims the channel and closes back inside the blue parallel lines above $94k.
What do you think? Is this the start of the next leg down, or will bulls step in at $80k?
Let me know in the comments! 👇
Bearish Flag

EU Bears Flag Lower PricesAs last week came to a close, FX:EURUSD delivered a Bearish Breakout of the Ascending Channel after price made a 50% Retracement of the High to Low, signaling the end of the Consolidation Phase, where we can recognize this as a Bearish Continuation pattern, the Bear Flag!
Now the Breakout last week was followed by:
1) Massive increase in Volume
2) RSI Below 50
3) MACD Crossover Event and Red Histogram Bars (Suggesting Selling Pressure entering)
Now all that is left is for a Retest of the Breakout of the Support to verify it is a good Resistance now to generate Short opportunities!
If the Retest is Successful, we could see price fall to the next area of Support made clear in late November last year from 1.15525 - 1.15351.
The Flagpole Extension being the Price Target after the Flag is formed also puts our expectation of price to fall here strengthening the case.
Fundamentally EUR and USD have a busy news filled week so stay vigilant!

Bearish Flag in stable coin dominanceStable coin bearish flag pattern in USDT and USDC dominance combination. Do you agree or not?

Alert: Bitcoin Price Charts Bear Flag Bitcoin follows the downward path posted earlier on the weekly chart (see related)
The falling knife accelerated after price broke below $100k as it swiftly hit the 80k level and stopped there just ahead of the next viable support at $74k
The price is now within a pink downtrend channel as RSI turned bearish below the 50 reading
Every strong move is followed by corrective price action
So the price bounced off the $80k and is now in a sideways consolidation
This is how the Bear Flag pattern has formed (white lines)
I think one more minor leg up is likely to complete the corrective structure
Watch for a breakdown of the flag’s downside to target the distance of the flagpole below
This aligns with both the downside of the descending channel and the $64k strong support
As I checked, MicroStrategy’s (MSTR) BTC cost basis is around $66k
Watch RSI as it should remain bearish below 50 to support the drop

$RDDT – Larger Head & Shoulders + Bear Flag = Trouble AheadReddit ( NYSE:RDDT ) is showing a bigger-picture head & shoulders pattern combined with a near-term bear flag, and the downside risk is real if the market continues to weaken — especially if NASDAQ:NVDA disappoints on earnings.
🔹 The Bigger Structure:
Head: The peak around $280
Right Shoulder: Forming around $230
This entire pattern is stretched over months — a structural topping pattern with heavy implications.
🔹 Near-Term Structure:
Between $180–$190, NYSE:RDDT is building a tight bear flag.
This is exactly the kind of setup that resolves to the downside when market sentiment turns.
🔹 Downside Levels:
First real support sits around $202, and that’s where sellers likely target first.
A breakdown of the flag could send it there quickly, especially in a risk-off tape.
🔹 Macro Risk:
If NASDAQ:NVDA misses earnings, this market is sitting on a cliff.
Momentum names and high-beta IPOs like NYSE:RDDT tend to get hit the hardest when liquidity dries up.
Combine macro weakness + a topping pattern + a bear flag… and you have a real setup for further downside.
🔹 My Trade View:
1️⃣ Bias: Bearish while under the 9 EMA.
2️⃣ Trigger: Breakdown under the bear flag ($180–$190 zone).
3️⃣ Target: $202 first, and potentially lower depending on market conditions.
4️⃣ Stop: Above the flag highs / 9 EMA.
Why This Matters:
You don’t often see a multi-month topping pattern line up cleanly with a short-term continuation short setup.
NYSE:RDDT has room to fall if the broader market unwinds.
This is one of the cleanest momentum breakdown candidates on the board.

Downfall of DXY?!? Bears Flag The Possibility!Here on TVC:DXY we can see that last week it ended in a Bearish Breakout of an Ascending Channel, the perfect Bear Flag scenario!
Now price closed the week on the ascent possibly being the Retest of the Breakout.
If the Channel holds price on a successful retest, TVC:DXY will drop!
Fundamentally, USD has impactful news all week this week. Even so, with limited data from back logged events not available until after next FOMC Meeting, this means the Federal Reserve will continue to make decisions in "the dark" and with a high probability of a Rate Cut coming in December!
If the Bear Flag is successful in being a continuation pattern set-up, we could see price drop down to the prior Low of November under 99!

GBPAUD A perfect Bearish Flag A bearish flag is a technical analysis pattern in trading that indicates a potential continuation of a downtrend. It's characterized by:
Key Features1. Downtrend: A prior downward trend in price.
2. Flag formation: A consolidation period with a slight upward trend, forming a flag shape.
3. Volume: Typically, volume decreases during the flag formation.
Interpretation1. Bearish signal: The bearish flag suggests the downtrend is likely to continue.
2. Breakout: A break below the flag's support level can confirm the continuation of the downtrend.
Trading Strategies1. Short selling: Traders may consider short selling after a break below the flag's support level.
2. Stop-loss: Setting a stop-loss above the flag's resistance level can help limit losses.
Important Notes1. Confirmation: Wait for confirmation of the breakout before entering a trade.
2. Risk management: Always use proper risk management techniques.
⚠️ Disclaimer:
This setup is shared for educational purposes only. It is not financial advice. Always do your own analysis and apply proper risk management before trading any setup.

XAUUSD📊 XAUUSD (GOLD) – 1H Timeframe Analysis
Structure Update:
A clear Double Top has formed near the recent highs, signaling potential exhaustion after 9 weeks of continuous bullish momentum.
Price is now consolidating within a Bearish Flag, suggesting a pause before possible continuation to the downside.
📉 Outlook:
Correction looks imminent as buying momentum weakens and sellers begin to show presence near resistance.
Watch for a bearish candle confirmation and breakdown below the flag’s lower boundary to validate a short setup.
🎯 Trading Plan:
Bias: Bearish (short-term correction)
Trigger: Breakdown and close below flag support
Risk–Reward: Follow proper RR discipline
Invalidation: Break and close above flag resistance or double-top high

NZD_CHF BEARISH FLAG|SHORT|
✅NZD_CHF is trading in a
Downtrend and the pair formed
A bearish flag pattern so IF we
See a bearish breakout then we
Will be expecting a further
Bearish continuation and
A move down
SHORT🔥
✅Like and subscribe to never miss a new idea!✅

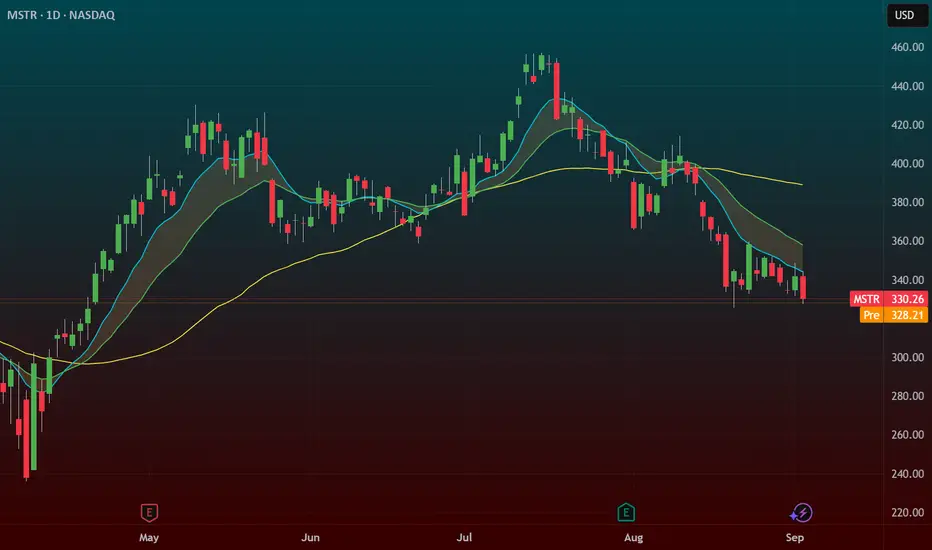
$MSTR – Bear Flag Breakdown SetupNASDAQ:MSTR – Bear Flag Triggering Despite Crypto Strength
MicroStrategy ( NASDAQ:MSTR ) has been drifting lower even as crypto has ripped the last few months — a clear sign of relative weakness. Every rally attempt has been faded, and now the chart is setting up a clean bear flag breakdown.
🔹 The Setup:
Price is pressing the $326 trigger level on a bear flag structure.
A breakdown here opens the door to $300 for the first cover zone.
Weak price action despite a strong sector = bearish divergence.
🔹 Market Context:
The NASDAQ:QQQ is flashing distribution signals — failed breakouts in momentum names and heavy selling under the surface.
If indexes continue to weaken, NASDAQ:MSTR could accelerate to the downside as speculative money comes out.
🔹 My Trade Plan:
1️⃣ Entry: Short on breakdown through $326.
2️⃣ Target: First covers into $300.
3️⃣ Stop: Above the flag highs — no need to fight if it reverses.
Why I Like This Setup:
Relative weakness vs. crypto = red flag for bulls.
Bear flag structure + clear trigger + defined target.
Broader market weakness adds conviction.
ETHUSD🔎 Chart Setup
ETH/USD 1H → Bearish flag = continuation pattern AB=CD
ETH Dominance (D) → Also breaking flag = confirms weakness in ETH vs other alts/majors
📊 Trade Plan
⚠️ Manage risk strictly (crypto volatility is brutal):
Entry: On breakdown retest of the flag support line 🟥
Stop Loss (SL): Just above flag resistance
rofit (TP):
🎯 TP1 (1:1 RR) → Secure partial profits (50% book)
🎯 TP2 (1:2 RR) → Let rest run, trail SL
💡 Risk Management
Max 1%–2% account risk per trade ⚖️
Always use hard stop, don’t widen 🚫
Partial booking keeps you safe + confident 🛡️

EURAUD – Bearish Flag Breakdown OpportunityThe EURAUD pair is showing signs of trend continuation via a classic bearish flag pattern formation. After a sharp decline, the market has entered into a tight consolidation channel, climbing steadily inside a sloped flag structure. Price is now testing a critical resistance area near 1.7830–1.7840 while hovering just below the 200 EMA.
This setup offers a high-probability sell opportunity — but only after confirmation.
1. Structure Overview
The initial sharp downtrend is followed by a consolidation channel — a textbook bearish flag.
Price is approaching major resistance (1.7830–1.7840) and 200 EMA, acting as a ceiling.
A breakdown from the rising support of the flag is expected to trigger a continuation toward the downside.
2. Trade Plan – Bearish Flag Breakdown
✅ Entry Plan:
Wait for a breakdown of the green support trendline (flag support).
Then, wait for a re-test of the broken support (now resistance).
Enter short only after a bearish candlestick confirmation (e.g., bearish engulfing or rejection wick) on the 15-min or 1-hour chart.
🛡️ Stop Loss:
Place the stop loss just above the major resistance zone, around 1.7835–1.7840.
🎯 Target Zones:
Target 1 (TG1): 1.7755
Target 2 (TG2): 1.7718
Final Target: 1.7632
Risk/Reward Ratio: 1:2, 1:4, 1:9.4+
3. Why This Trade Makes Sense
Bearish Flag is a reliable continuation pattern in strong downtrends.
Price is failing to break above key resistance and 200 EMA.
The flag offers a tight SL and large downside potential — ideal conditions for R:R setups.
Confluence of structure, pattern, and trend all align for short bias.
4. Trade Management Tips
Scale out partial profits at TG1 and TG2, and trail stop for final target.
If breakdown fails, avoid chasing price — re-evaluate bias if price breaks above 1.7840.
5. Final Thoughts
This EURAUD chart is a textbook case of pattern + price action + resistance confluence. The flag structure is well-defined, and the reward-to-risk ratio is significantly favorable if the breakdown confirms.
📌 Watch for:
Breakdown of rising support
Retest and bearish candle
Entry only on confirmation
High-probability setups don’t require prediction — they require preparation.
=================================================================
Disclosure: I am part of Trade Nation's Influencer program and receive a monthly fee for using their TradingView charts in my analysis.
=================================================================

GBPUSD bearish continuation for expect
FX:GBPUSD strong bearish pushing, we can see BEARISH FLAG pat and trend line breaked, here still strong bearish to expect till TPs.
SUP zone: 1.35500
RES zone: 1.33850, 1.33400

USD-CHF Bearish Flag! Sell!
Hello,Traders!
USD-CHF is trading in a
Downtrend and the pair broke
Out of the bearish flag so
We are bearish biased
And we will be expecting
A further bearish move down
Sell!
Comment and subscribe to help us grow!
Check out other forecasts below too!
Disclosure: I am part of Trade Nation's Influencer program and receive a monthly fee for using their TradingView charts in my analysis.

Nifty is Bearish for next week. But Why ? "Ask me in comments".Nifty is facing resistance at this level for a specific reason. this week it can be bearish and continue to go down side.

XRPUSDBearish Flag valid , Instant entry! Plan shared in chart EP SL TP
Open two trades tp1 1:1, tp2 1:1.5

$XAU Showing Bearish Flag Pattearn & Dropped $3K Support area...TVC:XAU Showing Bearish Flag Pattearn & Dropped $3K Support area. Price dropping now and back to $3K price level area. price FVG touch and Strong support $3K Price Level area. Here is many support Holder.
Stoploss: $3,536
Entry: $3,377
1st Target point $3,377
2nd Target point $3,249
3rd Target point $3,028
Disclaimer: This article is for informational purposes only and does not constitute financial advice. Always conduct your own research before making any investment decisions. Digital asset prices are subject to high market risk and price volatility. The value of your investment may go down or up, and you may not get back the amount invested. You are solely responsible for your investment decisions and Binance is not available for any losses you may incur. Past performance is not a reliable predictor of future performance. You should only invest in products you are familiar with and where you understand the risks. You should carefully consider your investment experience, financial situation, investment objectives and risk tolerance and consult an independent financial adviser prior to making any investment.


$Btc Bearish Flat Pattern Forming?Bitcoin Bearish Flat Pattern Forming? Potential Short Setup to $97K-$98K if Rejected at $106K
📉 BTC recently hit a new all-time high around $112K, followed by a series of higher lows near $110K, $108K, and potentially $106K. If price gets rejected at $106K, a bearish flat pattern may play out—triggering a high-probability short opportunity toward the $97K–$98K support zone. However, a clean breakout above $107K will invalidate this setup.

AUDJPY higher bearish for expect
OANDA:AUDJPY interesting structure, trend line is breaked and we can see bearish flag also is breaked.
Currently here expecting to see higher fall.
SUP zone: 93.600
RES zone: 91.500, 90.600

EURCAD no3 view, bearish continuation still to expect
OANDA:EURCAD last two analysis on EURCAD doing, going good, will be attached, having now one more update and new view.
Price at end is break RAISING WEDGE and BEARISH FLAG, pushing strong bearish, strong volumem and momentum is gathered and still here having strong bearish expectations.
SUP zone: 1.57200
RES zone: 1.53000, 1.51600

EURUSD update and new bearish view
FX:EURUSD one more view on EU, we can see long zone and break of same how currently looks, two bounce on sup zone 1.13500, price now pushing till crucial zone 1.12700, if we see break here we will have confirm.
Currently how everything looks, its expected to see stronger fall here.
SUP zone: 1.14000
RES zone: 1.11700, 1.11200

$TOTAL Crypto Market Cap BULL TRAP AlertBULL TRAP 🚨
New money has been coming into the market as shown on the Crypto CRYPTOCAP:TOTAL Market Cap, hence why you haven’t seen “rotations” in coins, but it appears to be drying up.
There’s been major resistance at the 200DMA, which is just below the previous ATH at $3T, and PA is being squeezed between the 9DMA.
Combine this with a heated RSI, it appears to be a bear flag in the making.
The trendline from Oct. ’23 gives confluence with the 50DMA as support.
*The only savior I see at this point is price smashing through the 200DMA and flipping support into the green accumulation box.
Regardless, this move is coming to an end later this week to test support or breakout.
Again, I’ll reconfirm my stance that this is the most obvious bull trap I’ve seen all cycle. Although I hope to be wrong 🥲
Having said that, after support is confirmed on the move, we are going to VALHALLA 🚀
Bookmark this 🤓
