TSLA - $37 Billion in Options Expire Friday~ $ 130 Billion in Options which have a significant number of Leap Calls
deep in the money are set to expire on Friday.
TSLA APPL MSFT FB all share an outsized Leap Call Position.
We will see Volatility Roll/Settle Tuesday - Wednesday.
________________________________________________________________
This will be the most dangerous and Volatile week of the year for 2022.
Ranges have the Potential to expand wildly, If not this Week, then the
following week.
Calloptions

XPEVXPEV in uptrend forming higher high and higher lows.
Took hit today due to overall market pull back.
Believe good opp. for entry/calls or writing Puts....
Disclaimer - Please do your own DD before opening any positions. I have calls on this play and looking for ~50-60% quick return.

AMD Calls/Puts: Levels to watch this weekAMD
TLDR:
Calls above 151.84
SL @ 150.16
Scale out 153.29-156.25
Puts below 139.87
SL @ 141.37
Scale out 136.34 -130.53
Mon Jan 03 2022
Currently above its 12 and 26 EMA
Today it recaptured the 12 EMA
the 12 EMA just crossed over the 26 EMA
Currently Above its 20 MA
MACD strengthening
SO is not too hot: <80 and K% just crossed D%
Latest news:
Goldman Sachs analyst Toshiya Hari has a price target of 170(updated)
Samsung teases the Galaxy S22’s AMD GPU as renders leak: arstechnica.com
AMD CEO Teases Rembrandt 6nm APU Ahead of CES 2022 www.tomshardware.com
Options chain activity:
Mon Jan 03 2022
AMD open/close - $145.14 / $150.24 3.52%
Call VOL - 390,469
Put VOL - 168,670
Call VOL% - 69.83%
Call Prem % - 76.29%
Bullish Prem % - 58.24%
Put/Call Ratio - 0.43
AVG 30D PUT VOLUME
MON JAN 03 2022
190.6K
AVG 30D CALL VOLUME
MON JAN 03 2022
374.4K
TOTAL OI
MON JAN 03 2022
3.5M - Call
1.7M Put 1.8M
Highest OI Increase
Option Prev day Vol Prev day OI Curr OI Change
AMD 2022-1-21 C $125.00 5,163 14,194 18,906 4,712 (33.20%)
AMD 2022-1-7 C $150.00 17,449 8,140 11,159 3,019 (37.09%)
AMD 2022-1-14 C $160.00 3,581 2,433 4,884 2,451 (100.74%)
AMD 2022-1-7 C $144.00 3,442 456 2,731 2,275 (498.90%)
AMD 2022-1-7 C $170.00 3,401 4,280 6,521 2,241 (52.36%)
Most active chains
Chain Bid-Ask Low-High Volume OI
AMD 2022-01-07 C $150.00 $3.55-$3.65 $1.72-$4.48 49,396 11,159
AMD 2022-01-07 C $155.00 $1.83-$1.85 $0.82-$2.37 35,928 13,364
AMD 2022-01-07 C $152.50 $2.59-$2.62 $1.20-$3.30 25,857 6,158
AMD 2022-01-07 C $160.00 $0.87-$0.91 $0.42-$1.21 17,579 11,704
AMD 2022-01-21 C $155.00 $4.55-$4.65 $2.93-$5.40 13,710 35,837
AMD 2022-01-07 C $148.00 $4.55-$4.75 $2.31-$5.63 12,984 3,971
AMD 2022-01-21 C $175.00 $0.96-$0.99 $0.64-$1.23 12,244 17,862
AMD 2022-01-21 C $200.00 $0.19-$0.22 $0.15-$0.27 12,161 20,252
AMD 2022-01-07 P $145.00 $1.29-$1.33 $1.15-$3.18 12,051 5,219
AMD 2022-03-18 C $135.00 $22.20-$22.70 $19.45-$23.45 10,140 2,422
AMD 2022-01-07 C $157.50 $1.24-$1.30 $0.58-$1.70 9,205 4,431
AMD 2022-01-07 C $149.00 $4.05-$4.15 $2.01-$5.05 9,034 2,194
AMD 2022-01-21 C $165.00 $2.09-$2.15 $1.32-$2.56 9,013 23,327
AMD 2022-01-21 C $150.00 $6.60-$6.70 $4.40-$7.60 8,930 46,924
AMD 2022-01-07 P $150.00 $3.25-$3.40 $2.88-$6.10 8,795 3,513
Biggest option trades
Ticker Side Strike C/P Expiry Bid-Ask- Spot Size Prem OI Vol
AMD BUY 135 call 2022-03-18 $23.25 - $23.50, $23.45 10,000 $23.5M 2.4K 10K
AMD BUY 170 put 2022-03-18 $26.30 - $26.45, $26.40 468 $1.2M 913 503
AMD BUY 180 put 2022-02-18 $34.20 - $35.20, $34.76 325 $1.1M 701 325
AMD SELL 175 put 2022-02-18 $30.40 - $30.60, $30.46 325 $990K 1.6K 325
AMD SELL 175 call 2022-01-21 $1.06 - $1.09, $1.06 8,558 $907K 17.9K 10.6k

DMAC long strategyA analysis of DMAC in a multi-year chart run to see if market downward pressure is substantial enough overshadow the upcoming catalyst for DMAC in the coming weeks.

ANIX TREND PREDICTIONA multi-year trend analysis to see if upcoming catalyst will push upward momentum past current resistance highs.

ACER Tech AnalysisAcer has upcoming catalyst to drive upward momentum in a down market for a stock that has resisted market suppression but has reacted to individualized new and rumors.

Big Upcoming Earnings PlaySupport line is touched 7 times in 7 days and did not break once. Earnings Suprise of 51%. Trading day before earnings were released, we saw a rise and then we hit the weekend. October 4th opened 38.25 and sold off to the 30.90 zone but last candle of the day was a doji formed a support. The 5th rolled around, and we had a green candle that ate the last 3 red candles. It wasn't until the 6th that we saw a huge uptrend. Trend arrow straight from rise on the 6th to the top of resistance on the third line was tested once and bounced and the second time it tested it formed a support that touched 6 times until we saw a surge to a high of 44.45 and then saw a sell off. Same support line as day of earnings. Key reversal as we near upcoming earnings-11 days out. With big surprises from the last 4 quarters TTM if we see in the next 11 days pass the 38.98 and form a new support then we saw stock price growth from last quarter putting us in a good zone for stock to pass or near new high from the 44 zone. My buy point for calls is going to be after earnings due to prior earnings sell off same day at end market if there is a big Suprise I will but towards close of day
following trend of last earnings report. Last 3 earning dates we saw after hour earnings of high surprises, and they seem to pop big after the dip of end day earnings report backing my buy point.
-LETS ALL START OFF ON A GOOD NEW YEAR> YOU WILL ALL BE MILLIONARIES-THIS IS YOUR YEAR> EARNINGS REPORT IS JANUARY 4TH BUY POINT IS JAN 5TH RIDE AROUND 3-12 DAYS

#MSFT perfect dip buying opportunity Microsoft as you see in the chart was clearly affected by the wild week we had of trading this past week but it has presented us with a perfect dip buy opportunity if you notice the last candle in the chart has a super long wick on the bottom side showing us that although sellers are in control buyers are rejecting lower prices plus we also are getting a nice bounce off the cloud ema. Part of this dip has to do with the pull back the market had but also the CEO selling a significant amount of shares but either way i still see #MSFT having a 4 in the front of it in the near future.

#M Cup & Handle incomingGoing through my morning charting on trading view and i remember seeing #M on unusual whales pop up frequently and i glanced at the chart almost moved on to the next play and literally did a double look, but a cup is fully formed perfect on the one year one day and one year one week chart as you see in the image. It will be interesting to see if we can put a couple red days together this week to form the handle will be putting in some trades for mid Dec. to help myself with the Theta and to see if this comes to fruition it will be cheaper to pick up contracts on pull back days either way. Also their ecommerce business is also coming along form what i had read recently in either case this def makes for a play to go in your watch list, Fed is also supposed to make an announcement today which when that normally happens we have VERY RED days so i guess as they say the STARS ARE ALIGNING lol.

SNAP - opportunity for some nice gainsBack when SNAP reporting earnings and had the miss due to the change in policy by APPLE with limiting how SNAP could market to it's clients i thought it was an extreme over reaction as the price literally fell off a cliff when i went digging into unusual whales i found very large call option bets placed out for end of NOV exp which seemed like they placed those options trades to collect premium only, as it was a multi leg strategy it also had very bullish call options included with some of the premium amount for a total option contracts totaling 1.3 million i tweeted out the chart weeks back stating i felt the price would remain in the colored box until those options expired so they could collect the premium and we would potentially see a jump back in the price action looks like we are closely approaching this coming to fruition, def should be a play to keep in your watch list

INTC - Possible Good Entry PointI recently made a video on #INTC as when looking at the chart showed very good patterns, 1 being every NOV -DEC has a consolidation period followed by a nice run usually ending in MARCH - APRIL with only one exception to that 2020 ( covid dip ) over the last 5 years, this year it has once again shown a consolidation period or dip in the price action actually getting very close to approaching a strong trend line which as acted as a support going as far back as 2013 in the chart with only 2 false breaks but for the most part holding up great. I will be looking to see if it does get closer to approaching that support line to enter a position with shares and options for MAR APR MAY expiration as that has also shown to repeat in the charts as being the point where the price starts to dip once again.

11/19 Watchlist #2 - $SHOP $1700, $1720 C *SCALP* $SHOP $1700 Calls 11/19 *SCALP*
Plan:
Scalp (1-10 minute trade)
Enter $SHOP $1700 C
Exit at $1718
Price targets: $1718, $1720, $1740
Technical Analysis:
Bull flag breakout
Bounce off hourly pivot

11/19 Watchlist #1 - $AMZN BOUNCE/BREAKOUT LEVELS Bounce levels: $3655, $3684
Breakout levels: $3705, $3720

$LCID $50 C 11/26 *SWING*$LCID +$50 C 11/26 *SWING*
will be holding this position for a few days
Price targets: $50, $51
Technical Analysis:
Break over hourly supply
C = calls
17k open interest on LCID $50 C 11/26 C
23k open interest on LCID $51 11/26 C

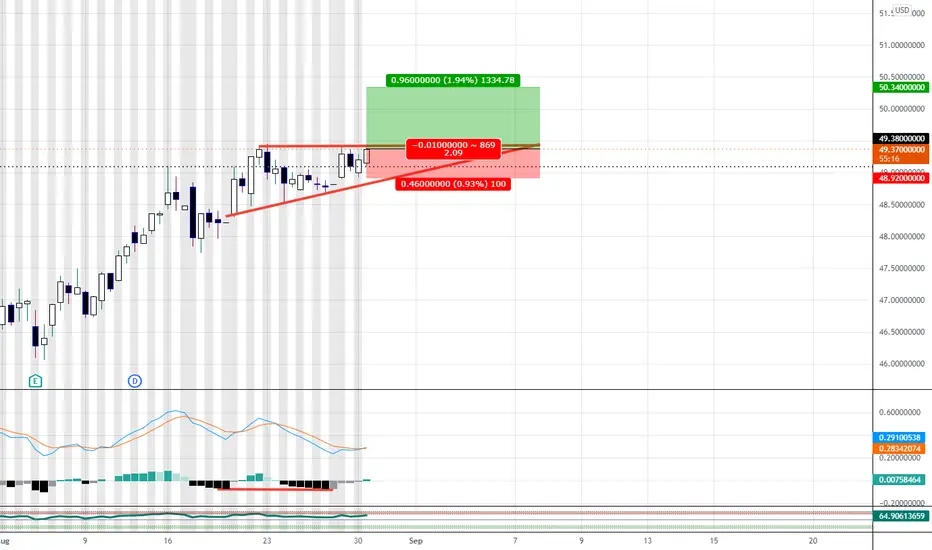
this is my idea in tesla short termim in with some call options.
i look like tsla want retest std dev at 800 $.
lets see :)

OCGN gearing for an up moveOCGN is gearing up for an up move. Daily TF shows horizontal range has been broken by insiders.
first pt $12
2nd pt $14

EA strong amongst the overblown fudTreasury yields pulled the entire market down except for EA. The lone soldier looking strong. Chart looks great on the weekly. Last candle had a long lower shadow at support. This weeks candle is an engulfing candle. Barring the market being a bigger turd than it already is, EA should move back to the $140 range by the end of next week.
The idea that treasury yields rising can bring an entire market down is ridiculous. I'd rather own a high yield dividend stock. I'm not buying into the B.S. The market will move higher. Loading 10/8 EA calls at open.

$PFE RSI bullish divergenceStill swinging Pfizer calls. Bullish divergence on RSI indicator 1HR
Still holding longer term uptrend.
Mid October - NOV 45Cs as an idea or credit spread 45/40P
Break below black line invalidates trade idea

$XLE bounce with cheap OTM callsEnergy was the stand out sector today up 3.74% on good volume.. as we mentioned a few days ago it looks to have confirmed a double bottom and being the cheapest sector on a fwd p/e and price/book basis it’s a contrarian and catch up play some major players are getting into.. more to come here.. some upside OTM calls IVs are cheaper than ATM and HV..

Watchlist AMAT for a possible call: with TAOverall idea: If AMAT breaks 133.51, calls with a PT to 141.50 will be a go. (SL at 129.90)
TA:
~Accumulation/Distribution line is sharply increasing, foreshadowing a strong incoming bull action
~MACD has just crossed over into the positive, hinting at upcoming bull action
~VI is at an intersection point, foreshadowing a reversal in momentum from its previous bear action
~RSI is at 50, giving it room to go either direction without much fear of being overbought/oversold
~ so far there have been two rejections of the 50 EMA since August 10. We are rapidly approaching a third test of this 50 EMA, which is also at the point where AMAT would need to go to break resistance. Put the two together, if 133.51 is broken, we not only would see a break of resistance, but also a cross over the 50 ema after a bounce off the long term support line.
Also want to point out the obvious: the wedge that is forming long time frame.

SPCE about to take off!! Buy buy buyCycles analysis indicates we have reached the bottom on SPCE. Purchasing 35$ calls now for 9/17 for target share price at 40-42$
Long term buy target is 125.00

$ZYNGA buy of a lifetimeExtremely oversold. $9 by December. loading up on calls slowly in august. im even buying stock.
