Macro Alert: The Stealth Flight 2 Alts (Tariffs, Gold & Privacy)🚨 MACRO ALERT: The Silent Surge — Altcoins Accumulating Undetected Since April
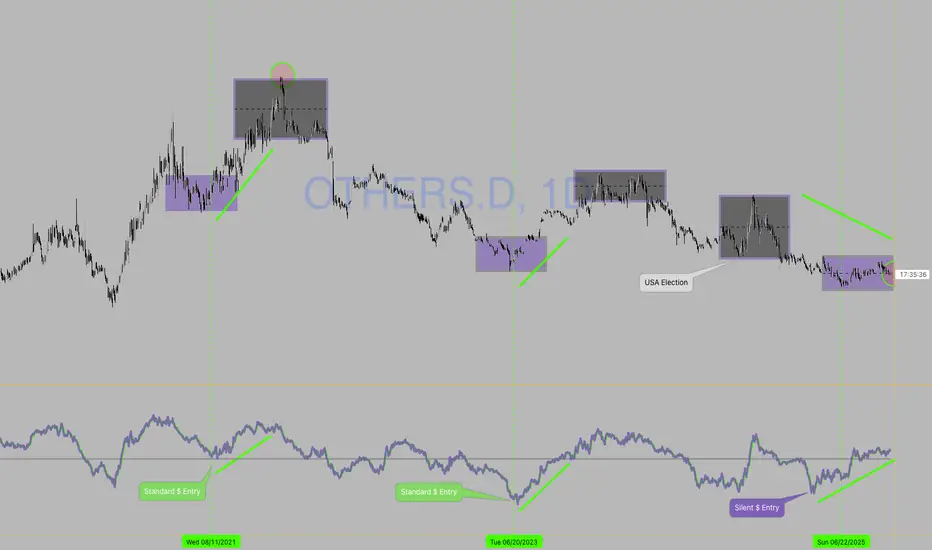
Chart: CRYPTOCAP:OTHERS.D
━━━━━━━━━━━━━━━━━━━━━━━━━━━━━━━━━━━━━━━━
📊 The Setup
While the mainstream remains fixated on Bitcoin's swings, a quiet but significant capital rotation into altcoins is underway. This move, largely undetected by the broader market, is being fueled by shifting global macroeconomic tides and a growing institutional hunt for wealth preservation and financial privacy .
━━━━━━━━━━━━━━━━━━━━━━━━━━━━━━━━━━━━━━━━
🔴 THE CRISIS: Multiple System Failures Converging
🏦 BIS Warning: Global Liquidity Crisis
↓
🇯🇵 Japan: Unsustainable debt from fiscal stimulus
🇫🇷 France: 0.6% growth in 2025, economic stagnation
↓
💸 Coordinated failure of fiat monetary policy
⛓️ Government Attacks on Safe Havens
↓
🇺🇸 U.S. Gold Tariffs: 39% on major imports
Physical metals face capital controls & taxation attacks
Traditional assets no longer safe from state control
🔒 Even Crypto Has Centralization Issues
↓
📜 GENIUS Act: Stablecoins expand M2 money supply (monetizing debt via blockchain)
🏢 XRP: Concentrated token control raises manipulation concerns
━━━━━━━━━━━━━━━━━━━━━━━━━━━━━━━━━━━━━━━━
🟢 THE SOLUTION: Where Capital Is Flowing
Smart money is seeking assets with:
• TRUE decentralization
• Privacy features
• Fixed supply
• Institutional-grade infrastructure
The Data Confirms It:
🔐 Privacy Coins (XMR, ZEC): +71.6% in 2025
📊 CRYPTOCAP:BTC: +27.1%
📊 CRYPTOCAP:ETH: +33.4%
📈 OTHERS.D: Rising quietly
This is sophisticated money moving in, not retail FOMO.
━━━━━━━━━━━━━━━━━━━━━━━━━━━━━━━━━━━━━━━━
💥 The Macro Catalyst: Why This Is Happening Now
⚡ Gold Under Attack: The recent 39% U.S. tariff on major gold imports has rattled the traditional safe-haven market, creating artificial scarcity and signaling a broader trend of government control over monetary assets . When even physical metals face intervention, capital seeks alternatives outside increasingly controlled systems.
🚨 The BIS Warning Nobody Is Discussing:
The Bank for International Settlements is quietly sounding alarms on global liquidity risks:
• 🇯🇵 Japan's fiscal stimulus → unsustainable debt levels
• 🇫🇷 France → 0.6% growth (stagnation)
• 💸 Result: Coordinated fiat monetary policy failure
🪤 The Stablecoin Trap:
The U.S. GENIUS Act is expanding M2 money supply through the back door via stablecoins:
→ Legitimizing stablecoin issuance backed by Treasury bonds
→ Monetizing debt while calling it "innovation"
→ This isn't decentralization—it's the Fed with a blockchain wrapper
━━━━━━━━━━━━━━━━━━━━━━━━━━━━━━━━━━━━━━━━
🎯 Macro Pressure → Altcoin Opportunities
😰 Worried About: Wealth Confiscation/Control
💡 Consider: Financial Sovereignty & Privacy
🔍 Examples: CRYPTOCAP:XMR , CRYPTOCAP:ZEC
📈 Catalyst: Zcash surged 150%+ on institutional demand (Grayscale Trust)
😰 Worried About: Currency Devaluation & Inflation
💡 Consider: Scarce, Decentralized Stores of Value
🔍 Examples: Altcoins with fixed supplies + robust decentralized governance
🔑 Key: Assets that can't be inflated or controlled by single entities
😰 Worried About: Traditional Finance Instability
💡 Consider: Institutional-Grade Blockchain Infrastructure
🔍 Examples: HBAR (corporate governance) & XRP (cross-border payments)
⚠️ Note: Focus on real-world utility beyond speculation
━━━━━━━━━━━━━━━━━━━━━━━━━━━━━━━━━━━━━━━━
What to Watch For
✅ Confirmation: Strong, high-volume breakout above recent range high on CRYPTOCAP:OTHERS.D
🔍 The Privacy Pulse: Continued strength in privacy coins ( CRYPTOCAP:XMR , CRYPTOCAP:ZEC , XVG.D) is a key leading indicator. Note: Privacy coins face regulatory challenges and have been delisted from some major exchanges.
❌ Invalidation: Break and close below key support zone (April low structure) would suggest macro fears haven't overcome broader market uncertainty.
━━━━━━━━━━━━━━━━━━━━━━━━━━━━━━━━━━━━━━━━
🎯 The Bottom Line
The gold tariff is a symptom of a larger disease: eroding trust in neutral, non-government monetary assets . This is forcing a "regime change" in capital allocation.
As this realization dawns on more investors, the quiet accumulation in altcoins—particularly those offering privacy, sovereignty, and real-world utility —could explode into the next major market narrative.
💭 Smart money is moving early. The question is: will you recognize this shift before it becomes obvious?
━━━━━━━━━━━━━━━━━━━━━━━━━━━━━━━━━━━━━━━━
⚠️ Disclaimer: This is macroeconomic observational analysis and is not financial advice. Always conduct your own research (DYOR) and manage risk appropriately.
Cheers!
Economic Cycles
Etoro - Technical laggard reversal Ahead? Etoro has experienced a bad beating since its IPO - predominantly a result of its poor financial numbers, poor laggard to its peers (IBKR / HOOD which have undoubtedly done very well in drumming up attention).
What I am seeing here is the potential of a laggard reversing within short - mid-term horizon.
Below is a quick summary for its poor share performance by Mr AI.
1. Weaker Sequential Earnings and Profit Normalization
The company’s Q2 results, while beating headline expectations, showed a nearly 50% quarter-over-quarter drop in net profit and a sequential decline in adjusted EBITDA and net contribution. This signaled that the surge in trading seen around the IPO was not sustainable, raising concerns that strong Q2 results were more of a one-off event than a new baseline for growth.
2. Decline in Trading Activity and Revenue Dependency on Crypto
Trading volumes and activity “normalized” after April’s volatility, with total trades slipping year-over-year despite a brief revenue boost. Notably, over 90% of eToro’s revenue comes from crypto trading, making its performance highly sensitive to swings in crypto market sentiment—a risk that became clear as the retail trading boom cooled and Bitcoin’s new record high failed to drive a lasting spike in engagement.
3. Rising Expenses and Margin Pressure
Heavy marketing expenditure and increased investment in platform enhancements post-IPO have led to a surge in operating costs, calling into question future profitability margins even as revenues grow.
4. Analyst Downgrades and Lowered Price Targets
Several investment banks (Mizuho, KBW, Jefferies, UBS) cut eToro price targets and estimates, often citing weaker trading revenue per account and a lower overall take rate. These moves weighed further on investor sentiment, despite some analysts maintaining positive long-term views.
In summary, with so much negativity being priced into the stock, short interest wearing off, selling pressure cooling off and potential postive rerating ahead, there should be more upside potential than downside risk within the next 3 month.
Entry: ~$40
Exit:~$53
Holding Period: 3 month
Upside: 32.5%
APR: 207.7%

A Cautious OutlookWe are about to enter overtime, or extra innings for this cycle. But, there has been no clear euphoria stage yet.
Number of days from:
Bottom to top: 852, 1061, 1050 (so far)
Top to top: 1479, 1424, 1426 (so far)
Gains are compressing as expected, but are the cycles lengthening? Or will crypto top out and enter a downtrend? We'll find out soon.

Gold monthly RSI >90 (first time since 1980) - rising FOMO risk💡 Idea / Thesis
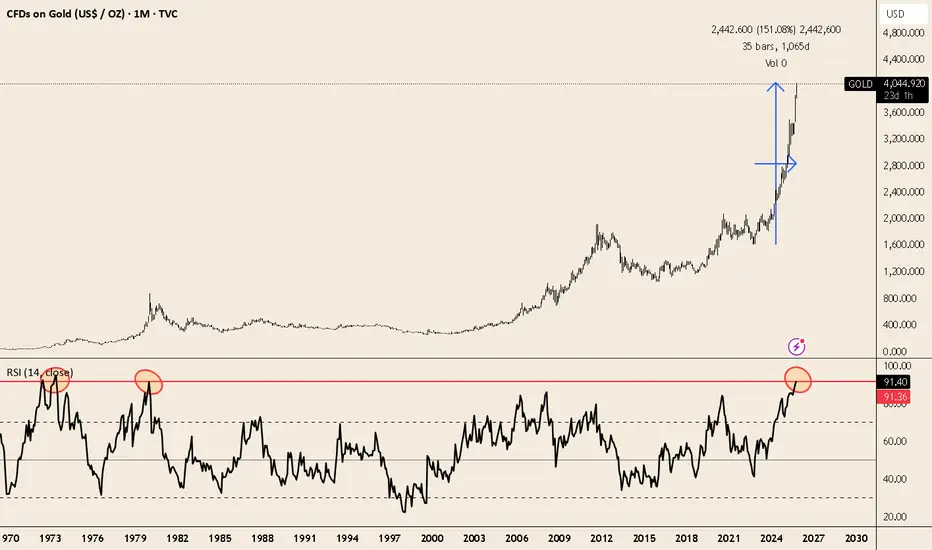
Gold ( TVC:GOLD ) has gone almost vertical — up ~150% since late-2022 and +54% YTD.
The monthly RSI(14) just hit 91.36, a level we haven’t seen since the 1980 peak.
That doesn’t mean “sell now,” but it’s a clear sign of euphoria and extreme momentum — the type of move that usually ends with a pause or correction.
⚠️ Why I’m cautious
RSI >90 = extremely rare, often followed by several months of consolidation.
Parabolic breakout: The rally above 3400-3500 left little support underneath.
Sentiment: Everyone’s talking about gold again → signs of FOMO and crowded trades.
🎯 How I’d approach it
If you’re long:
Lock in some profits or hedge part of the position. Continue DCA strategy
Watch for a pullback to increase exposure like for example the area 3,300–3,500.
🚧 Risks
Strong uptrends can stay overbought for months — RSI ≠ sell trigger.
Central banks & geopolitics can keep gold strong.
Manage position size and respect stops.
📊 Bias: Long-term bullish, short-term cautious
Not financial advice. DYOR.
Bitcoin Keltner Channels 📈BTC Keltner Channels
🔝Bitcoin broke out of the baseline resistance, under which it consolidated for a long period.
✍️While I don't expect a return below this gray line until the peak of the cycle, remember that it is almost 2 years away and we will have more than one correction before then.
💡I expect especially volatility in the next six months when there are quite a lot of events related to BTC.

Are we in for a 3-wave cycle in BTC? 👀#Bitcoin Keltner Channels 📈
The current BTC cycle is often compared to the cycle of 2020 or 2016. Well, let's consider what if this cycle is different.
In the first cycle, we did not have substantive and protracted corrections. The second cycle had a more pronounced mid-cycle peak, and a longer consolidation after it, and even then the 2nd wave of movement.
The current cycle can have a 3-wave movement. What does this indicate?
💡For example, if now the ETF inflow continues to be positive, and in a month everyone will understand that the halving is very soon, this may lead to the fact that there will be no substantial corrections for another 2-3 months.
📝The third wave will begin already after a decrease in sales from miners and an increase in liquidity from lowering interest rates and infusions into the economy.

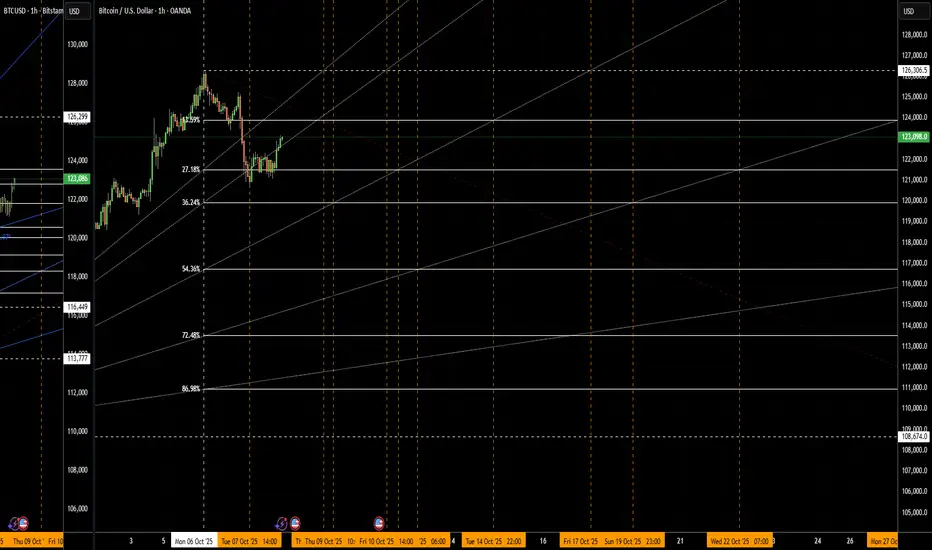
Timing Clusters for Bitcoin Based on chart geometry, the vertical timing lines serve for intraday trading.
Ensure the price reacts at a support or resistance level when it hits a timing line.
Take profit on the next candle or at the next S&R level. Place stops on the opposite S&R.
It's the combination of these two factors that leads to higher rates of success.
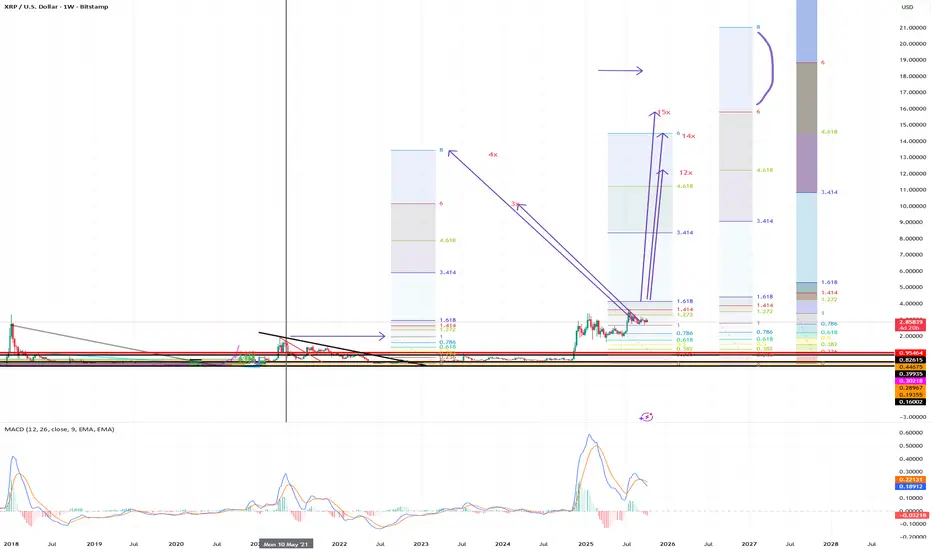
xrp 14 18 24Although we could expect 24 or more, it is possible that the very strong setback, in March 2025, could just let us get 10usd-12usd. If something goes wrong, only 6usd

XAUUSD Gold to 4KTimeline is 6 months - 2 years
The crash has already started. At some point everyone will start to sell thier treasury bonds, yields will go up proportionally to inflation until the dollar loses it's status as the global currency and dramatic measures are used to stop inflation resulting in stagflation and yield recovery. Else hyper inflation and the dollar is replaced entirely.
I see the momentum indicators shifting in various markets. Below is a brief summary of each, relevant indicators/markets. see charts.
US1YRBILLS
WTI CRUDE
SILVERUSD
BONKCOIN
TSLA

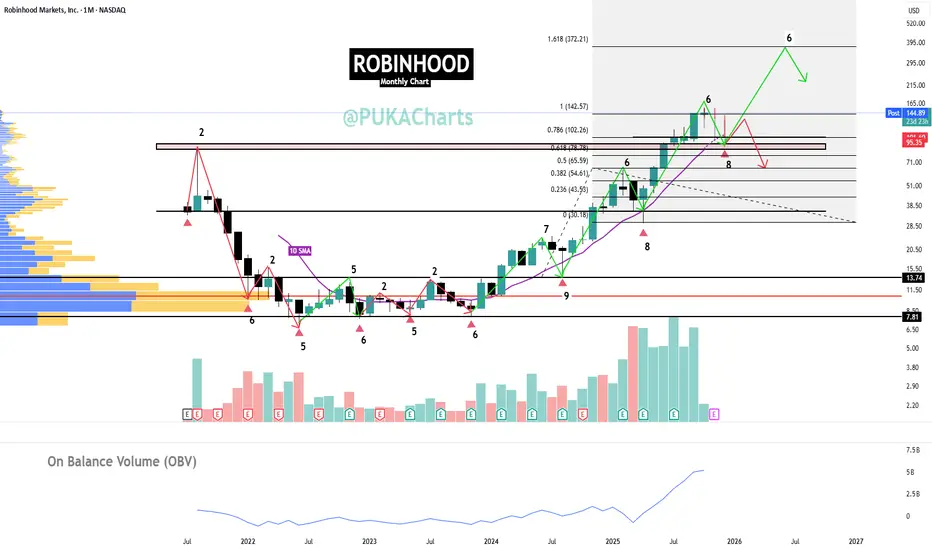
ROBINHOOD - $HOOD - Cycles Study / Profit taking / Monthly Chart
ROBINHOOD - NASDAQ:HOOD
✅868.40% unrealized profit to date.
🖊️Average Buy In: $13.74 / Price Today $144.90
⚠️Looking to extract some profit and consider re-entry
▫️ We have hit the 1.0 Fib extension level resistance.
▫️Since up thrust, cycles bottom to bottom 8 - 9 months
▫️ Top of right translated cycles (green) have been 6 - 7 months. We are in a month 6 now. Probable move down into month 8 or 9. Month 7 to decide direction. Left translated cycles are in red.
▫️ I will remove 30% position here and re-enter on a visit of 10 month moving average and bounce. TRADERS CAN ENTER FOR BOUNCE FROM 10 MONTH SMA.
▫️70% to remain allocated, in case of further upside in the event of no 10 month SMA revisit in month 7 - 9.
▫️ If the 10 month moving average does not hold and is lost (first warning).
▫️If the $87 level is lost on a weekly close, I will exit full position.
Binance will guide usBNB starts the explosive upside movement. I don´t know how high will it go but
I think maybe 4200 or maybe 3200 is possible, I´ll follow this move and so I´ll know how high will other alts will go

Bearish outlook for Bitcoin!Bitcoin Cycle Analysis and Trade Thesis
For more than a decade, Bitcoin has evolved through recurring cyclical patterns, consistently respecting long-term moving averages and two logarithmic regression curves — one defining market peaks and the other defining troughs. I expect this structural behavior to persist over the coming years.
On Friday, as INDEX:BTCUSD briefly topped 123,000, I initiated a bear put spread on NASDAQ:IBIT (50/45 strike), expiring January 2026.
Target: BTCUSD ≈ 70,000.
If this target is not reached by late 2026, I will close the position regardless of price.
Bearish Counterpoints
“Never trade against the trend” — Bitcoin has remained structurally bullish since inception.
“No parabolic top” — Historically, bear markets have emerged only after parabolic blow-offs, which are not currently visible.
“No fundamental trigger” — Major bear phases have often begun with clear catalysts (e.g., Mt. Gox invalid transaction issues, Mt. Gox collapse, China’s mining ban…), none of which are present now.
I admit it feels somewhat awkward to go short while everyone else is buying.
But in trading, profit often comes from being contrarian — buying near the bottom when fear dominates, and selling near the top when euphoria takes over.
And one last thought: even if I believe crypto will still exist in 50+ years — stablecoins, for example, are undeniably useful for fast money transfers and cross-border payments — I expect many of the most speculative assets to trade far closer to zero than to today’s prices.
Bitcoin, along with others tokens, remains, in my view, vastly overvalued.

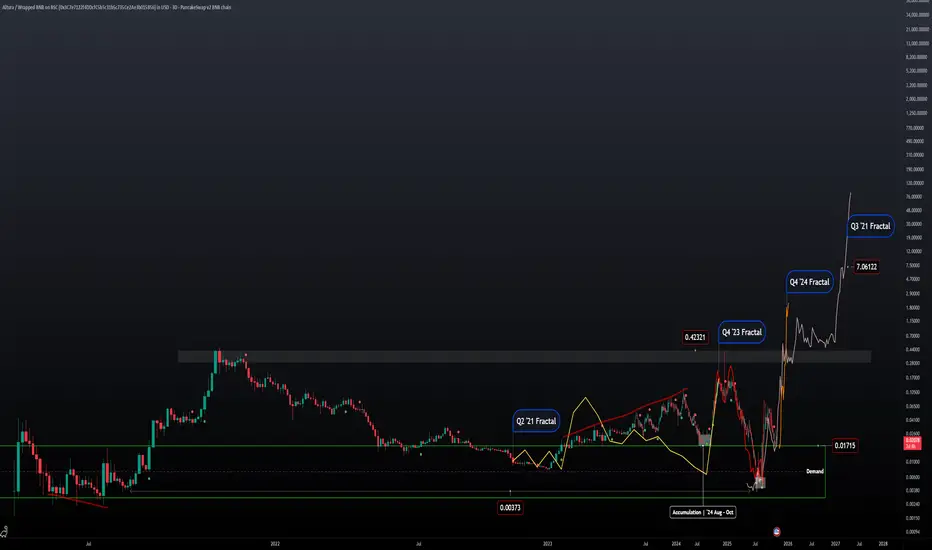
ALU | '21 Fractals | Price Projection Four different fractals with similar results. Q2 '21 price was in convergence and took off in July similarly to price action in '23 -'24. Except price was in divergence and stopped selling off in July and took off in November leaving the middle months for accumulation.
After the expansion phase of the market in '24 price action got tossed into the distribution phase and price was bound to fall to these lows today.
Looking at Q4 '23 Fractal it fits perfectly with what we saw early this year when price was distributing.
Regardless what the news and fundamentals where saying price was able to repeat the same fractal by using the lows of '21.
Q4 '24 Fractal is the most recent pattern that we can reference with todays price action to get a projected estimate.
Current price action has also stopped selling in July and has been accumulating since then
Would like to see price action close at ATHs going into the next year and into the next distribution phase.
GBPUSD BTMM Analysis – Bearish OutlookFollowing the BTMM framework, GBPUSD appears to be continuing it's bearish movement. With TMEOW, the pair finishes the week above this week's opening.
Day 1: We saw the initial push up creating the high.
Day 2: Price formed the M-pattern and rejected from the upper levels.
Day 3: Falls on the FMWB which could expect the pair to continue bearish after briefly consolidating.
The intraday trendline has already been tested, and momentum indicators are signalling exhaustion at these highs. Unless price reclaims the previous peak, bias remains bearish, with expectation of further downside continuation towards lower liquidity pools.
Bias: Bearish
Target zones: 1.3400 – 1.3360

Altcoin Market Cap (TOTAL2) Breaking the 2021 Bull Market PeakThe TOTAL2 chart, representing the total crypto market cap excluding Bitcoin, has officially broken above its 2021 bull market highs for the first time in nearly 4 years.
This breakout marks a major structural shift from consolidation into potential expansion.
Key levels & structure:
Breakout zone: $1.7T (2021 cycle high)
Measured move projection: $2.98T (conceptual target if expansion structure repeats)
Invalidation: Weekly close back below $1.7T
Historically, sustained breakouts of this magnitude have preceded broad capital rotation into the altcoin market, often leading to what traders call Altcoin Season.
What do you think, is this the early stage of the next expansion phase or just a false start?
📊 Educational chart — not financial advice. Market structure can change.

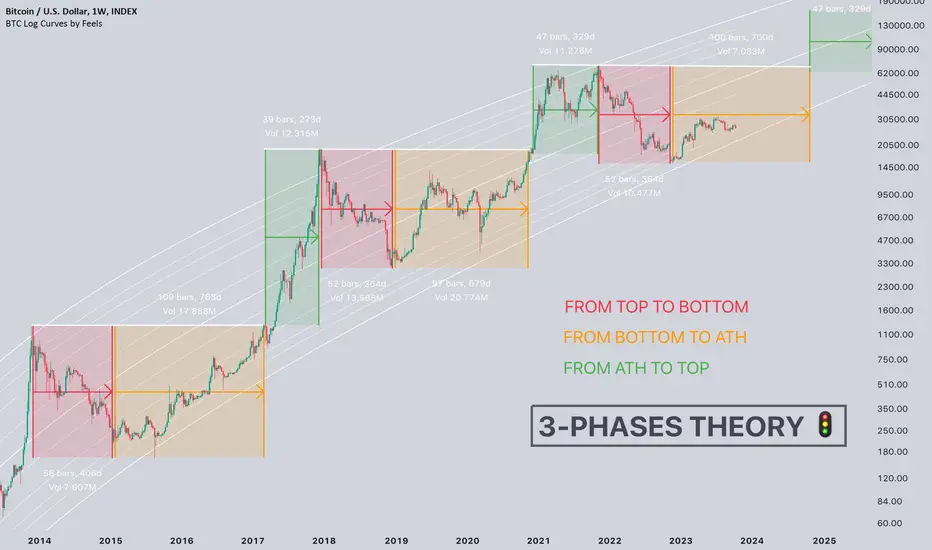
#Bitcoin 3 Phases Theory 🚦Today I saw a headline that surprised me "The current bear market has become the longest in the history of the crypto industry"📰
And I had a question about whether they were living in the past, or where they saw the bear market.🤔
💡I want to remind you that it ended with a duration of exactly one year, just like the last cycle. And it was much shorter than in 2014.
Now CRYPTOCAP:BTC is +70% from the bottom, this is a classic phase of accumulation.
Gold Price: Time to SellFor investors following the short-term technical landscape of gold, a critical signal has just been triggered.
Our analysis indicates that the selling point for gold has been reached at $3,950 per ounce (USD). This level was hit on October 6, 2025, and we expect the window to remain open through October 7, 2025.
The Key Takeaway
This price level of $3,950 is highly likely to mark the peak of the current rally cycle.
Selling Point: $3,950 USD/oz
Timeframe: October 6 – October 7, 2025
Significance: Potential near-term cycle Peak
Investors looking to realize profits from the recent climb should note this critical technical junction. As always, use this information as a guide and conduct your own due diligence.

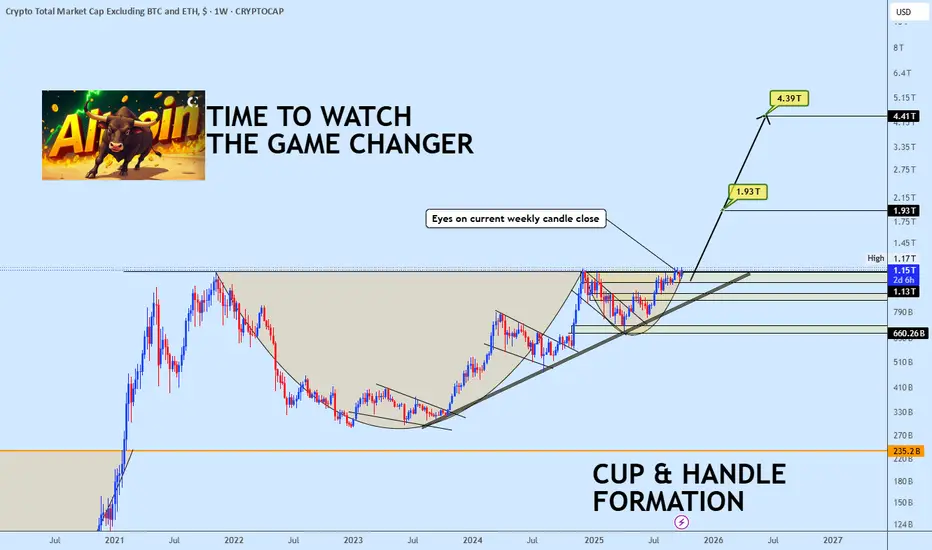
The Altcoin Breakout is HERE this is Your Game Changer!The stage is set. While Bitcoin consolidates its historic breakout, the real narrative shift is quietly unfolding in the altcoin universe.
The TOTAL3 chart (Total Crypto Market Cap Excluding BTC & ETH) is on the verge of confirming one of the most reliable and powerful bullish patterns in technical analysis: a massive Weekly Cup & Handle formation.
The current weekly candle isn't just testing the pattern's neckline, it's powering through it. This isn't just another test; this is the trigger event we've been waiting for.
The Moment of Truth: This Weekly Close is Everything
A confirmed weekly close above this neckline resistance is the final green light. It signals that the months of re-accumulation are over and the true Altcoin Cycle expansion phase is beginning.
This is the moment where "Alt Season" transitions from a hopeful whisper to a market structure reality.
Key Targets to Watch
The Cup and Handle pattern provides a clear, measured move projection.
1. Initial Breakout Target: $1.93 Trillion
2. Full Pattern Target (Cup & Handle): ~$4.39 Trillion
This is the grand prize. Achieving this target would represent a historic rally for the altcoin market cap and imply a period of explosive, parabolic growth for select altcoins.
What This Means For You
This breakout is more than just a lines on a chart event. It signals a profound shift in market dynamics.
1. Liquidity Rotation: As Bitcoin's dominance potentially stabilizes or dips, capital will aggressively flow into the altcoin space seeking higher returns.
2. Sentiment Shift: Fear and uncertainty will be replaced by FOMO (Fear Of Missing Out), driving valuations higher at an accelerating pace.
3. From Accumulation to Parabola: We are moving out of the stealth accumulation phase and into the public markup phase.
4. The message is crystal clear: If you thought you missed the run, think again. The altcoin chapter is just turning its most exciting page.
Here are the plan to follow
1. Aggressive: A confirmed weekly close above the neckline is a strong buy signal for broad altcoin exposure (via majors like ETH, or baskets).
2. Conservative: Use any retest of the former neckline (now turned support) as a high-probability entry point.
Watch this weekly close like a hawk. It's not just another candle, it's the starting pistol.
Like, follow, and let me know in the comments: Which altcoin sectors are you watching most closely for leadership in this oncoming bullrun?
$NDX $SPX $BTC All Close at Weekly ATHPretty cool to see ₿itcoin, S&P 500 and Nasdaq all close the week at new ATH 🥳
And now we have $325B about to be dumped into the US economy in FY26Q1 along with more rate cuts on the way.
Next time you speak to a bear, reply with FU HIGHER 🚀

$BTC / Total Global Liquidity / Treasury General Account How hilarious is this - ₿itcoin ended up reaching a new ATH just 5 days after I expected. I was 2 days off on my last call if you remember. And the several before I nailed to the day.
Remember all the grave-dancers last week who were showing you the decorrelation between CRYPTOCAP:BTC & Global Liquidity??
🐤 chirp chirp 😂
It was clear the Treasury General Account was the cause for this deviation, therefore I added it on this chart alongside Total Global Liquidity to monitor more closely.
Note - the TGA is already included in the TGL index, but it appears to hold much more weight so it’s best to look at it alongside.
I also took out the inverted DXY since it’s been tracking near 1 to 1 and was used simply to show confluence.
Now that Fiscal Year Q1 2026 has started, the TGA refill is complete, which will finance the ~$325 Billion outlined in the One Big Beautiful Bill for defense, border security etc. This will also be financed in the form of short-term T-Bill issuance (what I've written about before).
Then we see the trickle down effect as money makes it’s way through the economy and the business cycle booms which is tracked through the ISM PMI.
The latest print on Sept. 30th showed a 1-point uptick now at 49.1, which is a point higher than last month’s reading. I’m confident the next several months will show readings above 50 which show continued growth in the business cycle and health of the overall economy.
To all the haterz - FU HIGHER 🚀

EURUSD STRUCTURE IS NOW BULLISH AFTER HH/HL SINCE 2018!Fibre structure has turned bullish since 2018 when the pair has been creating a LL/LH. A further pullback into the discount area with good rejection, will likely strengthen the bullish outlook further...
N.B!
- EURUSD price might not follow the drawn lines . Actual price movements may likely differ from the forecast.
- Let emotions and sentiments work for you
- ALWAYS Use Proper Risk Management In Your Trades
#eurusd
