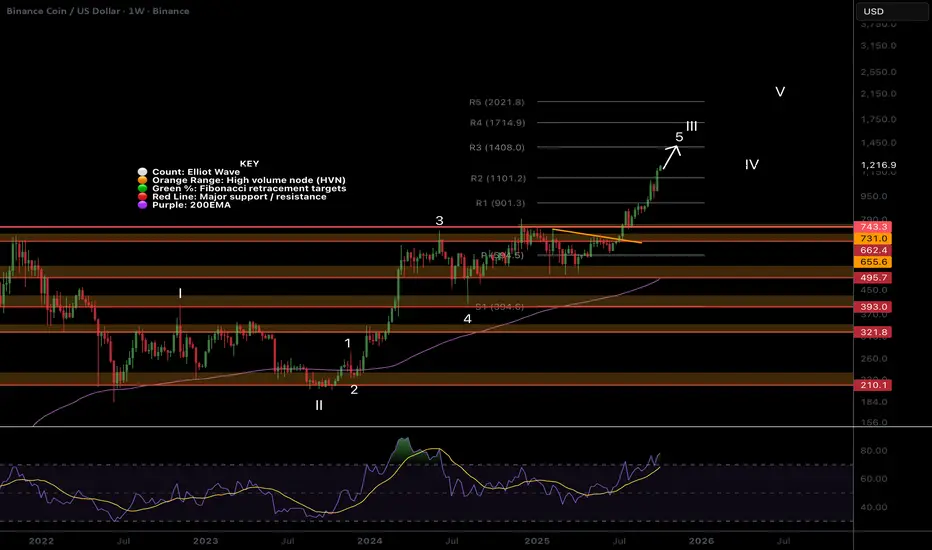
BNB cant be stopped!BNB is on a bullish journey of its own continuing into price discovery in what can only be described as wave 3 behaviour so I have upgraded my count to wave 5 of 3!
R5 pivot targets are $2021
Weekly bearish divergence persist!
Safe trading
Elliott Wave
BTDR Closed above the weekly pivot!NASDAQ:BTDR Wave (3) is underway and price has overcome the weekly pivot for now and bulls want to see this hold! The trend is up, the supports have been tested and the all time High Volume Node is the next target $25.
Fibonacci extension targets are minimum if $38 at the 1.618 with possibility to overextended bringing up the next target of the R5 weekly pivot at $76
RSI is not overbought and has plenty of room to grow, reaching the next leg often kicks in serious momentum!
Safe trading

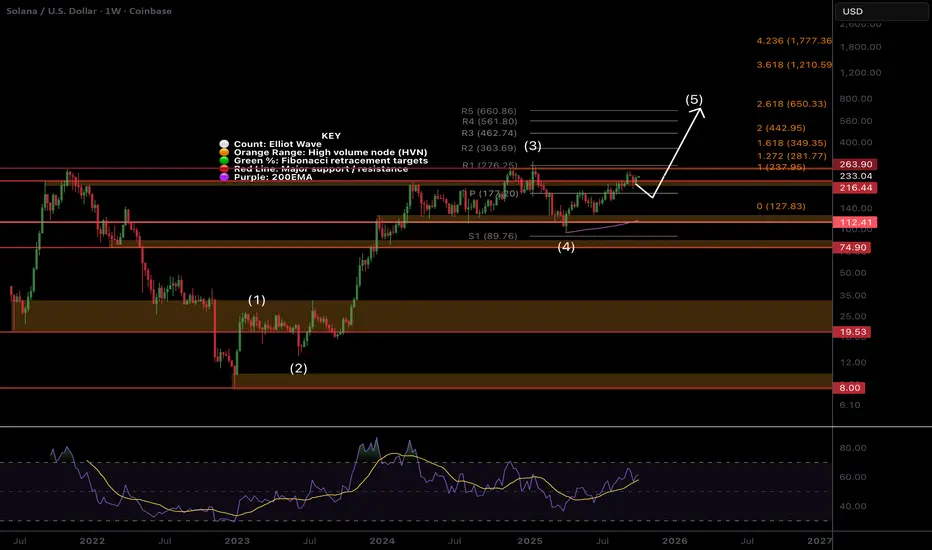
SOL Macro - Time for Price discovery?$SOLWeekly RSI has returned to the EQ giving Solana plenty of space for upside growth! Price is attempting to break into all time high but just can’t find the momentum it needs. This is good thing for now, keeping volatility to a minimum!
Weekly R5 Pivot and Fibonacci extension targets are $660. Price is above the weekly pivot showing the uptrend is in tact and may well test it as support again!
Consolidating under resistance for an extended period often leads to a breakout!
Safe trading
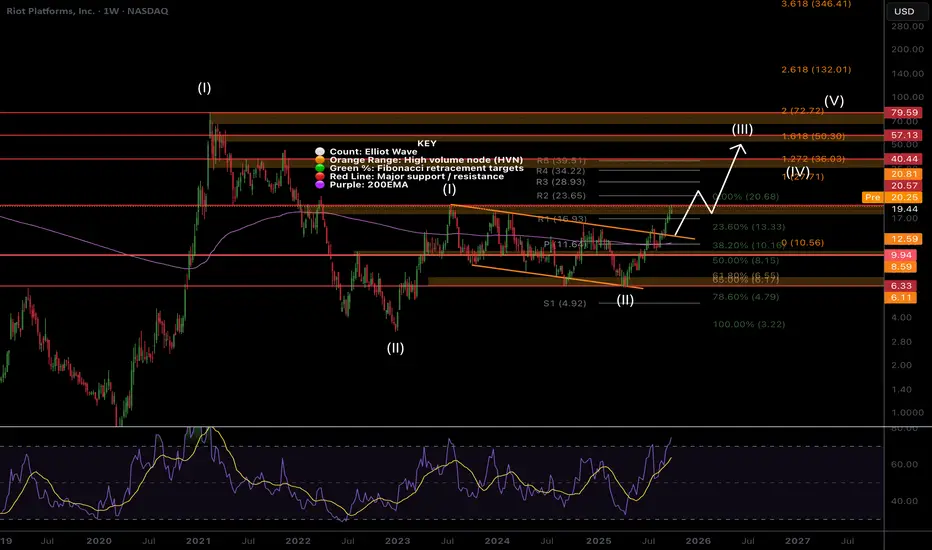
RIOT Macro, Higher for Longer!RIOT’s weekly RSI is overbought but can stay like this for many months as price continues upwards, just look at IREN!
Elliot wave (II) completed at the golden pocket. Price is finding minor consolidation at the wave (I) High Volume Node but is expected to break through with current price action and accelerate to $40, the High Volume Node and R5 weekly Pivot. Momentum is in control. Wave (III) has a minimum target of $50, per Fibonacci extension rules.
Safe trading
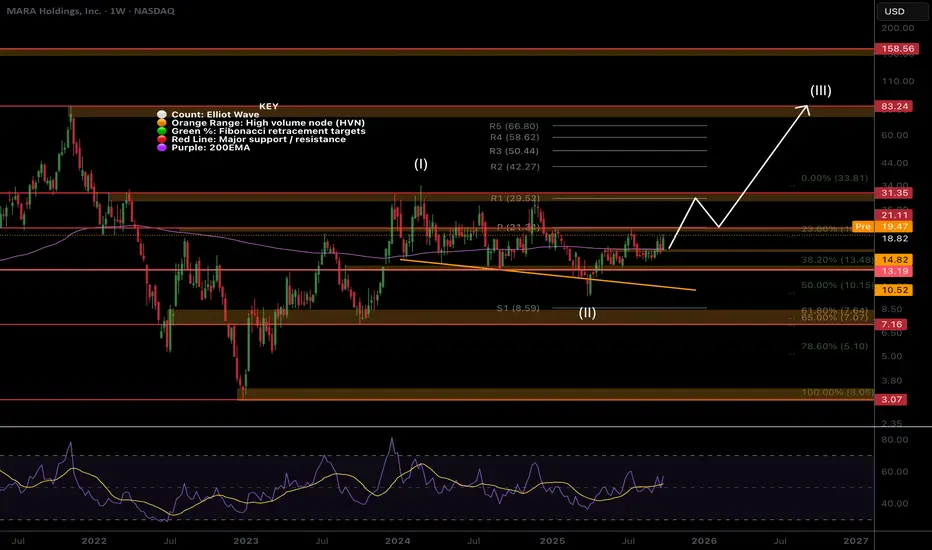
MARA Ready To Finally Move towards $30?MARA’s Elliot Wave (II) retracement front run the Fibonacci golden ratio and has now overcome the weekly 200EMA. The weekly pivot looms as strong resistance $21 just above the first target of our recent trade signal. If wave (III) is underway we should see price begin to accelerate alongside Bitcoin with an initial target of $31 followed by $80 High Volume Node.
Expect price to consolidate at the wave (I) resistance $30 for a while. Weekly RSI is crossed bullishly at the range EQ giving it room to move bullishly!
Safe trading
COIN Wave III underway into all time high!Elliot Wave (III) is still underway after wave (II) completed at the weekly 200EMA. Coinbase had a huge bullish engulfing candle this week, closing price above the High Volume Node and R1 weekly pivot - a strong bullish signal!
Price first tested the High Volume Node support and 0.382 Fibonacci retracement, $270. Characteristic of wave 3 shallow pullbacks.
Weekly RSI has reset to the channel EQ and crossing bullishly giving price room to extend upwards!
Safe trading

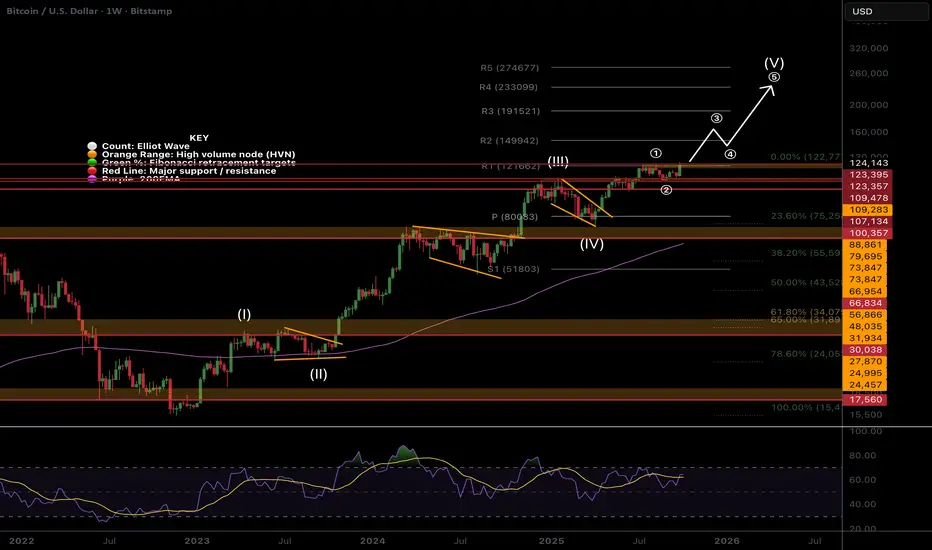
BTC Continues its shallow pullbacks to all time high pattern!This weeks candle bullishly engulfed the entire range showing supply is exhausted and price is ready for the next leg up in Elliot wave wave (3), the powerful wave, especially with a shallow wave (2)!
A word of caution, currently there is a 3 waves up into all time high that resembles a running flat correction which penetrates all time high before retuning the lower range boundaries, 1$08k in this case to complete the correction.
The R2 weekly pivot is the first target at $150k. Weekly RSI continues to print bearish divergence but has come out of overbought and tested the EQ. It is now crossing bullishly. A push into overbought will negate the bearish divergence.
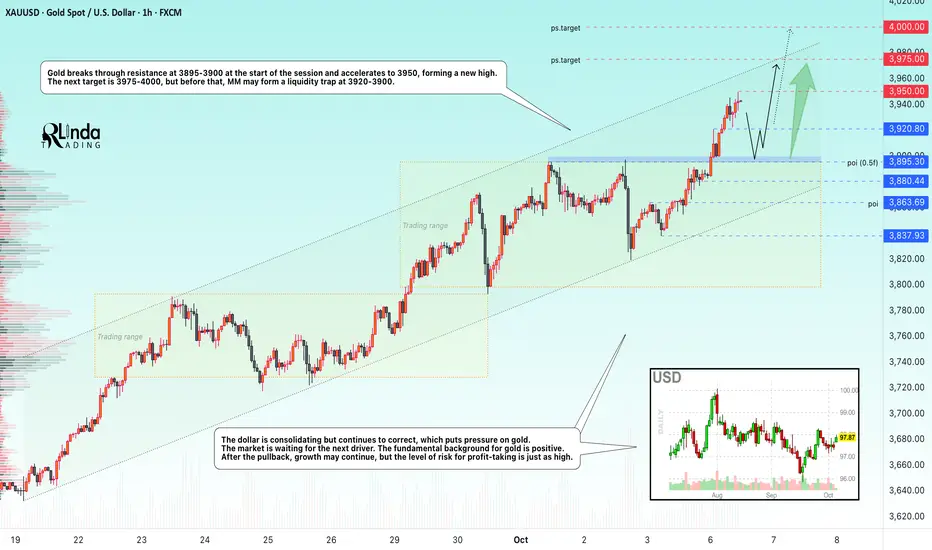
GOLD → Rally to the psychological target of $4,000FX:XAUUSD hit a new all-time high of $3,950 (+1.7% for the day at the time of writing), continuing its move toward the psychological $4,000 mark. The growth continues despite the strengthening of the dollar and the rally in the stock markets.
Key drivers: The ongoing US shutdown (now in its seventh day): The lack of progress in negotiations and the risk of mass layoffs of civil servants are increasing demand for safe havens.
The probability of a rate cut in October is 100%, and in December, 94%. Weak labor market: Trump's statements blaming Democrats for job losses are fueling pessimism.
Fundamentally, gold remains on an upward trend thanks to the perfect combination of US fiscal risks and soft monetary policy. A breakout to $4,000 seems only a matter of time if the shutdown is not resolved.
Resistance levels: 3,950, 3975, 4000
Support levels: 3920, 3900, 3880
Technically, before reaching the 4000 mark, MM may form a liquidation, especially against the backdrop of the FOMC meeting on Wednesday and the Fed on Thursday. Key areas of interest before growth: 3920 and 3900, behind these areas lies a pool of liquidity that will not prevent the accumulation of energy before the next bull run.
Sincerely, R. Linda!
USDJPY → Gap and retest of resistance on a neutral trendThe Japanese yen opens with a gap in the Asia-Pacific session and forms a distribution, within which it tests the resistance zone of 149.93 - 150.79.
The dollar is rebounding again, provoking a corresponding reaction in the markets. However, based on fundamental data, the decline may continue after the pullback.
Gap in USDJPY, distribution and entry into the resistance zone at high speed, there may not be enough potential for continued growth. There is no trend, the price is in a sideways market. A false breakout of 149.93 may trigger a correction towards the lower boundary of the gap.
Resistance levels: 149.93, 150.79
Support levels: 148.76, 148.09
If the currency pair is unable to continue growing, then a false breakout of resistance can be considered. A return of the price to the range on D1 may trigger a decline to support.
Best regards, R. Linda!

Tesla (TSLA) – Final Wave 5 to Complete Cypher HarmonicTesla is progressing through its final impulsive Wave 5, with upside targets aligning at $563–$564, confluencing with the 1.272–1.618 Fib extensions and the completion of the Cypher harmonic (point D). Once this target is reached, a corrective decline is anticipated, forming the Cypher retracement and potentially filling untested gaps below.
Key levels to watch:
Upside target: $488.5, then $563–$564 zone (Cypher completion).
Downside retracement: possible move back toward the $350–$360 region (0.618–0.786 support).
Invalidation:
A breakout above $565 would invalidate the Cypher completion zone and suggest extended bullish continuation.
A breakdown below $400 before reaching $488 invalidates the Wave 5 structure.
This scenario blends Elliott Wave 5 projections with harmonic Cypher confluence for a potential high-probability setup.

Bitcoin — Comprehensive Late-Trend RoadmapBitcoin — comprehensive update: late-trend ladder, potential 4→5, and channel targets
Thesis
BTC is advancing inside a rising Elliott channel from the 2022 low. Late in an impulse, wave-5 often terminates near the channel’s upper line (sometimes with a brief throw-over), while momentum divergences frequently appear as higher highs print with weakening oscillators. That combination frames the next weeks: respect channel boundaries for upside targets and require price confirmation for any reversal.
Structure map (what the channel says)
Channeling guideline: after wave-4 is identified, draw a trendline 2→4 and run a parallel through 3 to project the likely wave-5 termination zone; many 5s end at, or just beyond, this upper boundary.
Throw-over risk: a brief penetration of the upper line by wave-5 can precede a major reversal; treat it as terminal unless acceptance above the channel holds on retest.
Levels (prices on the map)
Upside decision ladder — current impulse extensions
1.618 → $126,738 (typical wave-3 target; first decision/scale zone)
1.786 → $128,767 (often tags in strong legs)
2.000 → $131,398 (common wave-5 equality/overthrow checkpoint)
Acceptance through the full ladder shifts focus to the next confluence. (Use standard Fib extension practice from the last clear base.)
Stretch / confluence above
0.618 higher-degree cluster → ~$139,205 (popular profit-taking/reassessment area in crypto trends).
Dynamic channel guidance
Rising median of the 2022-anchored channel ≈ $150k now; linear projection implies ~$156k–$160k if contacted ~4 weeks later, depending on slope. Median/upper lines often act as magnets/termination rails late in trends.
Momentum/diff checklist (confirmation logic)
Bearish divergence = price higher high with RSI/MACD lower high → a warning of trend fatigue; treat as context and wait for price triggers (e.g., break of the last higher low).
Throwback behavior after upward breakouts is common; a retest that holds often resumes the uptrend. Do not assume failure unless support breaks.
Scenarios & exact triggers (including the “possible 4 → another 5” path)
A) Wave-3 at 1.618, then a real wave-4, then final wave-5 (classic)
Path: Pause/roll at $126,738–$131,398 → corrective wave-4 (shallow to moderate) → renewed push for wave-5 toward $139,205 and potentially the channel upper/median.
Triggers:
Wave-4 confirmation = loss of the last HL on execution TF (1h/4h) without breaking larger uptrend structure.
Wave-5 confirmation = reclaim of broken level + momentum re-acceleration.
B) No meaningful 4 yet → direct press to 2.0 and stretch
Path: Clean acceptance above $131,398 (2.0) with no fresh divergence → $139,205; if momentum persists, risk of throw-over into the channel’s upper line; then monitor throwback retest.
Triggers: Daily/3D closes through $131,398 with strengthening MACD/RSI, then alert at $139,205 for profit-taking and reversal risk management.
C) Divergence rejection at the ladder → truncated/short 5
Path: Price prints marginal HH into $126,738–$131,398 while RSI/MACD make LH → rejection → 5-down on 15m/1h → measured pullback toward 23.6–38.2% of the advance; larger reassessment thereafter.
Triggers: Bearish divergence plus break of the last HL and failure on retest (confirmation over anticipation).
Risk management (mechanical, level-driven)
Into $126,738 / $128,767 / $131,398: scale partials or hedge; if fading, hard stops above the spike-high to avoid terminal 5 squeezes.
On acceptance → $139,205: trail under prior HLs; expect a throwback and treat it as continuation unless structure fails.
On confirmed reversal: first targets = 23.6–38.2% retrace of the leg; deeper moves require fresh evidence.
One-screen summary (for the Idea caption)
Decision ladder: $126,738 → $128,767 → $131,398.
Stretch box: $139,205; beyond that, channel median/upper (~$150k now; $156–160k if tagged weeks later).
Bull path: acceptance above the ladder with rising momentum → box/rail; manage throwback.
Bear path: divergence + HL break at the ladder → 23.6–38.2% reset.
Channeling and throw-over/throwback guidelines support these outcomes
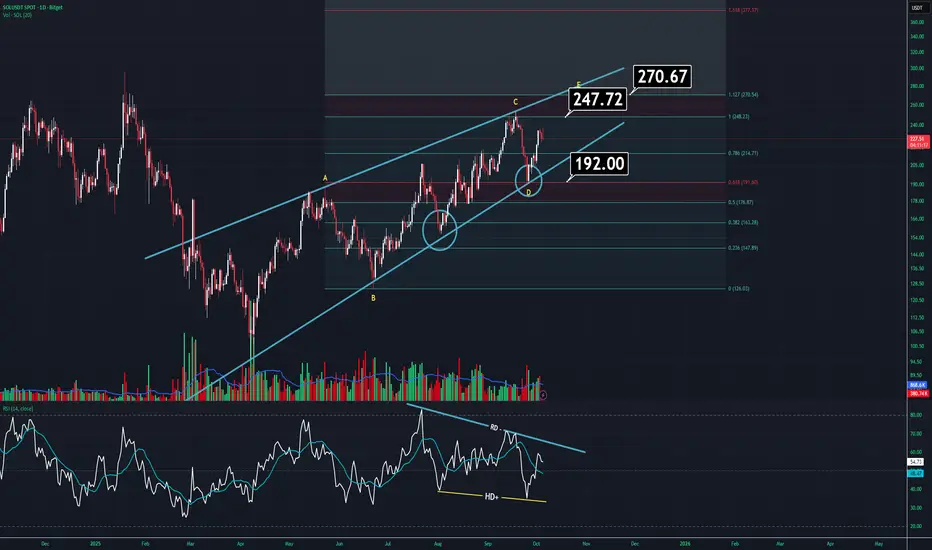
SOLANA UPDATE (1D)SOL is currently at a decision point, mainly due to both the ongoing recession and the delayed ETF approvals.
On the daily chart, it’s getting squeezed inside a large wedge pattern. Normally, it should make one more top before breaking down. However, just to be clear — if price drops below 192, there’s a strong possibility of a sharp sell-off. That’s where both the character shift and wedge breakdown would occur.
Some additional details:
Volume is flat and indecisive. It’s moving in line with the wedge, which isn’t a great sign. Typically, this kind of volume behavior is seen during wedge formations.
The RSI looks unusual — there are both negative and hidden bullish divergences. If you’re wondering which one matters more, it’s the hidden bullish divergence — it’s the stronger signal here.
If the recent high is broken, we could see SOL climbing towards the 270 region, after which we’ll know whether the wedge remains valid. However, in general, the outlook doesn’t look too strong at the moment.
#XAUUSD AnalysisHello friends
#NEW forecast on GOLD
The price continues to support level and retesting the upward trend line .
Price action is moving towards the resistance area around 3950.
By regards, Honeytrading

XRP/USD — Breakout Playbook 2-Day ChartXRP — Breakout Playbook (Weekly Context + 2-Day Execution, With Divergences & Wave Map)
1) Market position (where price sits now)
Price is compressing beneath a descending trendline and just under a horizontal range ceiling after a strong upside impulse.
The prior pullback held inside the mapped support box (approx. 2.85–2.64 on the chart), keeping the higher-timeframe up-leg viable.
2) Momentum state & divergences
Now (2-Day): Regular bullish divergence printed into the box: price made an equal/lower low while the MACD histogram made a higher low. This signals seller fatigue into support and raises the odds that a valid break can sustain if participation appears.
Anticipated (near resistance): Regular bearish divergence risk is elevated into 4.46–4.60 and again near 5.05. Expect momentum to lag if the move matures; divergence there often precedes a reaction.
On the throwback: a successful retest frequently forms hidden bullish divergence (price makes a higher low while momentum makes a lower low). That pattern supports the “acceleration” phase.
3) Wave roadmap (now → next)
Primary count on the breakout path
The current advance is mapped as micro A–B–C, with C ≈ A (1:1) clustering in the 4.46–4.60 band; a higher-hierarchy objective resides around 5.05.
After the first clean break, the standard path is: Wave 1 up through the ceiling → Wave 2 throwback to retest the broken trendline/ceiling → Wave 3 extension targeting 4.46–4.60, with potential continuation toward 5.05 if momentum holds.
What qualifies the Wave-2 retest
Pullback respects the former cap (trendline/ceiling acts as support).
The reaction back up shows volume expansion and improving momentum.
The Wave-2 low stays above the Wave-1 origin (structure intact).
4) Breakout qualification (must see both)
Close through the cap and range high on the 2-Day.
Participation: volume clearly above recent average on the break.
→ After that, a weekly close that holds above the level promotes the move from tactical to structural.
5) Path after confirmation (scenarios)
Base scenario — continuation with throwback
Break → throwback to the breakout line (common) → hold → acceleration.
Wave-3 behavior: broad bars, rising participation, momentum improving.
Targets by confluence on the chart:
4.46–4.60 (equality/congestion band) = first reaction zone.
~5.05 = higher decision area; expect a larger battle there.
Alternate bullish — deeper retest first
If the breakout wicks and fails to stick on the first attempt, a deeper retest into the upper half of the support box can still resolve higher, provided weekly structure remains intact and momentum rebuilds.
Bearish/failed break
Pop above resistance without volume, followed by a close back inside the range = false breakout risk; immediate de-risk and await a fresh setup.
A new closing low below ~2.64 (box floor) breaks the structure of the current weekly idea.
6) Risk, invalidation, and management
Tactical invalidation (post-break): a 2-Day close back under the reclaimed level on rising volume.
Structural invalidation: weekly close back inside the prior range after confirmation, or loss of the most recent weekly higher low.
Stop logic: trail beneath successive 2-Day swing lows during the advance; after weekly confirmation, management can widen to weekly swings to respect higher-TF trend.
Profit handling: expect churn and potential bearish divergence at 4.46–4.60; partials are reasonable there. If momentum/volume remain constructive, leave a runner toward ~5.05.
7) Execution checklist (pin next to the chart)
2-Day close above the descending cap and the horizontal ceiling ✅
Volume expansion on the breakout bar(s) ✅
Weekly close holds above the break ✅
Throwback: test of former cap; holds as support ✅
Wave-3 tells after the retest: broader candles, improving momentum, higher participation ✅
Zones to manage: 4.46–4.60 (reaction/divergence risk), then ~5.05 (bigger decision).
Failure tells: quick close back in range, retest breaks down, or fresh weekly lower low → stand down.
NIFTY50.....Sideways trading range!Hello Traders,
the NIFTY50 rose 239 points or 0.97% for the week.
It opened with a gap to the upside, but closed it immediately! Overall, the N50 is trading within a sideways range, from 25449 to 242587.
Chart analysis:
If the N50 extends its short-term gains, the target range is around 25449 and above, to the pink rectangle, from 25523-25654 area.
Extending this further, the next pink rectangle comes into focus in the 26K-26250 area.
To the downside, there is potential to drop to 24478-24295! More bearish potential exist.
As long as the green wave (ii) low is not touched, the labels are still valid in my view If so, the targets to look for are much lower. But one step at a time.
On the upside, there is a chance to rise, after the 25448 has overcome, to 26312-27438 in extension.
This could be a wave (iii), in green, with more bullish potential to the upside.
Well, friends, that's it for today.
Have a great week....
Ruebennase
Please ask or comment as appropriate.
Trade on this analysis at your own risk.

Bitcoin and Ethereum Long: Currently in wave 3 of 5Over in this video, I updated the Elliott Wave Counts for Bitcoin and Ethereum and suggest that they could both go higher as we are currently in wave 3 of 5. However, take note that Ethereum is in wave 5 of 3 of 5 and Bitcoin is in Wave 3 of 3 of 5. There is some misalignment between the counts of both cryptos.
Also take note that both are using logarithmic chart.

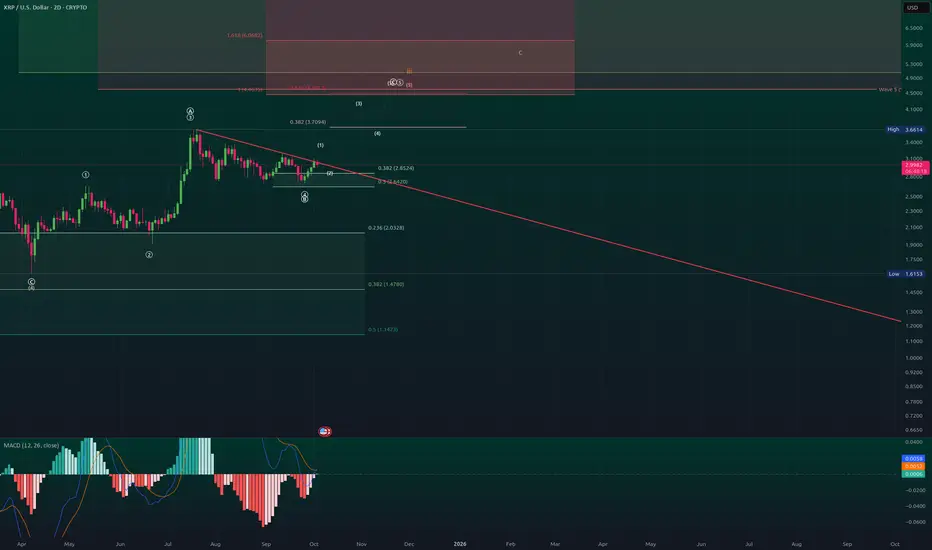
MSTR Headed to Balance Sheet Insolvency?If my wave forecast is correct and BTC trades down toward $23K (ie. 80% log retracement level of the 2023-2025 bull run), MicroStrategy (Strategy) becomes balance sheet insolvent: liabilities (convertible debt + preferreds like STRK/STRF/STRD/STRC) would exceed assets.
That doesn’t mean automatic bankruptcy. Their convertibles only cost ~$35M/yr in interest, and even with ~$550–$680M/yr on ~$6.43B at 8–10% in preferred dividends layered on top, they can still cover fixed obligations short-term by liquidating BTC or issuing more equity. That keeps them out of Chapter 11 in the near term.
But the trade-off is ugly:
Massive dilution from issuing stock at distressed prices, or
Selling BTC at $23K just to stay afloat.
The real problem is the refinancing wall starting late 2027. With equity wiped on paper and ~$1.1B coming due by early 2028, any refinancing deal will be extremely punitive, handing creditors cheap equity or forcing fire-sale BTC disposals.
Market pricing implication:
Equity = option value only.
Common stock would likely collapse into deeply distressed single digits (<$10), well below NAV, because shareholders sit behind $8.2B in converts and $6.4B+ in high-yield preferreds.
So even if BTC really does retrace all the way to $23k, MSTR doesn’t go to $0 right away, but the stock trades like a distressed, over-leveraged call option on Bitcoin, with survival depending entirely on a rebound before maturities hit.
BTC Forecast:

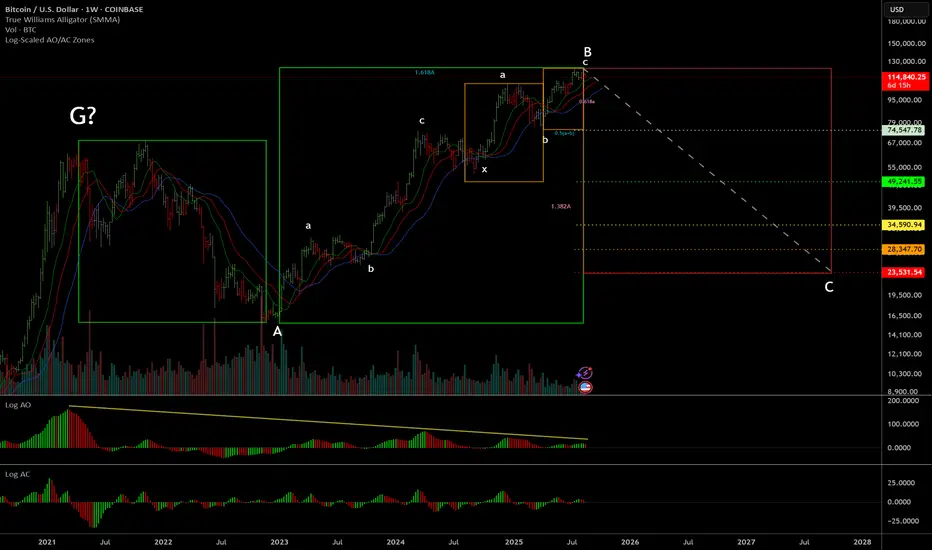
BTC Double Zigzag Ending on Terminal Impulse (Elliott Wave)BTC has formed into a double zigzag from the low in 2023 until now. This is the same count that my friend Glenn Neely (the founder of Neowave) is following.
At this point there aren't really any other counts that appear to make sense. Especially considering the terminal impulse that wave-c has formed (see Daily chart).
We've already begun breaking down from the rising wedge pattern, which is a strong indication that wave-c has concluded.
Beyond just Elliott Wave/Neowave considerations, this has also formed long-term momentum divergences on the AO, and a clear weekly wiseman right at the end of wave-5 of c, perfectly aligned with the 0.5(a+b) time target for wave-c.
This perfect confluence of signals here is a very strong signal the market has topped out long-term, and could retrace all the way back to ~$23k in the worst case scenario. Other potential retracement levels are labeled on the chart.
If this does end up breaking $125k, then it may be a good idea to flip bullish as the bull cycle could continue for an unknown amount of time after that. For now, probabilities are starting to stack up indicating that the top is in and a big retracement is coming.
long TNSR/USDT.ptensor about to go higher, it made a H&S pattern, the recent rise it left a small consolidation. currently its trading back to that. the point of controll of that small range is imo good for a long entry to around 0.1114 or even higher. trade safe, cheers

GBPUSD | 4HGBP/USD – Wedge Pattern Analysis | GreenfireForex
The GBP/USD (1H timeframe) is currently forming a contracting wedge pattern (A–B–C–D–E), indicating potential price compression before a decisive breakout.
🔹 Key Observations:
The pair is completing wave E, touching the upper wedge resistance.
Price is expected to face selling pressure near the resistance line, forming a short-term corrective move.
A breakout below the wedge could open a move toward the 1.34200–1.33500 demand zone.
However, if buyers defend support, we may see another push back toward 1.35000 before reversal.
📊 Structure Breakdown:
A–C–E → Lower highs (trendline resistance)
B–D → Higher lows (trendline support)
Possible continuation: ABCDE → Breakout
Blue zones mark potential liquidity areas and entry/exit zones.
⚡ Trading Outlook:
Watch for confirmation candles near the E point before positioning. A clean breakout with volume will confirm the next major move.
🧠 Pattern type: Falling wedge (potential bullish reversal)
🕓 Timeframe: 1H
💰 Instrument: GBP/USD

TSLA Roadmap: $563 ABCD Compl → Bat Harmonic → $631 Three-DriveTesla (TSLA) appears to be completing its final impulsive wave toward the $563 region, which also aligns with the D point completion of the ABCD harmonic pattern.
Once this move is finished, the expectation is for a corrective phase that forms a Bat harmonic. This retracement would also work to fill in the untested gaps left behind during the recent rally, with a potential bottom around the 78.6% Fibonacci level.
From there, the next bullish leg could initiate, targeting the 127.2% extension at $631. This move would not only confirm the harmonic reversal but also complete a larger Three-Drive pattern that originates from the initial ABCD structure.
Key Levels to Watch:
ABCD Harmonic D point: ~$563
Bat Harmonic completion zone: ~78.6% retracement
Next rally target: $631 (127.2% extension, Three-Drive pattern confirmation)
Invalidation Scenarios:
A clean breakout above $563 without corrective rejection would invalidate the Bat harmonic setup and suggest an extended bullish run.
A failure to hold above ~$367 (channel/structure support) would weaken the harmonic roadmap and risk a deeper bearish continuation instead of a Three-Drive completion.
This roadmap suggests a critical short-term top before a deeper correction sets the stage for a much larger rally.

Let Bitcoin make a new ATHHi traders,
My outlook on Bitcoin last week was wrong and I'm the first to admit it. I can't be 100% right. So we move on to the next possibility.
Last week Bitcoin went up very impulsive from out of nowhere due to fundamental news.
Now let price make a new ATH and wait for the (corrective or impulsive) move down to take a trade.
Let's see what the market does and react.
Trade idea: Let price make a new ATH and wait for the (corrective or impulsive) move down to take a trade bullish or bearish.
If you want to learn more about trading FVG's with wave analysis, please make sure to follow me.
This shared post is only my point of view on what could be the next move in this pair based on my analysis.
Don't be emotional, just trade your plan!
Eduwave

Still going up for goldHi traders,
Last week my outlook on gold was wrong. It turned out that gold was slowly going up some more.
Now it finished another correction down and rejected from the Daily bullish FVG so next week we could see more upside again.
Let's see what price does and react.
Trade idea: Wait for a small correction down on a lower timeframe and a change in orderflow to bullish and trade longs again.
If you want to learn more about trading FVG's & liquidity sweeps with wave analysis, please make sure to follow me.
This shared post is only my point of view on what could be the next move in this pair based on my technical analysis.
Don't be emotional, just trade your plan!
Eduwave
