Up for EUHi traders,
Last week EU came into the Daily BPR and rejected from there to the upside just as I've said for weeks already.
So next week we could see a small correction down and more upside for this pair.
Trade idea: Wait for a small correction down and look for a change in orderflow to bullish on a lower time frame to trade longs.
This shared post is only my point of view on what could be the next move in this pair based on my technical analysis.
But I react and trade on what I see in the chart, not what I've predicted or expect.
Don't be emotional, just trade your plan!
Eduwave
Elliott Wave

HBAR back in the channel!CRYPTOCAP:HBAR Price is back in the descending range after dropping below during the flash crash, which can be viewed as an anomaly.
Wave 2 appears complete at the golden pocket Fibonacci retracement. Price was rejected at the daily 200EMA and channel upper boundary and has lost the daily pivot and High Volume Node, suggesting further downside is to come.
📈 Daily RSI reached oversold and has printed hidden bullish divergence, which is bullish
👉 Continued downside has a target of the $0.13 High Volume Node
Safe trading

BNB Bearish continuation?CRYPTOCAP:BNB Price appears to have completed wave (1) at the R1 pivot and has retraced to the daily 200EMA, 0.5 Fibonacci retracement and S1 pivot so far. A tough nut to crack.
Wave (2) appears complete with a textbook ABC correction ending at strong support. The downtrend is intact, so the probability is still to the downside until the structure flips.
📈 Daily RSI has not reached oversold and is still bearish with no divergences
👉 Continued downside loses the 200EMA and brings up the Golden pocket as support $740
Safe trading

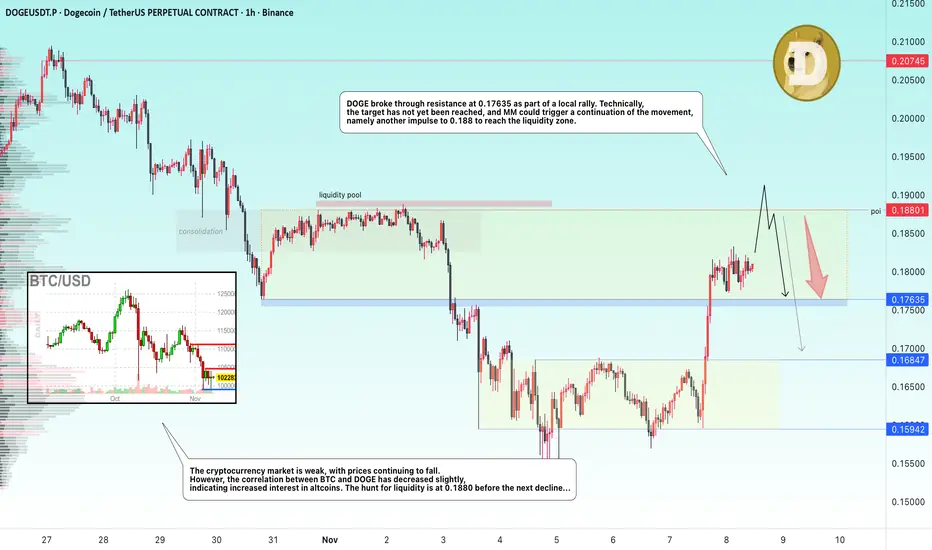
DOGE → The hunt for liquidity before the fallBINANCE:DOGEUSDT rose sharply on Friday. The reason is local news related to ETFs and Musk's tweet (it still works :) ). The growth potential may quickly exhaust itself...
The altcoin is strengthening, breaking resistance and consolidating between two important levels - 0.1763 and 0.188. The trend is bearish, the market is generally weak. I do not yet see any technical or fundamental potential for strong growth or a trend reversal.
In the current situation, DOGE may test the resistance zone of 0.188 due to the liquidity pool formed as part of local consolidation in early November. However, this liquidity pool may become a resistance to growth, which in turn may provoke a reversal and a fall.
Resistance levels: 0.188
Support levels: 0.1763
However, if the market does not allow the price to rise, it is worth watching the support level of 0.17635. Consolidation below this level will confirm the false breakout of the lower level and may trigger a decline.
Best regards, R. Linda!
Copper(XCU/USD) Ready to Explode | Wave 3 to $10, Wave 5 to $100🧠 COPPER — The Sleeping Giant Ready for a Supercycle 🌍⚡
Copper, the “metal of electrification,” is setting up for one of the biggest macro-bull markets we’ve ever seen. From EVs to renewable grids to AI data-center power demand, copper is literally the blood of the new industrial era . Let’s break it down step-by-step 👇
🔮 Wave Theory Confluence (Elliott + Fibonacci Extensions)
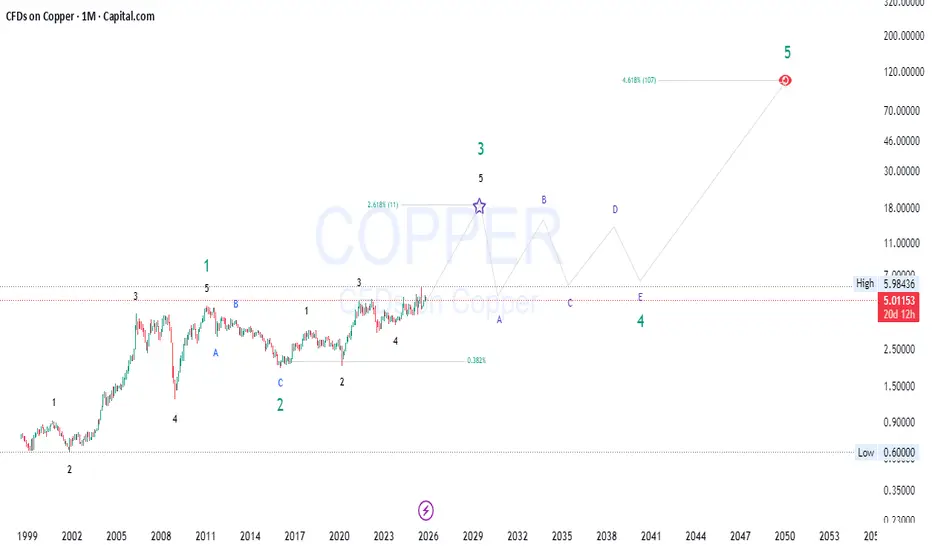
Zooming out to the monthly timeframe , we can clearly see Copper finishing its Wave 3 within a long-term 5-wave impulsive supercycle.
✅ Wave 1 (2001-2008) fueled by China’s infrastructure boom.
✅ Wave 2 (2008-2016) a deep corrective phase, classic ABC zigzag.
⚡ Wave 3 (2016-2026) now unfolding with a 2.618 Fibonacci extension , targeting around $10–11 levels per pound by the late 2020s.
📉 After that, expect a macro Wave 4 correction —likely a complex ABCDE structure —before the final parabolic Wave 5 projection toward $100+ in the 2040s according to long-term fib confluence (4.618x extension).
This aligns perfectly with historical commodity supercycles—massive runs followed by decades of consolidation before exponential growth again.
🧩 Smart Money Concepts (SMC) – Liquidity & Institutional Order Flow
Smart Money has been quietly accumulating since 2016 👀
Liquidity grab below the 2020 lows cleaned out retail longs, allowing institutions to build heavy long positions.
The current structure shows higher highs (HHs) and higher lows (HLs) — the signature of a bullish market structure shift.
Premium/Discount zones show Copper still trading in the discount range of the macro leg (below the 50% equilibrium), suggesting Smart Money accumulation continues.
Expect Wyckoff-style reaccumulation as price coils between $4–$6 before the breakout into the next expansion leg 🚀
🧭 Price Action & Market Structure
Monthly BOS (Break of Structure) confirmed above $5, flipping long-term market structure bullish.
Demand zones at $4.0–$4.5 act as strong re-entry levels.
Liquidity pools above the $6 level (previous highs) likely to be taken out as price seeks expansion to the Wave 3 target zone.
Look for a final shakeout into Wave 4 later in the decade before the next true parabolic move.
This PA structure mirrors textbook “smart accumulation > markup > distribution > reaccumulation” phases seen in previous copper supercycles.
💹 Fundamentals: The Perfect Storm
⚙️ Electrification Boom – Copper is the backbone of EVs, renewable grids, AI data centers, and defense manufacturing.
🔋 Supply Constraints – Global mine production growth slowing while demand from green tech surges.
🌎 Geopolitical Tensions – Supply concentration in Chile, Peru, and DRC adds a geopolitical risk premium.
💰 Inflation Hedge – Commodities entering a reflation cycle as central banks pivot back to stimulus.
All fundamentals point to structural deficits by 2026-2030, aligning perfectly with Wave 3’s macro push.
🧮 Fibonacci Confluence & Cycle Timing
Wave 3 projection: 2.618 × Wave 1 = ~$10.7
Wave 4 retracement: likely 0.382 fib (~$6–$7 zone)
Wave 5 extension: 4.618 × Wave 1 = $100+
The time cycle between major waves (≈10–12 years) also aligns with commodity supercycles, putting Wave 5’s blow-off top around 2045-2050.
🔔 Conclusion: The Long Game
Copper isn’t just a trade — it’s a multi-decade macro opportunity .
While short-term volatility (Wave 4) will shake weak hands, the structural setup screams “supercycle incoming.”
🟢 Bias: Long-term bullish
🕰 Accumulation Zone: $4–$5
🎯 Targets:
Mid-term (2026-2028): $10–11
Long-term (2040s): $100+
⚡ “Commodities move slow… until they don’t.”
The smart money has already positioned. The rest will chase the breakout. Don’t be the last one in.
#Copper #ElliottWave #SmartMoneyConcepts #Commodities #MacroCycle #PriceAction #Fibonacci #TradingView #Investing #Metals
FRACTAL and elliott wavesI think the structure in 2011 is very similar to the one in 2025.
Due to the fractal and Elliott waves, I expect a drop to 3666 on the route I've drawn.
I've already published my chart showing the next steps.

Bitcoin and Ethereum: Bullish and Bearish CountsIn this video, I updated the wave counts and discuss how Bitcoin and Ethereum can, at the same time, be both Bullish and Bearish. The summary is this:
Bullish:
The 2x 5-wave down is an ABC structure wave 2. Next move is wave 3 up.
Bearish:
The 1st 5-wave down is wave 1; the 2nd 5-wave down is wave 1 of 3. Next move is wave 2 of 3 up and then wave 3 of 3 down.
For the cryptos, it is important that Bitcoin will not fall below $98,500 in order for the Bullish scenario to hold.

NATURAL GAS(XNGUSD) | Final Wave 2 Flush Before Mega Wave 3⚡ NATURAL GAS – The Final Flush Before the Supercycle ⚡
After topping out in 2005 , Natural Gas has spent nearly two decades inside a massive corrective structure — slowly grinding lower, retracing, and shaking out every long-term bull in sight.
What we’re seeing now could be the final leg of Wave 2 in that entire supercycle.
This ongoing correction, stretching from 2005 to now, is likely entering its final phase — an exhaustion move that could complete between $1.466–$1.413 .
This zone aligns perfectly with:
✅ Deep 0.786 Fibonacci retracement of the previous impulse
✅ Historical demand and structural support
✅ Liquidity resting beneath long-term lows
✅ Smart Money accumulation footprints beginning to show
If price stabilizes here, we could be witnessing the foundation of a new multi-year Wave 3 , which historically tends to be the most explosive move in the Elliott Wave cycle.
🧭 Technical & Structural Overview
📊 Elliott Wave View:
Wave 1: 2005–2021 impulsive phase
Wave 2: 2021–present, deep ABC correction (now in the C-wave)
Expected completion: $1.466–$1.413 zone
Next: Wave 3 lift-off → potential parabolic move
📐 Fibonacci & Wave Confluence:
0.786 retracement zone → $1.4–$1.5 (ideal Wave 2 termination area)
Wave 3 1.618 extension → $68
Supercycle 2.618 projection → $700+
🧠 Smart Money Concept:
Institutions love to accumulate during despair.
We can already see signs of a liquidity sweep , followed by potential accumulation and a pending market structure shift once price reclaims levels above $3.5–$4.0.
🌍 Fundamentals Align
Global LNG demand continues to rise, especially across Asia and Europe.
US export capacity and infrastructure expansion add long-term bullish pressure.
Supply investment remains underweight — a key setup for future price shocks.
Despite green energy growth, Natural Gas remains the bridge fuel for stability.
This macro alignment supports a generational reversal once the current flush completes.
🎯 Price Map
💎 Wave 2 Completion Zone: $1.466–$1.413
🚀 Wave 3 Target (1.618 ext): $60–$70
🌠 Supercycle Wave 5 (2.618 ext): $700+
⚠️ Invalidation: Sustained breakdown below $1.40
💬 Summary
Natural Gas is approaching the final phase of a two-decade correction — an extremely rare setup in macro wave structure.
When Wave 2 completes, the stage will be set for one of the strongest commodity bull waves in modern market history.
📈 “When the crowd sees destruction, smart money sees construction — and that construction may already be starting around $1.4.”
What are you seeing in your charts? Do you think the bottom is in, or do we need one more liquidity sweep first? 👇
#NaturalGas #NatGasUSD #ElliottWave #WaveAnalysis #SmartMoney #Fibonacci #MarketStructure #Commodities #EnergyMarkets #MacroCycle #CommoditySupercycle #Wave3Setup #TechnicalAnalysis #TradingView #Investing

GRT: Moonvember Updates#GRT reached a new ATL during the late 2025 crash, confirming its long-term downtrend since mid-2021. Historically, it appears to be forming a corrective zigzag pattern, in which passing $0.1 and later $0.5 could signal a major bullish comeback.

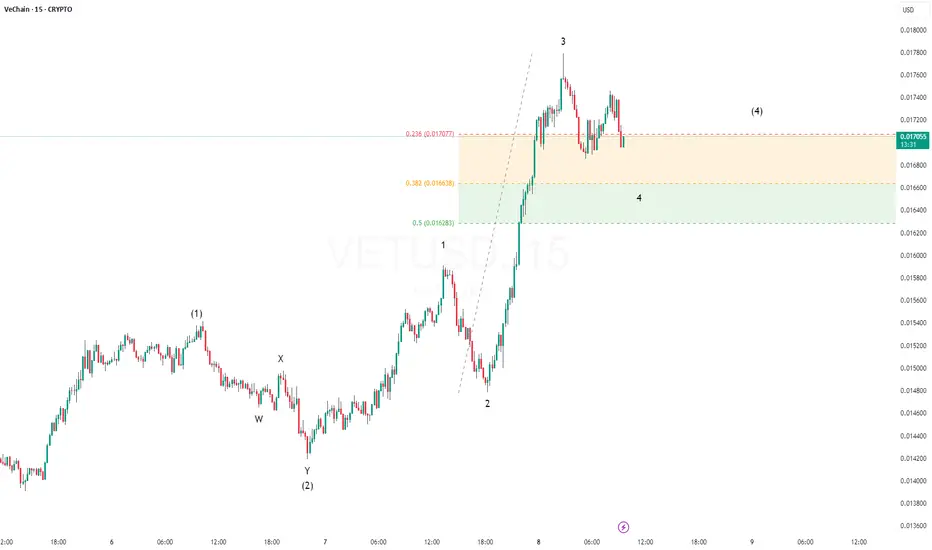
VELO: Moonvember Updates#VELO appears to have completed its corrective 2nd wave from the early 2025 peak, following a strong 2-year impulse wave that began in early 2023.
Passing $0.02 could confirm a bullish reversal, optimistically targeting the 2020–2021 price ranges.

Ethereum: The Jewel of the Money-Printing EraEthereum has once again proven its resilience. After tagging new all-time highs near the $5,000 zone — right in line with prior expectations — the recent ABC corrective move down to the $3,000 region appears to be nothing more than a healthy reset within a much larger bullish cycle.
This correction has shaken out the weak hands while smart money quietly accumulates. On-chain data continues to show strong holding behavior among long-term wallets, with staking and Layer 2 growth tightening supply at a time when global liquidity is expanding again.
Let’s face it — we live in the money-printing era. Central banks can’t stop expanding balance sheets. Debt keeps climbing, interest payments grow unsustainable, and the only escape valve left is higher asset prices. In such an environment, scarce digital assets like Ethereum are not just speculative plays — they’re refuges from fiat decay.
Ethereum isn’t just a coin; it’s the backbone of decentralized finance, NFTs, and Web3. Every new wave of innovation still finds its way back to the ETH network, reinforcing its role as the digital oil of the new economy.
Technically, as long as the $3,000-$2,500 correction base holds, the next impulse wave could target $6,000 and beyond.
In a world drowning in printed money and endless debt, Ethereum remains the shining jewel — a true asset of the new financial order.

QNT: Moonvember Updates#QNT is one of the alt-coins that performed strongly during the 2020 run. With the recent growing interest in older projects, it looks promising for the near future, showing potential to target new ATHs.
#Quant

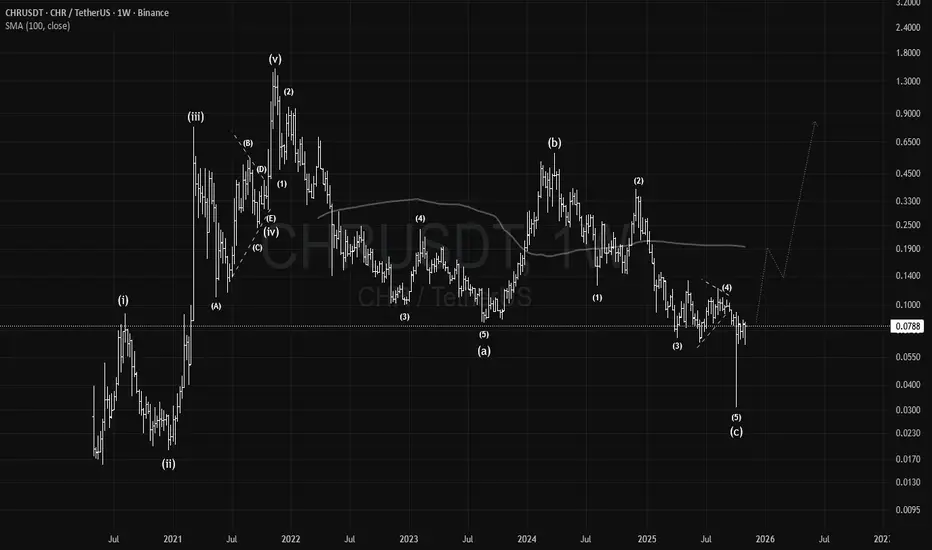
CHR: Moonvember Updates#CHR is showing strong recovery potential after the 2025 bear market. Completing a historical bullish 1–2 wave pattern, it's showing a promising mid to long-term bullish cycle outlook. Eventually it could target new all time highs in the most optimistic scenario.
#Chromia
4th wave correction on going 5th to comestill a little possible upside in minor wave 4 then expecting minor wave 5, then wave 4 and wave 5 again to finish the uptrend
also minor wave 4 can be a flat or a triangle
Nasdaq Short: Peak Confirmed; Bear Market ConfirmedIt is now clear that the bull market ended on 30th Oct and that we have already seen the first completed wave down for Nasdaq that unfolded in clear 5-wave structure. The sub-waves also showed clear 5-wave structure themselves.
We are currently in a wave 2 retracement that is facing the first real support-turned-resistance. However, take note that wave 2 can technically go all the way up to the start of wave 1 without invalidating the idea. So look out for reversal signal or confirmation before you short.

GOLD → The battle for the $4,000 zone. Are the bulls here?FX:XAUUSD is gradually recovering. The price is breaking through $4,000 and trying to stay above the key psychological level. Focus on 4,030–4,050...
Weak employment data, namely a sharp increase in layoffs in October, has heightened fears of an economic slowdown, a decline in government bond yields, and the ongoing correction of AI assets is fueling demand for safe havens.
The probability of a Fed rate cut in December has risen to 69%. The situation is stabilizing somewhat, there is no strong news today, and the market may try to maintain the current backdrop...
Gold retains its upside potential while macro risks remain. The $4000 level is currently acting as key support. Closing the week above this mark will open the way to test $4050.
Resistance levels: 4030 - 4050
Support levels: 4000, 3975, 3956
The dollar and gold are rising, and the inverse correlation is decreasing, indicating that bulls are still trying to keep the market from falling sharply. However, given the lack of drivers, strong news, and a clear fundamental backdrop, I would say that gold is not yet ready to break out of its current range. Consolidation above 4K could lead to a retest of 4030-4050, which in turn could trigger a pullback to local support.
Best regards, R. Linda!

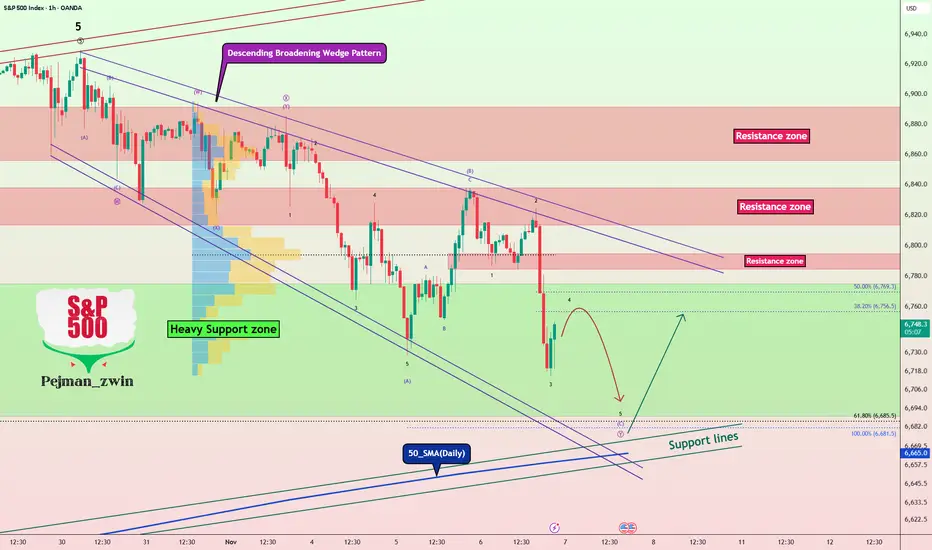
S&P 500 at Make-or-Break Level – Bulls’ Last Chance!As I expected in the previous idea , the S&P 500 index ( SP:SPX ) has reached its target.
Given that the S&P 500 index has a strong correlation with other financial markets, especially Bitcoin ( BINANCE:BTCUSDT )—sometimes even tracking them candle-by-candle—it's a good idea to pay extra attention to the S&P 500 index these days.
Currently, the S&P 500 index is moving in a Heavy Support zone($6,775_$6,689) , although it entered this zone with a lot of downside momentum.
From a classic technical analysis perspective, there's still a chance that the descending broadening wedge pattern will hold. As long as this pattern isn't invalidated, we can still hope for at least a short-term bullish move.
From an Elliott Wave perspective , it seems like the S&P 500 index is completing the microwave 4 of the microwave C of the main wave Y within the descending broadening wedge.
I expect that after the next small dip, the S&P 500 index will start rising again from near the lower boundary of the wedge, the 50_SMA(Daily) , and Support lines .
Note: If the S&P 500 index falls below about $6,650, we should expect further downside. So let's keep an eye on that level.
Please respect each other's ideas and express them politely if you agree or disagree.
S&P 500 Index Analyze (SPX500USD), 1-hour time frame.
Be sure to follow the updated ideas.
Do not forget to put a Stop loss for your positions (For every position you want to open).
Please follow your strategy and updates; this is just my Idea, and I will gladly see your ideas in this post.
Please do not forget the ✅' like '✅ button 🙏😊 & Share it with your friends; thanks, and Trade safe.
Nifty Short term (06.11.2025 to 11.11.2025/14.11.2025) viewNifty has completed its internal wave b of major wave B @25520 and heading towards internal wave c of major wave B.
I’ll be watching for the market to sustain above 25741 atleast 15 min. for a target of 25877-25924 with a SL of 25520 (SL on 15 min. candle close).
Disclaimer: Sharing my personal market view — only for educational purpose not financial advice.

$MSTR Bullish Shark Harmonic completedNASDAQ:MSTR : C wave of this ABC correction has gone beyond A, meeting the requirements of an ABC flat correction. Bullish Shark Harmonic also looks complete.

BTCUSD following impulse correctionits going for impulse correction.
the last leg will be impulse for wave c correction

Now EU could go up againHi traders,
Last week EU went up some more and after that we saw another downmove to take the liquidity just as I've said in previous outlook.
So next week it could go up again.
Let's see what the market does when it comes into the Daily BPR and react.
Trade idea: Wait for price come into the bullish Daily BPR and reverse. After an impulse wave up and a correction down, look for a change in orderflow to bullish on a lower time frame to trade longs.
This shared post is only my point of view on what could be the next move in this pair based on my technical analysis.
But I react and trade on what I see in the chart, not what I've predicted or expect.
Don't be emotional, just trade your plan!
Eduwave

CAC 40: Poised for a Major UpsideThe French CAC 40 index — often overshadowed by Wall Street giants — may be standing at the edge of a powerful long-term rally. Beneath the surface, the forces driving this potential upside are not just economic cycles, but structural realities of modern finance.
Over the past decade, the global economy has entered an era of permanent liquidity. Central banks have normalized money printing as a policy tool — from the Federal Reserve to the European Central Bank. Every market slowdown or banking tremor now meets the same response: more stimulus, more debt, and more liquidity injections.
This infinite expansion of money supply inevitably pushes asset prices higher. Stocks, real estate, and even commodities have become the escape route from currency debasement. And the CAC 40, with its deep exposure to global blue-chip companies like LVMH, TotalEnergies, and Airbus, stands as one of Europe’s most direct beneficiaries.
Another quiet but powerful driver is demographics. Europe’s aging population means trillions of euros are tied up in pension funds — all of which must be parked in productive assets to sustain retirements. With bond yields historically low and inflation eroding purchasing power, the logical destination for this capital is equities.
Add it all up:
Endless government debt expansion
Central banks addicted to printing
Institutional demand from retirement funds
In such an environment, nominally, the CAC 40 almost has no choice but to rise. Whether measured in euros or in real purchasing power, the next leg up could surprise even the optimists.

Bitcoin BTC – Short Term Update📊 CRYPTO:BTCUSD initial reaction failed, and price action suggests one more leg lower to complete a 5th wave from the 10/27 peak. This would wrap up the current impulsive decline and set the stage for a larger corrective bounce.
⚠️ Important Note:
Treat any upcoming bounce as corrective, not impulsive. The structure does not yet support a new ATH scenario unless the market proves otherwise with a decisive bullish shift.
