Stop!Loss|Market View: GBPUSD🙌 Stop!Loss team welcomes you❗️
In this post, we're going to talk about the near-term outlook for the GBPUSD currency pair☝️
Potential trade setup:
🔔Entry level: 1.33660
💰TP: 1.31160
⛔️SL: 1.34654
"Market View" - a brief analysis of trading instruments, covering the most important aspects of the FOREX market.
👇 In the comments 👇 you can type the trading instrument you'd like to analyze, and we'll talk about it in our next posts.
💬 Description: The pound's first downside targets, previously noted, have already been reached, namely 1.33000. Sell priority remains, but given potential volatility (the Fed's interest rate decision is today) and the presence of seller liquidity near 1.34 (sellers's stop-loss levels), a short-term strengthening of the pound is likely. This doesn't change the mid-term trend, and downside targets of 1.32, 1.31, and 1.30 are still being looked for.
Thanks for your support 🚀
Profits for all ✅
❗️ Updates on this idea can be found below 👇
Fed

DXY Approaching 98.900 — Weak Labor Market Could Push Fed DovishHey Traders, in today’s trading session we’re monitoring DXY for a potential selling opportunity around the 98.900 zone.
The index continues to trade within a descending channel and is currently in a correction phase, approaching the upper boundary near 98.900, which aligns with channel resistance.
Fundamentals: Recent data continues to show signs of a weakening U.S. labor market, with job growth slowing and unemployment ticking higher. This softening backdrop increases pressure on the Federal Reserve to adopt a more dovish stance in upcoming meetings, potentially weighing further on the dollar.
Next move: Watching for bearish confirmations around the 98.900 zone — rejection here could resume the broader downtrend.
💬 What’s your outlook on the Fed’s next move? Drop your thoughts in the comments!

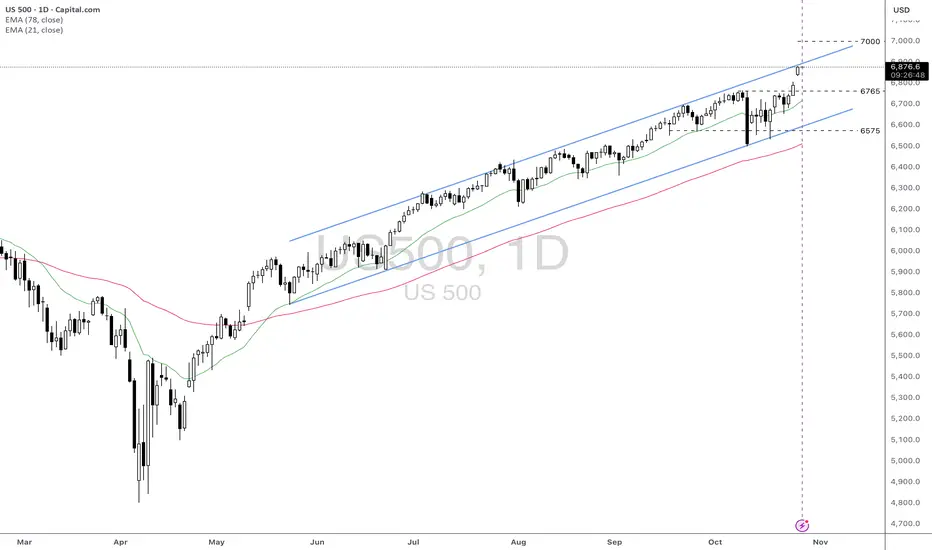
US500: Strong Upward Momentum Approaching 7000 LevelFundamental approach:
- The US500 advanced this week, propelled by strong earnings momentum from tech giants and robust performance in select sectors. Among top movers, Qualcomm rose over 11% following upbeat earnings guidance, while Alphabet and Tesla also rallied ahead of their highly anticipated quarterly results. W.R. Berkley Corporation and Welltower Inc. were notable gainers, reflecting sector rotation and risk-on flows in the index.
- Earnings from the 'Magnificent Seven', including Microsoft, Alphabet, and Meta, drove sentiment, with over 86% of S&P 500 companies reporting results above consensus expectations so far this quarter. Tesla's performance was mixed, while Amazon is set to announce slightly lower profits, but the broader group is still outpacing the rest of the market in earnings growth.
- Tech earnings and the upcoming FOMC decision are key catalysts that may influence future US500 moves. Broad sector participation and ongoing AI investment could sustain upward momentum if macroeconomic conditions remain supportive.
Technical approach:
- US500 created a new all-time high this week after breaching the key level at around 6765. The index showed an urgency in moving upward, creating a gap that remains unfilled. US500 is well above the diverging EMAs, indicating a strong upward momentum. However, the index is approaching the upper bound of the ascending channel, which may limit the price movement.
- If the current gap remains unfilled, the US500 may continue to move upward and test the psychological resistance at 7000.
- On the contrary, rejecting the channel's upper bound may prompt a correction and fill the gap around 6790, retesting the broken level at 6765.
Analysis by: Dat Tong, Senior Financial Markets Strategist at Exness
XAUUSD - Will Gold Continue to Fall?!Gold is trading below the EMA200 and EMA50 on the 30-minute timeframe and is trading in its descending channel. The reduction in its downward momentum in the demand range will provide us with a better risk-reward buying position. A move towards the supply range above the channel will be our next short trade!
Gold prices fell below $4,000 per ounce for the first time since October 10, following a sharp $125 decline.
According to a Reuters survey, the average gold price in 2026 is expected to reach $4,275 per ounce, while silver prices are projected to average $50 per ounce in the same year.
For 2025, the survey anticipates an average gold price of $3,400, up from $3,220 in the previous poll, while the average silver price is forecasted to rise to $38.45 from $34.52 previously.
Analysts at Nomura stated that U.S.–China relations have entered a repetitive cycle of tension, escalation, and temporary détente, likely forming a “new normal” in the long term.
Lu Ting, Nomura’s chief China economist, noted that the world’s two largest economies appear to be settling into a predictable pattern of “strain–escalation–pause”, which may define the framework of their relationship in the foreseeable future.
Recent trade talks in Kuala Lumpur hinted at a temporary easing of friction, with both sides reportedly considering limited concessions, such as extending tariff suspensions and resuming soybean imports from the U.S.
However, deep-seated disputes remain unresolved — including export restrictions on rare earth elements, compliance with trade commitments, and broader geopolitical disagreements — all of which cloud the outlook for bilateral relations.
Lu cautioned that while short-term cooperation may continue due to mutual economic dependence, long-term strategic competition between Washington and Beijing is expected to intensify.
Nomura believes this recurrent cycle of conflict and reconciliation will likely become the enduring pattern of U.S.–China relations.
Such a backdrop implies persistent volatility in global markets, particularly in commodities and technology sectors, which are highly sensitive to trade developments between the two nations.
Investors should prepare for alternating periods of optimism and renewed tension.
Meanwhile, Donald Trump’s proposed tariffs against Canada may turn into a major self-inflicted setback, as the move faces both a legal challenge before the U.S. Supreme Court and bipartisan opposition.
Next week, the Supreme Court is set to hear a case focusing on Trump’s use of the International Emergency Economic Powers Act (IEEPA) to justify these tariffs. Trump initially invoked an emergency declaration related to fentanyl to impose them — despite the fact that such powers are typically reserved for sanctions against U.S. adversaries.
The case represents not only a test of the tariffs’ legality, but also a measure of Trump’s and MAGA’s influence over the Court.
Notably, Senator Lisa Murkowski, a Republican, joined over 200 Democrats in sending a letter to the justices urging them to strike down the tariffs.
The oral arguments are scheduled for November 5, and the final ruling, which could serve as a major market mover, is expected sometime next year.
Currently, prediction markets estimate a 38% probability that the tariffs will be overturned.
At the same time, Morgan Stanley reported that U.S. dollar positioning has turned positive for the first time in several months, reflecting renewed investor confidence in the U.S. economic outlook.
This shift comes amid rising political instability in Japan and France, which has diminished the appeal of non-dollar assets and strengthened capital flows toward the greenback.
Strategists at the bank added that demand for downside protection against the dollar has declined, indicating that investors perceive a low risk of a sharp correction in the near term.
Nevertheless, Morgan Stanley warned that this uptrend might not be sustainable — if U.S. economic data, particularly employment figures, fail to show significant improvement, the dollar could again face renewed downward pressure, and rate-cut expectations from the Federal Reserve could rise.
Finally, Treasury Secretary Scott Bassent confirmed that five candidates have been shortlisted to succeed Jerome Powell as Federal Reserve Chair:
Christopher Waller, Michelle Bowman, Kevin Warsh, Kevin Hassett, and Rick Rieder.
Bassent stated that one more round of interviews will take place, and he plans to submit the final shortlist to President Trump after Thanksgiving, with a final decision expected before year-end.

Can the Euro Break Free From the Dollar's Grip?The EUR/USD currency pair is extending a modest winning streak, nearing 1.1670 as the US Dollar (USD) underperforms ahead of the Federal Reserve's monetary policy announcement. This marks the fifth consecutive day of gains for the pair, largely fueled by a cooling USD sentiment due to the prolonged US government shutdown and a cautiously dovish outlook from the Fed. Despite this short-term momentum, a sustained rally remains elusive. The pair is currently searching for a stronger catalyst, with the upcoming monetary policy meetings from both the Federal Reserve (Fed) and the European Central Bank (ECB) expected to provide the necessary spark for clearer directional movement. Immediate resistance levels are flagged around 1.1728 and 1.1778, while initial support rests at the October low of 1.1542.
The underlying technical picture suggests that while the broader positive trend holds above the crucial 200-day Simple Moving Average (SMA), momentum is weak. Key indicators, such as the Relative Strength Index (RSI) sitting just over 47 and the Average Directional Index (ADX) around 15, imply that the current upward move lacks conviction and leaves the door open for potential renewed losses. Investors are keenly focused on a potential shift in the narrative. A dovish surprise from the Fed, a reduction in the appetite for US assets, or a more encouraging stance from the ECB could provide the requisite lift for the Euro. Furthermore, any genuine progress in easing US-China trade tensions would also likely weigh on the USD and benefit the currency pair.
The fundamental backdrop is characterized by the Washington stalemate and a cautious approach from both major central banks. The nearly month-long US government shutdown continues to erode business confidence and negatively impact growth expectations, contributing to the USD's drift lower. Meanwhile, the Fed is largely anticipated to deliver a 25-basis-point rate cut at its upcoming meeting, maintaining a flexible, "meeting by meeting" policy approach as it balances softer job data against lingering inflation. Across the Atlantic, the ECB is opting to stay patient, with President Christine Lagarde expressing confidence that policy is "in a good place" and future adjustments will be entirely data-dependent, a signal that the European easing cycle may be largely concluded, at least for now.

AUDUSD Eyes 0.6500 as Softer CPI and Weak Jobs Data Weigh on USDHey Traders,
In the coming week, we’re monitoring AUDUSD for a potential buying opportunity around the 0.65000 zone. The pair remains in a broader uptrend, with the current pullback shaping up as a healthy correction toward key structural support.
Structure:
Price continues to respect its ascending trendline, and the 0.65000 area aligns with a strong confluence of horizontal support and dynamic trend structure — a level that has previously attracted strong buying momentum.
Macro Outlook:
The latest U.S. inflation print came in softer at 3.0%, undershooting expectations, while labour market data continues to signal cooling conditions. Together, these developments reinforce a dovish shift in Fed sentiment, weighing on the U.S. Dollar Index (DXY).
At the same time, Gold continues to rally, underpinned by the weakening Dollar and rising safe-haven demand. Given the positive correlation between AUD and Gold, this macro backdrop strengthens the bullish case for AUDUSD in the coming sessions.
Next Move:
A sustained bid around 0.65000 could mark the start of another impulse leg higher — targeting a retest of recent highs if momentum confirms.
Trade safe,
Joe

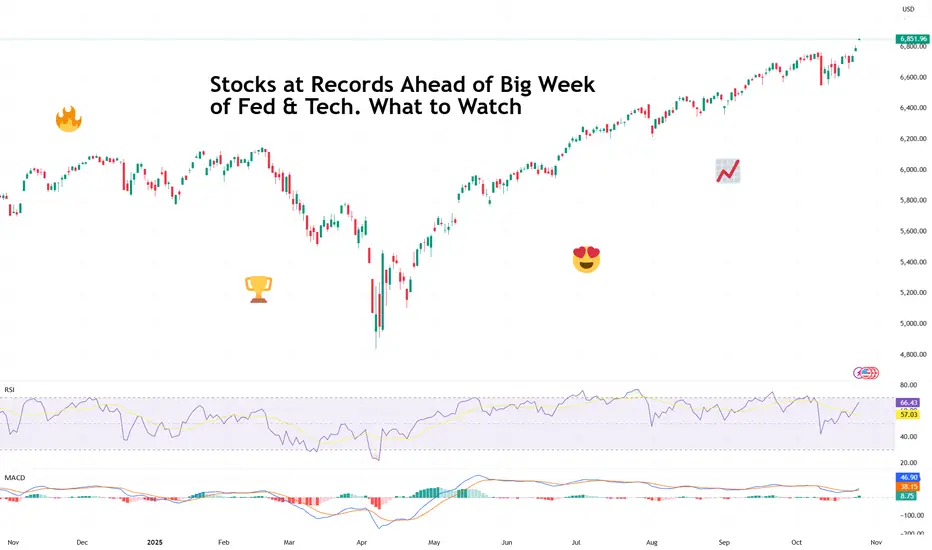
Stocks at Records Ahead of Big Week of Fed & Tech. What to WatchRecord highs, rate-cut optimism, five tech giants on deck — what a time to be a market participant!
It’s Monday, and Wall Street is back doing what it does best — setting new records and pretending not to worry about what comes next.
After a cooler-than-expected inflation print and some diplomatic smiles from Washington and Beijing, all three major indexes are kicking off the week in full throttle.
Last Friday, the Dow Jones Industrial Average TVC:DJI finally closed north of 47,000 for the first time ever, rising 472 points, or 1%.
You know that feeling when you hit every green light on the way to work? That’s what Friday felt like. The S&P 500 SP:SPX climbed 0.8%, and the Nasdaq Composite NASDAQ:IXIC gained 1.2%. Together, the trio ended the week at record highs.
The spark? September’s Consumer Price Index ECONOMICS:USCPI rose 3.0%, slightly below the 3.1% expected. Traders took that as a nod from the economy that the Federal Reserve can keep easing off the monetary brakes.
Odds of at least a half-point in rate cuts by year-end jumped to nearly 97%, according to the CME FedWatch Tool.
Soft inflation, strong sentiment, and new highs — *insert feelsgoodman meme.*
🤝 A Trade Truce (For Now)
Adding to optimism, US and Chinese negotiators sounded unusually positive over the weekend. The two sides reportedly hammered out a trade framework, setting the stage for President Donald Trump and Chinese leader Xi Jinping to meet in South Korea later this week.
Treasury Secretary Scott Bessent said the talks “ought to pave the way” for a broader discussion on tariffs, tech transfers, and everything in between — the kind of vague optimism that markets eat up like comfort food.
For now, investors are choosing to focus on the handshake rather than the fine print. After all, in the markets, hope is often more powerful than details.
🏦 The Fed’s Big Moment
The main event, however, comes midweek. The Federal Reserve is widely expected to cut interest rates ECONOMICS:USINTR by a quarter point on Wednesday. But the real show starts after the decision, when Jerome Powell takes the mic.
Traders will be parsing every word of his press conference for hints on how much further the Fed is willing to go. The tone of his remarks could determine whether markets keep coasting at record highs — or finally take a breather.
So far, Powell has managed to thread the needle: easing just enough to keep growth alive without letting inflation flare back up. But with stocks at all-time highs and job data still missing due to the government shutdown, he’s got a tough balancing act.
💻 Big Tech Takes the Stage
Anyway, peak earnings season is here and if macro policy is the first act this week, Big Tech earnings are the broader narrative.
Five members of the Magnificent Seven — Microsoft NASDAQ:MSFT , Alphabet NASDAQ:GOOGL , Meta NASDAQ:META , Apple NASDAQ:AAPL , and Amazon NASDAQ:AMZN — will all report their latest results.
That’s roughly $12 trillion in combined market cap stepping into the spotlight.
After a few solid years of sky-high expectations around AI, cloud, and advertising recovery, investors are craving proof that the hype is translating into actual earnings.
The question isn’t whether these companies are still dominant — it’s whether they can keep growing fast enough to justify valuations that have already priced in perfection.
Microsoft, Meta and Alphabet kick things off Wednesday, Apple and Amazon step up Thursday. Somewhere between all that, expect social media feeds to explode with charts, hot takes, and the occasional meme about “buying the dip” before it even happens.
🌍 Markets in a Mood
It’s one of those rare weeks when every major force — central banks, geopolitics, and tech earnings — converge into a single market narrative. And, by the looks of it, that narrative is leaning bullish.
Still, keep an eye out for surprises.
Off to you : Where do you think markets are heading this week? Are you excited to snap up some tech shares ahead of the updates or looking to play defense? Share your thoughts in the comments!
XAUUSD - Gold awaits a decisive week?!Gold is trading below the EMA200 and EMA50 on the hourly timeframe and is trading in its range. A break below or above this range will lead to a continuation of the trend in the same direction. A correction towards the demand range will provide us with a better risk-reward buying opportunity. And a rise will provide us with the next short position!
After experiencing one of the worst trading sessions for gold in recent years and failing to achieve its tenth consecutive week of gains, many traders, analysts, and retail investors are now wondering where the gold market is headed next.
Mark Leibovit, publisher of the VR Metals/Resource Letter, took a cautious stance, saying:
“At the moment, I prefer not to hold any position in the market. I’m simply observing and waiting to see how conditions unfold.”
With the U.S. federal government shutdown still ongoing, the release of economic data next week is expected to be limited. As a result, market attention will once again shift toward central banks, particularly the Federal Reserve’s upcoming interest rate decision.
On Tuesday, the U.S. Consumer Confidence Index for October will be released. However, the main market movements are expected on Wednesday, when the Bank of Canada’s policy decision and the U.S. pending home sales data will be published — followed by the Federal Reserve’s policy announcement. Later, the Bank of Japan will provide an update on its monetary stance, and finally, the week will conclude with the European Central Bank’s (ECB) policy decision on Thursday, which could also influence the euro’s direction.
It is widely expected that the Federal Open Market Committee (FOMC) will cut its benchmark interest rate by 0.25 percentage points at the conclusion of its two-day meeting on Wednesday.
The Fed aims to lower borrowing costs and support the labor market through this move. Having kept rates elevated for an extended period to combat stubborn inflation, policymakers now view labor market stability as a higher priority, given that recent data show inflation remains persistent but under control.
According to the CME FedWatch Tool, which tracks rate expectations through federal funds futures, the FOMC is likely to reduce the federal funds rate to a range of 3.75%–4.00%, marking a second consecutive rate cut.
While many Fed officials have expressed readiness to ease rates, opinions still differ on the pace and extent of future reductions.
The outlook for upcoming policy actions remains uncertain, as the Fed continues to balance its dual mandate from Congress — containing inflation while maximizing employment.
A rate cut would bring the federal funds rate closer to a neutral level, where it neither stimulates nor restrains economic activity. Although the Fed kept rates high to fight inflation, the recent weakening in the labor market has become a more pressing concern.
Even though inflation remains above the Fed’s 2% annual target, officials are increasingly worried about the health of the labor market, as job creation has nearly stalled in recent months.
By lowering the federal funds rate, the Fed seeks to reduce short-term borrowing costs, encourage lending and investment, and bolster employment.
At the same time, trade tariffs are contributing both to rising prices and slower job growth. These import taxes have created uncertainty among business leaders, discouraging expansion plans and pushing higher costs onto consumers.
The Fed now faces the challenge of making interest rate decisions without access to many key economic reports it typically relies upon. In fact, the September Consumer Price Index (CPI) may be the last major economic data release the central bank receives for some time.
Other crucial government reports — including employment and GDP growth data — have been delayed or suspended due to the ongoing federal government shutdown, and may not be released at all for October.

NZDUSD Eyes 0.57350 as Fed Turns Dovish! Hey Traders,
In today’s trading session, we’re monitoring NZDUSD for a buying opportunity around the 0.57350 zone. The pair is trading in an uptrend and currently in a correction phase, approaching the 0.57350 support and resistance area, which aligns with the trend structure.
On the fundamental side, the U.S. labor market continues to show signs of cooling, with recent comments from Fed officials acknowledging that the slowdown “needs to be reflected in policy decisions.” This softer tone ahead of this week’s FOMC meeting could reinforce a dovish stance and weigh on the U.S. Dollar, potentially providing support for NZDUSD upside.
Trade safe,
Joe

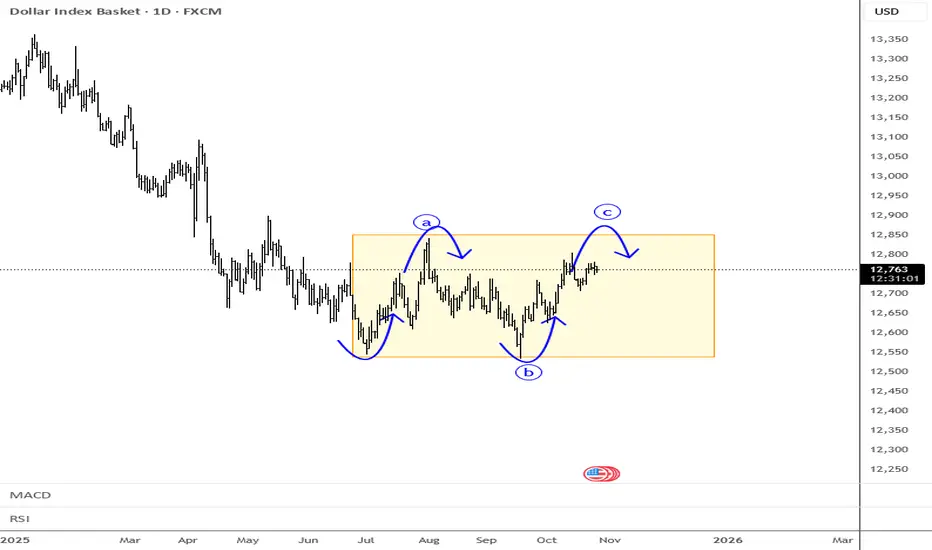
Dollar In Range-And It May Not Be Broken Soon...Stocks are pushing nicely to the upside after some optimism that a deal could be reached between the US and China regarding tariffs, as reported this weekend by Trump himself. He’s clearly driving the market into a risk-on mode.
However, it’s interesting to see that the dollar is still going nowhere; the only FX market showing a more decisive move is the Aussie, which is naturally benefiting from this story.
Looking at the dollar index, no one knows where it wants to move but basic analysis in ranges is simple; "down from resistance, up from the support".
Keep in mind we’re still missing the latest US jobs data, so the outlook for further cuts remains uncertain, and that could keep the dollar moving sideways for now.
Have a nice trading week!
GH
EURUSD Breakout and Potential RetraceHey Traders, in today's trading session we are monitoring EURUSD for a buying opportunity around 1.15600 zone, EURUSD was trading in a downtrend and successfully managed to break it out. Currently is in a correction phase in which it is approaching the retrace area at 1.15600 support.
Trade safe, Joe.

Is the Yellow Metal Ready to BUST Out?Hold onto your hats, traders!
It's been a very wild ride in the FX_IDC:XAUUSD market, proving that what goes up (to a Double Top 🏔️🏔️) must come down (with a vengeance!). After a decisive rejection at the $4381 peak, Gold took a spectacular 8.64% dive last Tuesday, landing sharply at the $4002 low 📉. Talk about a waterfall! 🌊
But don't count the bulls out yet! Gold showed some backbone, bouncing 3.97% back up to $4161 before settling into a cage match. It's now consolidating in a classic Triangle pattern (a.k.a. Compression) 📐, ranging from the $4002 floor up to the stronger resistance near $4135.
The Great Consolidation: Triangle Tension 😮💨
The key takeaway? That $4000 psychological support is a BEAST. 💪 It survived test after test during the Asia, EU, and US sessions last Tuesday and Wednesday! This resilience allowed Gold to build support: first at the $4065 level (the Fib 0.382) and then down to the $4043 low, followed by rock-solid support near the $4000 zone.
As Friday closed out the week, Gold was still testing the lower $4100 area, pulling back to $4096. So, what’s next for the shiny metal?
That $33 candle Friday, was a direct reaction to the release of the slightly softer-than-expected US September Consumer Price Index (CPI) inflation data.
My Outlook: Patience is Gold, But the FED is Key 🔑
While some market watchers are singing a bearish tune 🐻, I see this as a healthy consolidation phase. Gold has already corrected 50% from its massive move (from $3631 low to the $4381 high). While a deeper correction to the 0.618 Fib at $3918 is possible, I don't see the catalyst right now to push it that far.
My bet? Gold will continue to consolidate in $4050 - $4150 range until the major announcement from the FED 🏦. The sharp reversal from the Double Top might just be the clean-out needed to launch prices higher once the rate cut announcement (or even just the dovish talk of future cuts) takes place! The last inflation data was a mixed bag, which gives the FED room to sound reassuringly dovish.
The FED Announcement is the main event this week. Mark your calendars! 🗓️
🔥 Key Economic Events: Central Bank Super Week! 🔥
This week is absolutely jammed with market-moving events across the globe. Get ready for volatility! 🌪️
Monday, October 27, 2025
8:30 AM ET: USD 🇺🇸 Durable Goods Orders (MoM) (Sep)
10:00 AM ET: USD 🇺🇸 New Home Sales (Sep)
Tuesday, October 28, 2025
10:00 AM ET: USD CB Consumer Confidence (Oct)
Wednesday, October 29, 2025 (The Fed Day) 🏦
All Day: HKD Holiday - Chung Yeung Day
9:45 AM ET: CAD BoC Interest Rate Decision
10:30 AM ET: USD Crude Oil Inventories
2:00 PM ET: USD Fed Interest Rate Decision
2:30 PM ET: USD FOMC Press Conference
10:00 PM ET (Approx.): JPY BoJ Interest Rate Decision
Thursday, October 30, 2025 (ECB and GDP Day)
2:00 AM ET: EUR German GDP (QoQ) (Q3)
4:00 AM ET: EUR German CPI (MoM) (Oct)
8:15 AM ET: EUR Deposit Facility Rate (Oct)
8:15 AM ET: EUR ECB Interest Rate Decision (Oct)
8:30 AM ET: USD GDP (QoQ) (Q3)
8:45 AM ET: EUR ECB Press Conference
9:30 PM ET: CNY Manufacturing PMI (Oct)
Friday, October 31, 2025 (Inflation and Month End)
6:00 AM ET: EUR CPI (YoY) (Oct)
8:30 AM ET: USD Core PCE Price Index (MoM) (Sep)
8:30 AM ET: USD Core PCE Price Index (YoY) (Sep)
9:45 AM ET: USD Chicago PMI (Oct)
-------------------------------------------------------------------------
This is just my personal market idea and not financial advice! 📢 Trading gold and other financial instruments carries risks – only invest what you can afford to lose. Always do your own analysis, use solid risk management, and trade responsibly.
Good luck and safe trading! 🚀📊

Wall Street Weekly Outlook - Week 44 2025 [27.10.- 31.10.2025]Wall Street Weekly Outlook – Week 44, 2025 📊💥
Let’s dive into another exciting trading week! 🚀
Rate decisions, month-end flows, and fresh quarterly earnings are setting the stage for strong market moves.
Sit back, enjoy the overview, and dive into the world of banks, hedge funds, and institutional flows — with exclusive insights into how the pros are positioning right now. 🧠💼📈
Extra Lessons: Strategies, setups, and market psychology — everything you need to know for the week ahead. ⚡️
**S&P500 Performance after FED rate cuts**
**Overview: The most important events of the week**
Have a great start to the trading week!
Meikel

EUR/USD: Technical Rebound in Progress — Watch 1.1550🔹 COT (Commitment of Traders)
Euro (EUR)
Non-commercial longs: 252,472 (−789)
Non-commercial shorts: 138,127 (+2,625)
→ Institutions are reducing long exposure and adding shorts, suggesting a loss of bullish momentum on the euro.
US Dollar Index (DXY)
Non-commercial longs: 14,032 (+1,541)
Non-commercial shorts: 24,376 (−1,009)
→ Institutions are adding longs and cutting shorts, reflecting growing confidence in the USD.
Institutional flows confirm a bearish bias on EUR/USD, with strengthening USD sentiment and mild euro weakness.
🔹 FX Sentiment (Retail Positioning)
50% short / 50% long
Market sentiment is perfectly balanced — a neutral retail positioning indicating no clear contrarian signal, consistent with a possible short-term consolidation phase.
🔹 Seasonality
Historically, October tends to be neutral to slightly negative for EUR/USD (−0.2% to −0.5% on 10–20-year averages).
Shorter cycles (2–5 years) show minor positive returns, suggesting that any rebound may be temporary within a broader bearish structure.
Slight downside bias, with potential for short-term corrective upside.
🔹 Price Action
EUR/USD recently reacted from the 1.1530–1.1550 demand zone, showing signs of short-term accumulation.
The descending channel has been broken to the upside, and price is now retesting the previous mid-range support (1.1600–1.1620).
RSI remains neutral but shows a gradual bullish divergence building at the lows.
🎯 Main Scenario:
If 1.1600–1.1620 holds as support, a short-term bullish leg toward 1.1710–1.1780 (former supply area) is possible.
Invalidation: daily close below 1.1550, which would reopen downside toward 1.1500.

GBP/NZD: Smart Money Flows Back Into Sterling🔹 COT (Commitment of Traders)
British Pound (GBP)
Non-commercial longs: 84,500 (+3,704)
Non-commercial shorts: 86,464 (−912)
→ Institutions increased long exposure and trimmed shorts → signaling renewed bullish interest in the pound.
New Zealand Dollar (NZD)
Non-commercial longs: 12,295 (+3,044)
Non-commercial shorts: 33,415 (+6,160)
→ Both positions increased, but the stronger rise in shorts suggests a bearish institutional sentiment on the NZD.
Institutional flow supports GBP strength and NZD weakness → overall bullish bias on GBP/NZD.
🔹 FX Sentiment (Retail Positioning)
69% short / 31% long
📌 Retail traders are heavily short — a contrarian bullish signal aligned with the COT positioning.
🔹 Seasonality
British Pound (GBP): October is historically neutral to slightly positive (+0.2% to +0.4% on average over 5–10 years).
New Zealand Dollar (NZD): October shows mild positivity in the short term (2–5 years) but turns neutral/negative over 10–20 years.
📌 Seasonal takeaway: slight divergence, but GBP retains the upper hand in the medium term.
🔹 Price Action
Price remains within a rising channel, testing the dynamic support around 2.3050–2.3100.
After a pullback from the 2.3450–2.3550 supply zone, price is now reacting from the channel’s lower boundary.
RSI is neutral but showing potential for a technical rebound.
🎯 Main Scenario:
A pullback around 2.3100–2.3150 could provide a new long opportunity toward 2.3500–2.3600, with extension to 2.3800.
⚙️ Invalidation: daily close below 2.2950.
🔹 Trading Outlook
Primary Bias: Bullish
Confluences:
COT → Institutions long GBP, short NZD
Sentiment → Retail excessively short = contrarian long
Seasonality → Favors GBP
Price Action → Rising channel structure still valid
🎯 Technical Target: 2.3500 → 2.3800
🚫 Invalidation: below 2.2950

GBPUSD Breakout and Potential RetraceHey Traders, in today’s trading session, we’re monitoring GBPUSD for a potential buying opportunity around the 1.32500 zone. The pair has recently broken out of its previous downtrend and is now in a correction phase, approaching a key retracement area at 1.32500, which also aligns with strong support on the 4H structure.
Fundamentals:
All eyes are on the upcoming U.S. CPI release, with markets expecting a slightly softer print. A weaker inflation figure could reinforce dovish expectations for the Fed, potentially putting further pressure on the Dollar and supporting GBPUSD upside into the end of the week.
Next Move:
Watching price action at 1.32500 for a possible bullish reaction and continuation toward recent highs.
Trade safe,
Joe

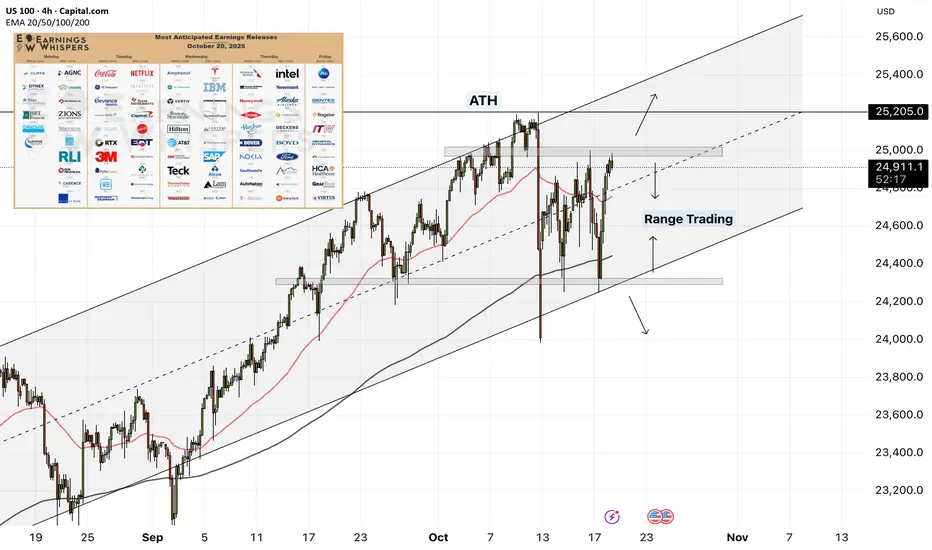
NAS100 - Stock Market, Waiting for a Decisive Week?!The index is above the EMA200 and EMA50 on the four-hour time frame and is in its long-term ascending channel. As long as the Nasdaq is in its range, you can be a seller at the top of the range and a buyer at the bottom. If this range is broken, you can look for new trends in the Nasdaq.
The U.S. Bureau of Labor Statistics (BLS) announced that the Consumer Price Index (CPI) report for September 2025 will be released on Friday, October 24 at 8:30 a.m. New York time (4:00 p.m. Tehran time). This release comes as most other economic data have been delayed due to the ongoing federal government shutdown, which has suspended normal operations.
The CPI report is particularly important for the U.S. Social Security Administration, as it serves as the basis for calculating annual adjustments to retirement benefits and other statutory payments.
In a statement released on Friday, the agency confirmed that it would temporarily recall a limited number of furloughed employees to ensure the timely publication of the CPI report. Originally scheduled for October 15, the release has now been rescheduled for October 24.
This CPI release will be among the few remaining economic datasets published by federal agencies during the shutdown. Since October 1, most data-producing institutions have ceased operations amid political deadlock between Democrats and Republicans that has halted large portions of federal services.
With the federal shutdown continuing, U.S. markets are increasingly relying on private-sector data to gauge the state of the economy. In the upcoming week, indicators such as housing sales and private manufacturing surveys will be released, serving as alternative references for traders and analysts.
Without access to official government data, investors, businesses, and consumers face a heightened level of uncertainty, making it difficult to plan for spending, hiring, and saving decisions.
The CPI report could play a crucial role in shaping the Federal Reserve’s monetary policy decisions, as the FOMC will have access to the data ahead of its October 28–29 policy meeting. Fed officials are currently debating whether to cut interest rates further, and if so, how quickly.
In September, the Federal Reserve lowered its benchmark interest rate to support a weakening labor market by reducing borrowing costs across short-term loans. Another rate cut is widely expected in October, though elevated inflation could slow or prevent further easing.
The Chief Financial Officer of Bank of America (BOFA) stated that the bank expects two additional rate cuts by the Fed before the end of this year.
Meanwhile, Fed Chair Jerome Powell recently warned about downside risks to the labor market, sparking speculation that he might have had early access to the yet-unreleased September employment report. However, a closer examination of his remarks shows no confirmation or denial of such access.
The key takeaway from Powell’s speech was his firm reaffirmation of market expectations for a rate cut later this month, delivered without any sign of hesitation or opposition — a clear and confident signal to investors.
In another commentary, Bank of America highlighted that the current boom in AI data centers is fundamentally different from the dot-com bubble of the early 2000s. The bank attributed today’s expansion to strong semiconductor utilization, healthy cash flows, lower valuations, and a more favorable interest rate environment.
Nonetheless, it acknowledged ongoing concerns about excessive spending and stretched valuations in certain AI sectors.
Finally, the October Bank of America investor survey revealed that recession fears have fallen to their lowest level since February 2022, while optimism about economic growth has seen its strongest jump since 2020:
• 33% expect a “no-landing” scenario (up from 18%)
• 54% foresee a “soft landing” (down from 67%)
• 8% anticipate a “hard landing” (down from 10%).
EUR/JPY: Smart Money Turns to the Yen🔹 COT (Commitment of Traders)
Euro (EUR)
Non-commercial longs: 252,472 (−789)
Non-commercial shorts: 138,127 (+2,625)
→ Institutional traders slightly reduced longs and added shorts → signaling mild weakening momentum on the euro.
Japanese Yen (JPY)
Non-commercial longs: 176,400 (+14,727)
Non-commercial shorts: 96,900 (−3,362)
→ Sharp increase in longs and notable short covering → bullish flow into the yen, reflecting potential medium-term strength.
Combined Interpretation:
COT confirms a bearish bias on EUR/JPY, with euro weakness and increasing yen demand.
🔹 FX Sentiment (Retail Positioning)
83% short / 17% long
Retail traders are heavily short — a contrarian signal that may trigger a short-term bounce, though the broader macro backdrop still favors the yen.
🔹 Seasonality
Historically, October tends to be neutral to slightly positive for EUR/JPY over 5–10 years (+0.5% on average), while 15–20-year data shows a mild negative tendency (around −0.6%).
Seasonal takeaway: neutral bias, with correction risk if yen strength persists.
🔹 Price Action
Price is consolidating below 176.00 after a sharp rejection from the 177.50–178.00 supply zone.
The technical structure shows lower highs, with the ascending trendline now at risk of breaking.
RSI remains neutral but losing momentum.
🎯 Main Scenario:
A break below 175.30–175.00 would open space toward 173.50, then 171.80.
Invalidation: daily close above 176.50.

EUR/AUD Bulls Fighting Back — Retail 76% Short!🔹 COT (Commitment of Traders)
Euro (EUR):
Non-commercial longs: 252,472 (−789)
Non-commercial shorts: 138,127 (+2,625)
→ Institutional traders have trimmed long positions and increased shorts, signaling a softening bullish bias on the euro.
Australian Dollar (AUD):
Non-commercial longs: 41,994 (+1,718)
Non-commercial shorts: 101,584 (+10,148)
→ Sharp increase in short exposure versus longs, reflecting renewed bearish pressure on AUD.
📊 Combined Interpretation:
While the euro shows mild weakness, the Australian dollar remains under stronger institutional selling pressure. The result is a net bullish bias on EUR/AUD, though upside momentum may moderate as euro positioning cools.
🔹 FX Sentiment (Retail Positioning)
76% short / 24% long
📌 Retail traders are heavily short, providing a contrarian bullish signal for EUR/AUD.
This skew supports the institutional view, hinting that short covering could drive the next bullish leg.
🔹 Seasonality
EUR: October tends to be mildly negative on a 10–20 year horizon (−0.20% to −0.60%), but neutralizing into November.
AUD: October is historically flat to slightly positive, though broader Q4 data favors euro recovery over commodity currencies.
📌 Seasonal Bias: Neutral-to-bullish EUR/AUD outlook — seasonality doesn’t contradict the structural bullish setup but suggests limited upside speed.
🔹 Price Action
EUR/AUD remains within a broad consolidation range, oscillating between 1.7650–1.7950.
The pair has recently bounced strongly from the 1.7600–1.7650 demand zone, aligning with a clean RSI rebound from oversold conditions.
Currently trading near 1.7900, approaching the supply area 1.7950–1.8000, which may act as short-term resistance before any continuation move.
🎯 Scenario 1 (Preferred): Continuation higher toward 1.8000, followed by a correction back toward 1.7700 before resuming the broader bullish trend.
❌ Invalidation: Daily close below 1.7650 would invalidate the bullish bias and re-open 1.7500.

NZD/CHF Setup – 94% of Retail Long While Institutions Sell Hard🔹 COT (Commitment of Traders)
New Zealand Dollar (NZD):
Non-commercial longs: 12,295 (+3,044)
Non-commercial shorts: 33,415 (+6,160)
→ Institutions increased exposure on both sides, but short positions rose more aggressively, maintaining a net short stance and signaling structural weakness in the NZD.
Swiss Franc (CHF):
Non-commercial longs: 8,227 (+1,992)
Non-commercial shorts: 31,245 (−1,030)
→ A solid reduction in shorts and rise in longs, indicating a renewed bullish interest in the Swiss franc.
📊 Combined Interpretation:
Institutional flow clearly favors CHF strength and NZD weakness, confirming a bearish bias on NZD/CHF.
🔹 FX Sentiment (Retail Positioning)
94% long / 6% short
📌 Retail traders are heavily long, a strong contrarian bearish signal.
This imbalance highlights the risk of further downside, perfectly aligned with the institutional view.
🔹 Seasonality
NZD: October shows mildly positive performance over 5–10 years, but weakness across 15–20 years → a short-term neutral-to-bullish but uncertain context.
CHF: October is historically positive across all time horizons (5–20 years), with average gains between +0.5% and +1.2%, confirming a seasonal bullish bias for CHF.
📌 Seasonal Conclusion: Seasonality supports a bearish outlook for NZD/CHF, consistent with both the COT and retail sentiment data.
🔹 Price Action
The pair continues to trade within a well-defined descending channel.
Clear bearish breakout from the 0.4660–0.4700 supply zone, followed by a strong daily close lower.
Currently retracing toward 0.4620–0.4640, an area where fresh selling pressure may emerge.
RSI remains neutral with no bullish divergence, confirming sustained downside momentum.
Key supports: 0.4550 (TP1), 0.4500 (TP2).
Resistance: 0.4660 (invalidation above 0.4680).
🎯 Base Scenario: A short-term correction toward 0.4630–0.4640 followed by renewed bearish continuation toward 0.4500.
❌ Invalidation: Daily close above 0.4680.

EUR/USD Breakdown Just Starting? Institutions Loading USD Longs🔹 COT (Commitment of Traders)
Euro (EUR):
Non-commercial longs: 252,472 (−789)
Non-commercial shorts: 138,127 (+2,625)
→ Hedge funds slightly trimmed their long exposure while adding to shorts, signaling a loss of bullish momentum on the euro.
US Dollar Index (DXY):
Non-commercial longs: 14,032 (+1,541)
Non-commercial shorts: 24,376 (−1,009)
→ Positioning shows a clear strengthening of the dollar, as speculators close shorts and increase longs.
📊 Interpretation:
Institutional flow remains decisively in favor of the USD, reflecting renewed dollar strength and moderate euro weakness — keeping a bearish bias on EUR/USD in the short term.
🔹 FX Sentiment
50% long / 50% short
📌 The market is perfectly balanced, showing no contrarian extremes at the moment. However, this neutral sentiment after weeks of long dominance indicates a shift in retail perception, likely preceding a consolidation phase before another bearish leg.
🔹 Seasonality
Based on Market Bulls historical data for EUR/USD:
October has historically been negative, with average declines between −0.20% and −0.60% across 10–20 year datasets.
Seasonality improves from November onward, but October remains a period of weakness for the euro.
📌 Conclusion: The seasonal context is bearish, aligning with institutional positioning and current price structure.
🔹 Price Action
EUR/USD has broken the ascending trendline from August and is now consolidating below the 1.1750–1.1800 supply zone, strongly rejected earlier this month.
The pair trades inside a descending channel, with key support at 1.1550–1.1500 and resistance near 1.1720–1.1750.
The RSI is neutral but showing bearish divergence, hinting at a possible short-term pullback before the next leg lower.
🎯 Base scenario: a corrective bounce toward 1.1700–1.1750, followed by renewed downside pressure targeting 1.1450, with potential extension to 1.1380.
❌ Invalidation: Daily close above 1.1780.

USDCHF 10-year support points to major breakdown to 0.70! USDCHF BREAKDOWN ALERT: Decade-long support shattered – here's why this could be the start of a major move to 0.70 and below!
The Dollar-Swiss Franc pair is setting up for a potentially significant breakdown after breaking decade-long support levels since May. Both fundamental and technical factors are aligning for Swiss franc strength, creating what could be a rare high-probability trading opportunity.
Key Drivers:
Fed Dovish Pivot: Powell's Tuesday signal acknowledged downside risks to job markets, with 97% probability of October rate cuts and two more by December fully priced in
Swiss Franc Strength: CHF has strengthened nearly 9% over the past 12 months, now testing the 0.78 level, while Trump's tariff escalation forces Switzerland to slash GDP forecasts
Technical Breakdown: Multiple analytical methods (range breakouts, Fibonacci projections, and triangle pattern analysis) all point to targets around 0.7417-0.6840, representing potential moves to levels not seen since 2011
SNB Constraints: The Swiss National Bank cannot intervene in forex markets while trade talks are ongoing, meaning the Franc is likely to stay strong by default, with stable inflation data
Don't miss this detailed technical and fundamental breakdown! Like and subscribe for more high-probability forex setups, and drop a comment below with your USD/CHF targets - are you seeing the same bearish signals?
This content is not directed to residents of the EU or UK. Any opinions, news, research, analyses, prices or other information contained on this website is provided as general market commentary and does not constitute investment advice. ThinkMarkets will not accept liability for any loss or damage including, without limitation, to any loss of profit which may arise directly or indirectly from use of or reliance on such information.

Will DXY Sustain The Pressure Amid Current Uncertainties?Fundamental approach:
- The US dollar retreated this week, pressured by expectations of continued Fed easing and signs of emerging economic weakness.
- The Fed's latest Beige Book revealed that economic activity remained flat, with increasing layoffs across districts, and middle- to lower-income households reducing their spending, reinforcing dovish expectations. Chair Powell's scheduled remarks and the ongoing government shutdown, which began on 1 Oct, have delayed critical data. The Sep NFP was not released, and the Sep CPI is rescheduled for Fri, 24 Oct, adding to the uncertainty surrounding the dollar's outlook.
- Meanwhile, the euro gained ground as European currencies strengthened against the greenback, with the dollar down around 10% YTD.
- The dollar may face continued downside pressure as markets await the Fed's October 28-29 meeting, where a 0.25% rate cut is widely anticipated. However, delayed economic data releases could inject volatility into near-term trading.
Technical approach:
- DXY is trading within the ascending channel and retesting the support at 98.60. The index is slightly above both EMAs, indicating the upward momentum persists.
- If DXY remains above the key support at 98.60, confluence with the ascending channel's lower bound, the index may rise to retest the psychological resistance at 100.00.
- On the contrary, breaking below the support and both EMAs may prompt the DXY to retest the following support at 97.15.
Analysis by: Dat Tong, Senior Financial Markets Strategist at Exness
