Learning from losses.AUDUSD: Break-even, fib above 50, distorted fib.
EURUSD: Flat fib, distorted fib, P shape Volume profile, tight stop loss, bad entry for short.
GBPAUD: distorted fib - below 61.8.
GBPUSD: CSFR - poor (candle:size:flow:rato)
Significane of flipping the chart in practice and the difference between looking at a bullish and bearish market.
Fibonacci

CADJPY: Swing Sell at the liquidity void area! Target 105! Dear traders,
I hope you’re doing well. We have a fantastic selling opportunity with the CADJPY pair. The price is approaching the liquidity gap and is likely to fill it. Once filled, we could see a reversal from that point. Our target is set at 105, but feel free to adjust your take profit based on your analysis and strict risk management.
Good luck and trade safely. If you like our idea, please like, comment and follow for more.
Team Setupsfx_

EURUSD — Magnet zones > opinionsPrice is sitting inside a bullish WCL and a bullish BC .
That’s support. Real support. Not vibes.
But here’s the part most people ignore 👇
We still have 5 unreached C targets above and a HTF bearish WCL overhead .
That’s unfinished business.
So what does that mean?
It means this:
Bulls are defended locally (WCL + BC).
Liquidity is stacked higher (open C targets).
HTF bearish WCL above acts as a magnet , not resistance yet.
This isn’t about “bullish vs bearish.”
It’s about mitigation .
As long as price holds this bullish WCL:
→ Expect pullbacks to be bought
→ Expect price to seek higher liquidity
→ Expect reactions at zones, not blind continuation
Only a clean acceptance below the bullish WCL changes the story.
Until then, higher prices are unfinished business.
Not a signal.
Not a prediction.
Just structure doing what structure always does.

3 Scenarios for BitcoinWhen a trend of the peaks that Bitcoin has made since 2016 is taken, we see that after each peak that uses this trend as resistance, Bitcoin enters a correction process up to the HP filter.
Bitcoin, which has done this 3 times in history, is doing it right now. In addition, when I apply a Fibonacci analysis to each correction, I clearly see that Bitcoin is currently in the Fibonacci target area of the last bear season.
There are 3 options for Bitcoin right now. Either it will break this trend for the first time and run without any corrections until at least $120k, or it will be rejected from the trend and pull back to $90k, which the HP filter will reach, and then try the trend once more. On the contrary, the worst case scenario is that it will close below the HP filter for the week and fall to $60k, which means bear season.
Even if the bear season comes, I will switch to the buying side since I think Bitcoin will eventually reach $1m. Therefore, it does not matter how many dollars it is for me.

ATOMUSDT Weekly Supply Holds, Continuation Lower Still FavoredATOMUSDT remains structurally bearish after a prolonged distribution phase, with repeated rejections from major weekly supply zones at the $13–$17 and $40 regions confirming long-term seller dominance. Price has broken down from a compression structure near the $4.0–$3.5 immediate supply, accelerating into a new leg lower.
As long as ATOM trades below this flipped resistance, downside continuation toward the weekly demand at $1.30–$1.05 remains the primary scenario.
Any recovery from the lows should be treated as corrective unless price can reclaim and hold above the $3.50–$4.00 zone on a weekly closing basis.

Bitcoin Roadmap=>End of RallyBitcoin ( BINANCE:BTCUSDT ) has gained nearly +10% in the recent weekly candle so far. The question is where this rally could end up. So to get to that zone, let’s go to the weekly timeframe .
Before we start this analysis, let’s take a look at my last analysis on the weekly timeframe , which was well into the Potential Reversal Zone(PRZ) . ( Analysis time: 9 JUN 2025 )
Bitcoin has now entered the Potential Reversal Zone(PRZ) and Time Reversal Zone(TRZ=June 23 to August 4) , and these zones could be the zones where this Bitcoin rally will end. Do you agree with me?
In terms of Elliott Wave theory , Bitcoin appears to be completing a main wave 5 , as the main wave 3 was an extended wave . The main wave 5 could end at the Potential Reversal Zone(PRZ) .
I expect Bitcoin to start a main correction from the Potential Reversal Zone(PRZ) and could continue to support lines and near the $105(at least) .
What do you think about the end of the Bitcoin rally?
Note: Sell orders near $120,000 are very heavy.
Note: Cumulative Long Liquidation Leverage attractive volume for liquidation.
Note: If Bitcoin goes above $130,000, it can continue to rise to the Resistance lines (near $150,000).
Please respect each other's ideas and express them politely if you agree or disagree.
Bitcoin Analyze (BTCUSDT), weekly time frame.
Be sure to follow the updated ideas.
Do not forget to put a Stop loss for your positions (For every position you want to open).
Please follow your strategy and updates; this is just my Idea, and I will gladly see your ideas in this post.
Please do not forget the ✅' like '✅ button 🙏😊 & Share it with your friends; thanks, and Trade safe.

GOLD: +5000 pips if it reverse from one of our entry! Dear Traders,
Gold has recently become more stable but also more manipulative. Predicting any specific move is really difficult. This is why entering at key levels is so crucial. There are two potential reversal zones: the first is slightly risky but the price movement’s nature can make it more worthwhile and accurate. For a lower risk approach, wait for the price to fall to our safe zone for entry or find another intraday entry opportunity. As always, trading involves extreme risk so ensure you follow risk management and conduct your own analysis and research.
Good luck and trade safely!

GMDC – Setup for All-Time High Breakout?🟦 GMDC – Setup for All-Time High Breakout?
Gujarat Mineral Development Corporation is showing a strong structural setup, indicating potential for an all-time high breakout if momentum sustains.
📊 Technical View
• Repeating box breakout pattern
• Long consolidation range: ₹488 – ₹651
• 19-week consolidation → sign of silent/stealth accumulation
• Sustained move above ₹651 can trigger fresh momentum
• If momentum continues, structure opens up for higher expansion
💰 Trade / Positional Plan
• CMP: ₹615
• Stop Loss: ₹460
🎯 Targets
• ₹773
• ₹901 (extended momentum target)
📌 Trading Approach
• High volatility → keep quantity in check
• Prefer staggered entry
• Strict position sizing
• Patience trade, not a chase
• Avoid reacting to news flow; respect SL
⚠️ Clarification: Independent analysis. No part of Religare involved.
📝 Important: No responsibility for profit/loss. No fees charged.
📉 Disclaimer: Not SEBI-registered. Please do your own research.
✅ Consolidation builds energy. Break above 651 decides the next leg.

Gold (XAUUSD) — Pullback Before Continuation?After a strong sell-off, gold has entered a consolidation phase, where oversold signals appeared on higher timeframes.
This corrective structure allowed price to rebound, and gold is now pausing around the 5000$ zone.
🧠 Technical Perspective
• Higher timeframes showed oversold conditions, suggesting selling pressure was exhausted
• Price reacted upward and is now consolidating after the impulse move
• On the 1H timeframe, a bullish convergence is forming, signaling weakening bearish momentum
📉 Expected Scenario
I expect one more pullback toward the 48xx$ area before price continues higher.
This zone stands out as a potential demand area, where price is likely to find support.
Why?
🔍 Volume Insight
• Historical trading volume around the 48xx$ zone is relatively low
• Markets often reverse in low-interest areas, where liquidity is thin and sellers lose conviction
• This makes the zone a strong candidate for price rejection, rather than continuation lower
📌 Trading Idea
At current levels, price offers an opportunity to accumulate small buy positions, rather than entering aggressively.
This is a positioning zone, not a FOMO entry.
🎯 Key Takeaway
Gold often reverses where the market pays the least attention.
By combining:
• Higher timeframe oversold conditions
• Volume behavior
• Lower timeframe convergence
This pullback appears to be a healthy correction within a larger bullish structure, not a trend reversal.
⚠️ Always manage risk properly and wait for confirmation.

BSE – High Volatility, High Return Potential?🟦 BSE – High Volatility, High Return Potential?
BSE is showing high volatility, and when backed by structure, volatility can translate into opportunity.
📊 Technical View
• Sharp fall after NSE IPO announcement, followed by strong recovery
• Price action suggests upside as long as recent lows hold
• VCP (Volatility Contraction Pattern) forming
• Breakout trigger: Sustained move above ₹3030
• ₹3030 marks long-term horizontal + trendline resistance
• Break above this zone can open strong follow-through
💰 Trade / Positional Plan
• CMP: ₹2903
• Stop Loss: ₹2370
🎯 Targets
• ₹3325
• ₹4027
📌 Trading Approach
• High volatility → keep quantity in check
• Prefer staggered entry
• Strict position sizing
• Patience trade, not a chase
• Avoid reacting to news flow; respect SL
⚠️ Clarification: Independent analysis. No part of Religare involved.
📝 Important: No responsibility for profit/loss. No fees charged.
📉 Disclaimer: Not SEBI-registered. Please do your own research.
✅ Volatility creates opportunity — discipline decides returns.

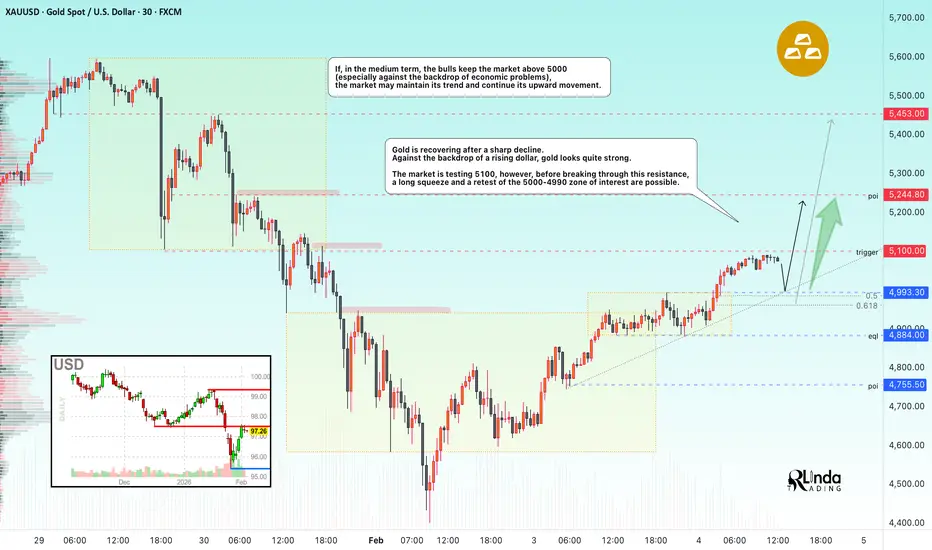
GOLD - Recovery. Pullback before growth to 5250...FX:XAUUSD continues its steady recovery. Against the backdrop of a rising dollar, the price of the metal looks quite strong... The rebound is due to the return of demand for safe-haven assets.
Geopolitics: US-Iran and new stages of escalation in the Russia-Ukraine conflict after a brief respite.
Uncertainty surrounding Fed policy under likely chair Kevin Warsh: on the one hand, expectations of lower rates, on the other, his reputation as a “hawk” and plans to reduce the Fed's balance sheet.
End of the shutdown and dollar weakness: The signing of the funding bill ended the partial US government shutdown, but delays in data releases (employment report) remain, which is holding back the dollar and supporting gold.
Today, the market is awaiting the ADP private sector employment report and the ISM Services PMI. The data will determine short-term market sentiment.
Resistance levels: 5100, 5150, 5250
Support levels: 5050, 5000
Technically, the local trend coincides with the global one, which generally indicates a bullish market sentiment. The formation of local movement and intraday bars indicates the presence of bulls.
Before breaking through 5100 and continuing to grow, the market may test the support zones: 5050 / 5000. A long squeeze and holding the price above key zones may resume growth.
Best regards, R. Linda!
EUR/USD on the 4H chart is showing a textbook golden retest struEUR/USD on the 4H chart is showing a textbook golden retest structure—price broke down from the descending trendline, swept liquidity at the marked lows, and is now reclaiming the 1.1780–1.1830 demand zone as support. The strong reaction from this area suggests bullish intent, with buyers stepping in aggressively after the retest. As long as the price holds above this zone, the path of least resistance remains higher, targeting the 1.2050–1.2100 upside range. A clean 4H close above the trendline retest confirms continuation, while a breakdown back below the grey zone would invalidate the bullish bias and reopen downside risk.

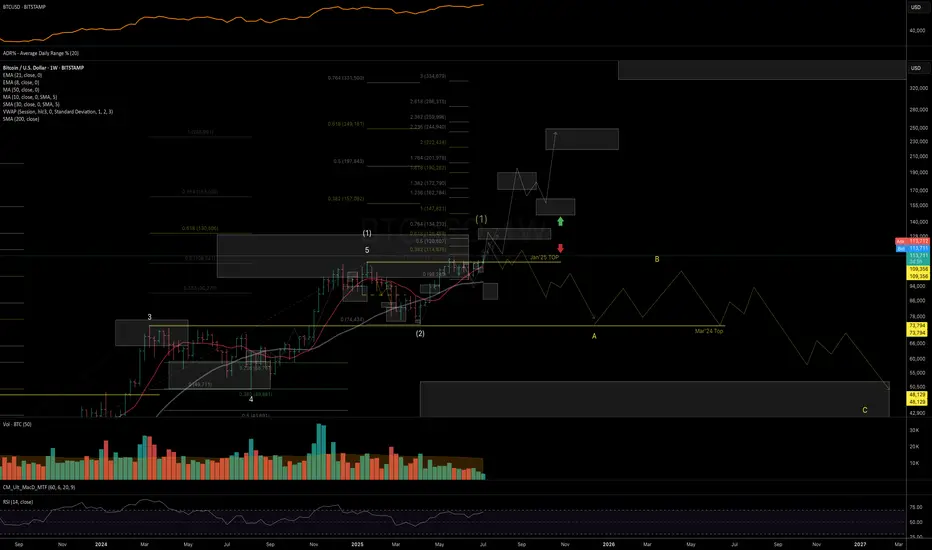
BTC: Macro Structure [Weekly Timeframe]Sharing my current view on the macro price structure of Bitcoin, outlining both main and alternative scenarios based on trend wave analysis.
Macro Trend Overview and Main scenario
The uptrend from the Nov ’22 bottom shows a classic 5-wave impulsive structure, closely aligning with ideal Fibonacci proportions:
Wave 3 peaked within the 1.382–1.618% zone
Wave 4 found support in the 1.236–1.000% area
Wave 5 topped near the 2.000% / 0.618% projection (measured from the Nov’18 bottom to Nov’21 top, projected from the Nov’22 low)
Wave (2) was relatively short in time and depth, but technically acceptable as complete. Given the broader technical structure, macro fundamentals, policy tailwinds, and social sentiment - I consider wave (2) to be finished.
The rally from April’25 low to May’25 high looks impulsive, followed by a clean three-wave pullback into the June’25 low - a structure consistent with the start of a new uptrend, within a larger degree wave (3).
If this is the case, given the fractal nature of the markets, price should Fibonacci proportions similar to the Nov’22 - Mar’24 cycle.
For this bullish count to remain valid, BTC must break and hold above the 126–134K resistance zone. This would open the door to next resistance zone be tested nex: 170–190K and 200–220/250K, where I’d expect a major top to begin forming, possibly, the start of a multi-year higher low formation.
Alternative Scenario
If price fails to break above 126–134K and starts showing reversal patterns, then the yellow count remains valid suggesting the entire trend from Nov’22 has peaked, and BTC could be entering a deep, prolonged correction (as per the yellow count).
In Summary
As long as weekly closes stay above 111.9K, my base case favors continued upside into 125–135K, where the next major decision zone lies:
• Either a short consolidation before breakout
• Or formation of a macro top
For more detailed levels and daily trend structure (including ETH, SOL, XRP, and HYPE), check out my recent video idea and Minds post.
Thank you for your attention and I wish you successful trading decisions!
If you found this idea helpful, I’d really appreciate a boost — and would be glad to have you as a subscriber!
Thank you for your attention and I wish you successful trading decisions!
* I'm keeping the same structure read from my public Mar'24 analysis:
DOGUSDT Supply Zones RejectedDOGUSDT shows a clear downtrend with multiple rejections from immediate supply zones. Price now trading below Immediate supply zone with strong downside momentum, so any pullback towards this zone must be watch for rejection.
Projected drop target: $0.0058–$0.0049 zone (channel extension + measured move lower boundary).
Bias: Bearish continuation until reclaims of immediate supply ($0.0016). Watch for any volume increase on breakdown.

CHFJPY - Exit from consolidation. Breakthrough of resistanceFX:CHFJPY breaks through the resistance of the uptrend, which may accelerate the growth of the currency pair against the backdrop of the weakening Japanese yen.
The monthly timeframe indicates a strong bullish trend. There is no resistance ahead, so growth may be unlimited. The yen continues to fall amid a strong dollar. This fact supports the Swiss franc, which has broken through the resistance structure and is ready to continue growing.
A bullish impulse is forming, confirming the breakout of resistance and the activation of a bullish pattern. After updating the maximum, the price will form a correction and may test support at 201.1 - 201.06 before continuing to grow.
Resistance levels: 201.77, 202.5
Support levels: 201.1, 201.0, 200.65
If the bulls keep the price above the upper boundary of the ascending triangle, it will confirm the market's readiness to continue its main movement.
Best regards, R. Linda!

BlackRock - Coming Down from the TopFrom April to October 2025, a five -wave impulsive move to the upside was formed.
Since October 2025, the stock has been in correction, forming the final wave C .
The correction type is flat .
Key targets:
984 - local correction
909
863
The potential move from the current level is 7-18% .
We assess this move as the beginning of a larger wave C , meaning that the downside move is likely to continue.
---
Subscribe and leave a comment.
You’ll get new ideas faster than anyone else.
---

GOLD - Correction from 4945 before continuing growthFX:XAUUSD continues to recover, but at the same time faces strong interim resistance at 4945. What to expect next?
Gold is recovering after a sharp correction, taking advantage of the weakening dollar amid the US government shutdown: The delay in important data (employment report) is creating uncertainty about Fed policy, putting pressure on the dollar. However, de-escalation with Iran and the deal with India have improved sentiment but limited demand for gold as a safe haven.
The recovery looks like a technical correction on temporary dollar weakness rather than a trend reversal. Further dynamics depend on the development of the shutdown situation and the tone of the Fed.
Technically, gold may form a pullback before rising, or close within the range of 4950-4750 to accumulate potential before further movement.
Resistance levels: 4884, 4944, 5100
Support levels: 4812, 4755, 4696
The first test of resistance at 4944 ended in a false breakout. During the European session, the market may enter a correction phase and test the zone of interest (ascending support line) at 4812-4755 before continuing to rise. The local bullish trend and the relatively weak dollar may support gold's growth.
Best regards, R. Linda!

BITCOIN - Correction to 81K - 82K before the fallBINANCE:BTCUSDT.P is forming a correction after a decline. The market is testing 79,200 (the consolidation boundary), which could trigger a breakout and momentum for a retest of the liquidity zone.
The fundamental background remains weak, there is still no support for the market in this direction, and the crypto winter phase may continue for some time. Statistically, after a sharp fall or a strong trend, the market should move into a sideways range/flat, where accumulation for a trend reversal may form.
Bitcoin is in local consolidation after strong sell-offs. The market is storming 79,200 and, as part of the correction, may break through resistance and head towards the zone of interest 81,000-82,000 before falling.
The cryptocurrency market, like Bitcoin, is in a downtrend. The coin tested support at 75K, but the area of interest (74,500) was not reached. Accordingly, due to the relevance of the liquidity zone, the market may form a short squeeze and return to the target.
Resistance levels: 79,200, 81K, 82,000
Support levels: 77,850, 74,500
I expect two movements from the market. As part of the current correction, Bitcoin may form a breakout of 79200 and an impulse to 81-82K, but bears are likely to keep the market in this zone and provoke a further decline to 77900 - 74500.
Best regards, R. Linda!

USDJPY - Is the correction complete? Return to range...FX:USDJPY returns to an upward trend amid the growth of the dollar and the weakening of the Japanese yen. Focus on 154.5 - 155.0
Against the backdrop of the dollar's growth, the Japanese yen continues to lose value, which generally provokes the growth of the currency pair. If the bulls keep the price above 154.5 - 155.0, we can expect growth to 156.0 - 157.8.
A long squeeze and retest of the 153.0-152.5 zone is forming a reversal pattern as the impact of the Bank of Japan's interventions wears off. The price has returned to the range...
Resistance levels: 156.18, 157.78
Support levels: 155.0, 154.5, 154. 0
The price has returned to the range of 154.5 - 157.78, and technically, a retest of support and a battle between market participants for the key zone are possible. If the bulls keep the price within the range, the market may form growth within the trend.
Best regards, R. Linda!

More Down for BitcoinBTC has yet to find the top of the last cycle for support.
As BTC is in the middle part of its macro S curve, we are anticipating a bear and bull with less extreme moves this and next cycle.
My belief is that BTC may not need to find exact support due to the lack of liquidity in the market. Slow times for the foreseeable?

$BTC: good chance of a bottomI believe there is a good chance that BTC bottomed today. It's not quite the 50% retracement. $70K would be perfect for a 50% retracement.
Holding my IBIT.

NQ Power Range Report with FIB Ext - 2/4/2026 SessionCME_MINI:NQH2026
- PR High: 25442.00
- PR Low: 25362.00
- NZ Spread: 179.0
Key scheduled economic events:
08:15 | ADP Nonfarm Employment Change
09:45 | S&P Global Services PMI
10:00 | ISM Non-Manufacturing Prices
- ISM Non-Manufacturing PMI
10:30 | Crude Oil Inventories
Session Open Stats (As of 12:25 AM)
- Session Open ATR: 434.82
- Volume: 32K
- Open Int: 267K
- Trend Grade: Long
- From BA ATH: -4.6% (Rounded)
Key Levels (Rounded - Think of these as ranges)
- Long: 26521
- Mid: 25264
- Short: 24008
Keep in mind this is not speculation or a prediction. Only a report of the Power Range with Fib extensions for target hunting. Do your DD! You determine your risk tolerance. You are fully capable of making your own decisions.
BA: Back Adjusted
BuZ/BeZ: Bull Zone / Bear Zone
NZ: Neutral Zone

SOLAR INDUSTRIES – Reversal Setup in Making🟦 SOLAR INDUSTRIES – Reversal Setup in Making
Solar Industries India is showing signs of a potential upside reversal after a healthy correction.
💰 Trade / Positional Plan
• CMP: ₹13,685
• Stop Loss: ₹11,600
🎯 Targets
• ₹14,237
• ₹15,248
• ₹17,795
📊 Technical View
• Strong prior uptrend
• Corrected till 61.8% Fibonacci (~₹12,039) and held
• Q3 results supportive, improving sentiment
• Recent price action hints at upside resumption
📌 Approach
• Volatile market → avoid aggression
• Prefer staggered entry
• Strict position sizing
• Patience trade, not a chase
⚠️ Clarification: Independent analysis. No part of Religare involved.
📝 Important: No responsibility for profit/loss. No fees charged.
📉 Disclaimer: Not SEBI-registered. Please do your own research.
✅ Support held + results backing = upside possible, discipline required.
