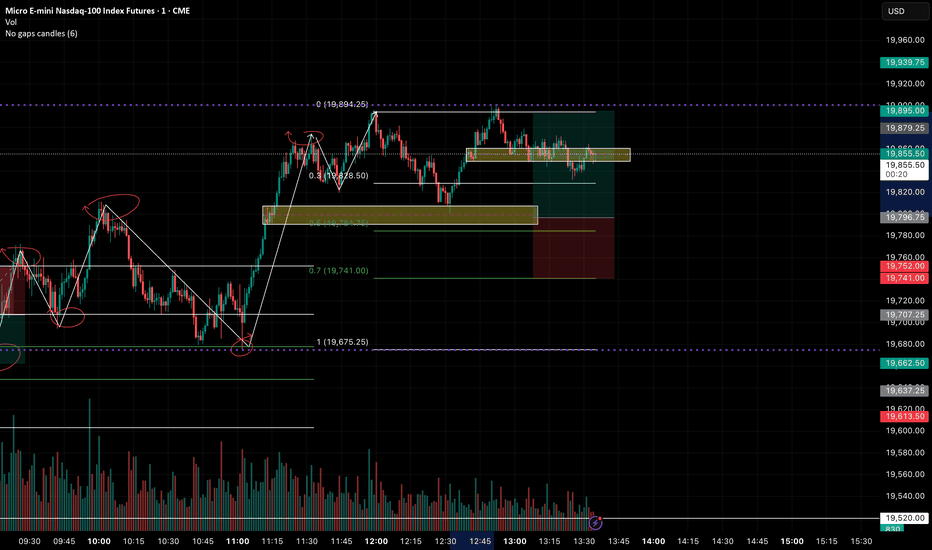
NAS100 EYESI am honestly intending to see some buys, so I did not draft for this video hence my mind was all over the zones and the gaps, I wannit to talk bias but I ended up analyzing to trade. I am sorry about that but we will fix it as soon as possible. Happy Trading.
Lastly, if your plan fail, don't reconsider another entry, especially on the same day.
Fibonacci
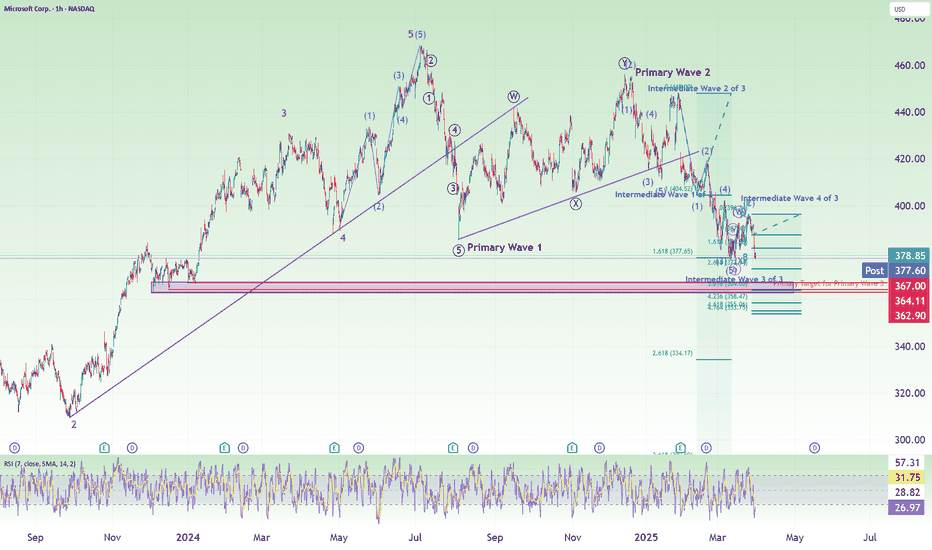
MSFT Short to Neutral: Last Wave 5 of 3 (Target: $364)A video update to Elliott Wave Counts and Price target for MSFT (and Nasdaq).
A summary:
1. Intermediate wave 3 of 3 has ended.
2. Intermediate wave 4 of 3 has ended in a double combination.
3. We are in Minor wave 3 of Intermediate wave 5 of Primary wave 3.
4. Using Fibonacci Extension from Minor wave 1 of against overall Intermediate wave 5 gives us a target of $364, which is within a support zone. This is the Primary Wave 3 completion target.
5. Using Nasdaq, we also noted that we still have a little bit more to our final target.
Market Neutral: Nasdaq, S&P500, Nikkei225, Hang SengThe equity indices has fallen to our target and we are seeing 5-wave completions. So I think it is a good time to reduce your shorts and move from a short to a more neutral stance. The current price is also a good support for the indices.
Remember that there is a weekend risk here also.
Good luck!
Nvidia Update New levels to the downside Longs and shortsIn this video I discuss the market structure shift in Nvidia and highlight new levels to be aware of to the downside . Potential here for longs and shorts .
Tools used Fibs, Gann Square , Speed Fan , Order blocks .
Please Like and comment if you have any questions . Have a great Day and thanks for your support
Nikkei, S&P500, Nasdaq, Hang Seng Short: Educational UpdateThis is really an extra video that I made because I see some educational value. I use Nikkei 225 to show repeating of patterns and the fractal nature of the market, S&P and Nasdaq to demonstrate the usage of Fibonacci levels and study of historical support and resistance, and finally Hang Seng to discuss on placing stop losses and how noise in lower time frames may require us to ignore certain "unclean" waves.
Overall, I still put this idea as a short because all the indices used are still short ideas in my opinion.
Good luck!
Nasdaq short: Hit Previous High and 2 Fib Ext TargetsAs explained in the video, I have 3 hits that suggests that we have hit the peak for Nasdaq:
1. Hit previous high made on 20th March 2025.
2. Fibonacci Extension where wave 5 = 1.618x Wave 1.
3. Entire wave e = 2.618x Wave 1.
Important here is the stop loss of around 19978. This is a positional play, meaning to ride this position if it goes in our favor.
Good luck!
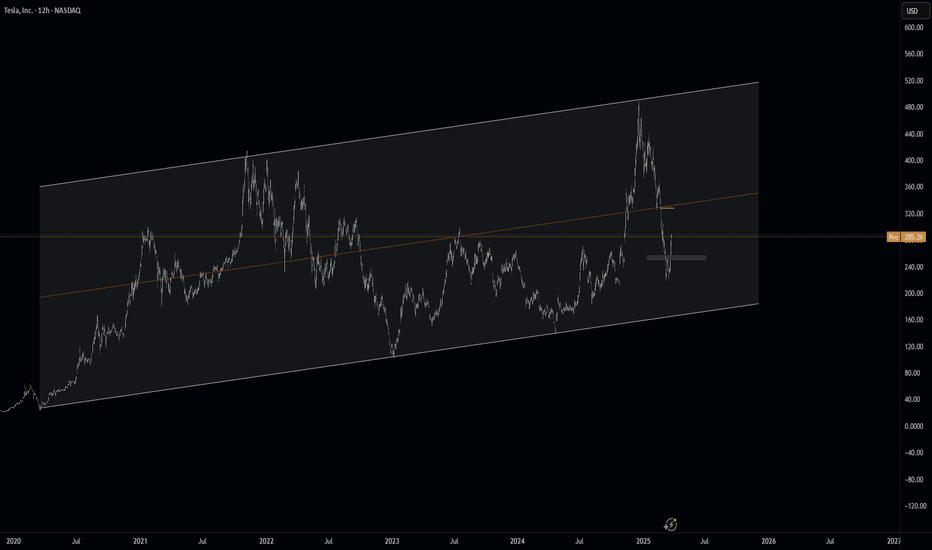
General Market Ramblings - $BTCUSD, $TSLA, $GDX, $DAL, $BBEUHi, all. Wanted to get something published for the first time in awhile. Unfortunately my mom passed away recently and that has been something I have been going through. It is therapeutic to record something and get it out to you all. I am approaching feature film length on this one, so kudos if you make it through the whole video.
I just wanted to discuss some general market thoughts here - especially as we are now in an interesting time. I hope you do find some value here! Believe me, this really is just scratching the surface of my market thoughts and the different stocks that I have thoughts on. But again, really just wanted to get something out to you guys. Even if you tune in for a minute or two, thanks for watching! It means a lot. Feel free to provide feedback as well of course.
As always, a lot of my thoughts are based on the "Time @ Mode" method that we discuss in the Key Hidden Levels TradingView chat.
Also, as always, these are strictly my thoughts and opinions. I am not a professional and I encourage you to do your own research before making investment/trading decisions. These opinions are not financial advice.
Assets in this video: COINBASE:BTCUSD , COMEX:GC1! , NASDAQ:TSLA , AMEX:GDX , CBOE:BBEU , NYSE:DAL , maybe others I forgot about.
The Ultimate Golden Zone to Close Shorts and flip Long TESLA Must Watch Analysis on TSLA revealing the ultimate golden zone to fill your Longs and close your shorts.
In this video I pinpoint a high probability zone of where to take the next long .
I have used a suite of Fibonacci tools to include TR Pocket , Trend based fib, pitch fan , 0.618, VWAP and volume profile to determine the best Long.
Plan GOLD 6/3/2025 Today the market has no outstanding news, and is waiting for NonFarm news tomorrow
so today is likely to be a sideways range in the area from 2900-2925
Hope you get good buy sell prices in this range
SELL: price range 2925-2930
SL: 2935
TP: 2900
BUY: price range 2890-2900
SL: 2895
TP: 2925
Google Update - Trade this range and new ATH Identified Update video on the google Long that has been planned since early FEB. The level has now been hit and we got a nice reaction off that level . In this video I look into where I think we go next and how price plays out .
In the video I use the following tools TR Pocket FIB , 0.618 FIB , Pivots , Parallel Channel and the Fixed range Vol Profile.
If we stay range bound inside the channel then we have the potential to see a new high on google at the top of the channel in confluence with 1-1 ext + tr pocket expansion .
Watch the video and mark the levels on your chart and ensure to set your alerts .
Dont forget to Boost the chart Please and i welcome any questions TY
Dollar Index - End of January AnalysisJune 2022 was the last time we witnessed a major bullish run reaching into macro imbalances @ 110.
Donald Trump was elected in November 2024 and ever since, we have witnessed a similar run, in which Dollar punished those who were short based on market trend and sentiment at the time.
Many long term traders saw 106 as ‘safe’ price point to place their buystops but the market had other plans… As the algorithm repriced higher upto 106, it became a self fulfilling prophecy where more buy stops were triggered increasing the likelihood of a low resistance liquidity run.
Highs for the month is 110.176
Lows for the month is 107.969
Bearish bias negated if I see a candle body closure above the monthly highs and CE of 6 month sellside imbalance.
Long Term Nifty Outlook Based on 2023 Fibonacci levels. Based on the Fibonacci levels plotted from the point from where rally started on 2023 towards the peak and reverse Fibonacci from the same 2 points. We can make the following deduction:
Major Supports for Nifty can be around: 22500, 22169, 21845. Negative scenario as of now seems to be near 21227, 20507, Father line support of Weekly chart 19710. Worst case scenario 19170 or 18769. (Possible but improbable) But you never say never.
Major Resistances for Nifty will be at: 23214 Fibonacci level resistance, 23351 Weekly Mother line resistance, 24921 and then previous peak at 26277. Best case scenario for Nifty to make a come back with a bang and show us a new high near 28000+ levels (Possible but improbable) But your never say never.
Disclaimer: The above information is provided for educational purpose, analysis and paper trading only. Please don't treat this as a buy or sell recommendation for the stock or index. The Techno-Funda analysis is based on data that is more than 3 months old. Supports and Resistances are determined by historic past peaks and Valley in the chart. Many other indicators and patterns like EMA, RSI, MACD, Volumes, Fibonacci, parallel channel etc. use historic data which is 3 months or older cyclical points. There is no guarantee they will work in future as markets are highly volatile and swings in prices are also due to macro and micro factors based on actions taken by the company as well as region and global events. Equity investment is subject to risks. I or my clients or family members might have positions in the stocks that we mention in our educational posts. We will not be responsible for any Profit or loss that may occur due to any financial decision taken based on any data provided in this message. Do consult your investment advisor before taking any financial decisions. Stop losses should be an important part of any investment in equity.


