Kiwi/Loonie Outlook into the new year! Combo correction? Price has started into a correction. Appears to be making an expanded flat combo, to me at least! Traders, what do you think? If you think it's a good Idea give me a thumbs up, and as always I appreciate comments! :D
Flat

USDJPY. Another possible count. Waves 4-5 are pending. Big FlatThis is another possible scenario. As wave 4 with large correction has not been seen yet then
we have enough room to reach the top and that means Flat Correction...Big!
Range 125.86-98.78 is in play then.

AUDUSD - Bat pattern confluence with ABC Flat correctionOn the very last piece of data we have, It's currently in a correction for more down.
Like if you agree with our analysis and comment if you have alternative in mind.
Thank you.

Shortterm downsideSee some more downside ''Possible C-wave'' completion
Potential move up near-term..
Watch for possible ''ending diagonal''
on lower time frame for market reversal

EURUSD watching for corrective channel breakdown I am tracking EURUSD corrective structure since very long. I am expecting that we will see bearish wave in coming days and i think EURUSD again will hit 1.04000 in coming days. If price breakdown small corrective channel with impulse then look for sell and in case price break up this small corrective structure and break back the channel line in then look for sell from upper flat channel line.

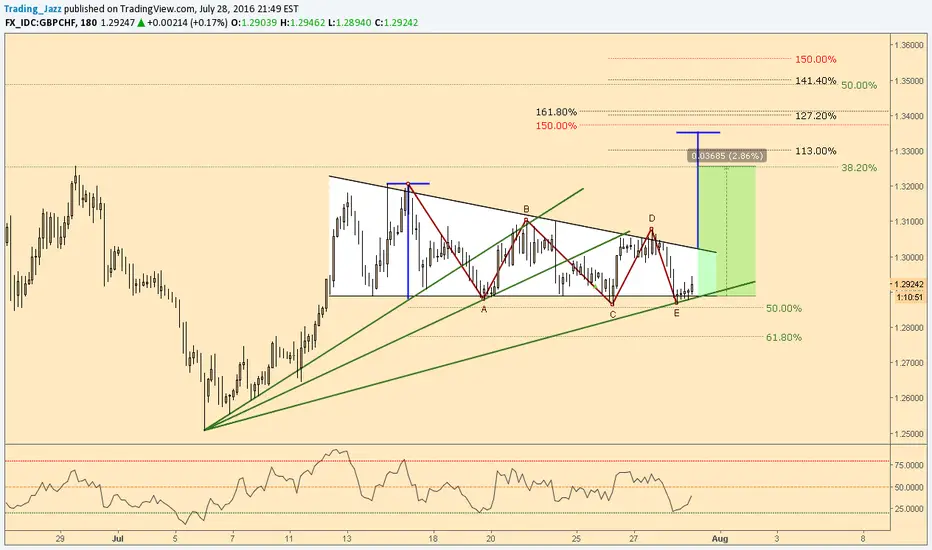
GBPUSD Free Trade Signal on 16th September, 2017Trading Strategy:
Shorter term, we are expecting one more upside and same time nearest resistance need to be break to confirm the trade.
Action
We are suggesting buy limit @ 1.3290 with 1.3190 stoploss and target should be 1.3540.

Exide Looks Excited with Positive Breakout from ConsolidationAfter few weeks of consolidation in rectangle formation, the price action broke out from the rectangle on Wednesday indicated strong buying pressure and thereon the price action remained and managed to close above 184 resistance level for three continuous day. Buyers look excited and shall move prices up.
As per Elliott Waves , there is completion of Regular Flat corrections (ABC) and now the price action is in a Wave 3 of impulsive move.
Target 1: 192
Stoploss 179

GOLD GOLD SHINES TO BUY (XAU/INR) - FLAT CORRECTION COMPLETESAs per Elliott Wave Theory, Gold chart indicates a completion of a Flat ABC Correction that signals a new wave to upside. This is a good time to invest or take a swing trade position in this before the festive season begins in India where we generally see rise in the Gold 0.73% market. Take positions with stoploss at 87200 Target 1: 90000 then Target 92400.

Gold (XAU/USD) Completes Flat Correction, Next Bullish UpmoveThe price action is been ranging in a rectangle consolidation where it is forming a Regular Flat Correction pattern that indicates completion of corrective phase and beginning of a new bullish move or trend. A good risk to reward setup.
Keep a Stoploss: 1290
Target 1: 1340
Target 2: 1375

A nice Flat!A nice Flat is forming, and the calculated confluence zone seems to confirm the price target.
When you look at the oscillators, you can easily see that they topped at critical levels.

Lululemon Athletica (LULU). Could Halve Its Value.Flat correction. Target for C is at the trough of the wave A = 36.26. Way to go!


EURUSD - Is this a potential turning point to the downside?EURUSD is approaching an interesting level @ 1.1230-60 where there are multiple confluences, the 0.618 retrace level from the brexit drop, a 1x extension @ 1.1226 from a ABC flat correction and it looks like there's a possible 5 waves up which fits the flat profile, also the top of a corrective channel is in this vicinity.
Watch this space!

Companies set for a bumpy ride?? FTSE Flat CorrectionBritain has voted today to exit the european union. What will this mean for the top 100 companies? Looking at the larger context on monthly timeframe of FTSE, I can see a corrective elliott wave pattern known as a flat. If this count is indeed correct, an impulsive decline is on the cards in the coming years
What do you think?

USDJPY in final leg of a Flat correction. Buyers Beware!The pair has been trading in a corrective manner last few days in what looks like a textbook flat correction. Five ways can already be counted for wave C. After the completion of the pattern expect a decline in five waves taking out the low of 103.50
Buyers Beware!

Final Leg of Diagonal Pattern - 1.1050 Key LevelWith the Fed beating the drum of rate increases, many are looking for the Greenback to fundamentally strengthen. Though when and if the Fed actually increases rates is a debate for another day, let's look at the technical picture for EURUSD.
It appears we are finalizing the 4th wave of a 5 wave diagonal pattern. We're looking for this 4th wave to terminate in the 1.1050-1.1200 price zone, then pivot higher to for a 1.17 retest. Two items can help with the long trigger:
1. Live trader positioning through FXCM - it currently reads +1.01...look for this number to drop to signal a bullish signal
2. A break above the red resistance trend line would signal the mood of the market could be shifting towards bulls.
If this occurs, one could place a stop loss just below the recent swing low while targeting 1.16 for a positive risk to reward ratio.
If prices meaningful penetrate 1.1050, then we'll need to consider the alternate patterns.
Best of luck and happy trading!

NETFLIX - will it fill the gapsAn appreciation of the beauty of Gann box. Netflix goes to a perfect 38.2% deep retrenchment and flip back - creating a possibility of ABCD pattern for the flat triangle.
Will it fill the gaps at the bottom that it didn't fill last time?
I can see that it will go to 58.53.
But before that will it goes back up and fill the gap that it created today before it moves down ?
GANN rocks - he always rocks.

DOLLAR INDEX (DXY). Reversal is ahead.Hello there!
I think we are nearing the end of this large flat correction.
93 area should be watched closely for reversal (wave A low).
Downside of the trend is also there.
Daily charts show Momentum divergence already.
Best wishes!

EURUSD. History may repeatHello there!
I want to share with you my observation.
I think we will have repeat of past action.
Right leg develops in more clear but also more violent manner.
Best wishes!
Aibek

eurusd longHello Traders , please click on all the pinned charts to see how it is possible to use wave analysis to forecast the charts.

EURUSD - COULD RESUME IT'S BULLISH CYCLEMy last EURUSD chart suggesting long entry was about 4 months ago, which took longer and retraced more than originally anticipated. Whilst we were waiting for longer term bullish move, we took 2 short trades which were also published subsequently, see chart links below.
Now we have long awaited low formed in December 2015 just above March 2015 low, which could prove to be higher low of the bullish cycle
Looking at the price actions since March low to recent December 2015 low it appears very interesting as follow:
1. From March Low to August high we note a clear 3 swings zigzag move shown in GREEN.
2. Similarly, from August high to December low also appear to have a 3 swings to the downside show in GREEN.
4. The final part of the swing down to Dec low was clear falling wedge with accompanied momentum divergence on H4.
3. The December low formed at just below 88.6% retracement of the move up from March to August.
The above observations, if correct, suggests that we have a potential Flat correction which according to Elliott Wave principle is formed by 3-3-5 (a-b-c) formation where wave B needs to retrace around 90% of prior wave A and both waves A & B should have 3 swings each, hence meeting the criteria.
If the interpretation is correct, then what should develop now is a 5 wave impulsive move to the upside, which could at least retest August high or even make new higher high.
Of the 5 wave it appears we have already completed leading diagonal wave 1 and retracement zigzag wave 2, and could be in very early stage of wave 3 in progress which should be quite strong.
Summary: Therefore, we could consider 2 possible entries
1. The ideal one is that we can get pullback to enter around 1.08 or better and is a preferred entry.
2. If it don't get a pull back to 1.08 level then use a smaller time frame to confirm entry or wait till we have a breakout above 1.1.
In both cases the initial stops could be just below 1.07 which is invalidation level, however, it might need to be reviewed as bullish trade could still materialise provided we hold above December low.
We might stay in this range for few days but seasonality also supports EURUSD gaining noticeably commencing from late Jan to early Feb
Warning: This is my interpretation of price action using TA approach that I consider helps me the most but could be completely wrong. Therefore as always, do your own analysis for your trade requirement and ignore my views.
For those who appreciates my analysis, select to follow me and the chart for notification of future updates. Indicate you like my analysis by thumbs up, comments and sharing it with others. If you have an alternative idea then please be constructive and share for all to learn from.
Thank you for taking the time to read my analysis.
DanV
danv-charting.com
