GDX


The NAKetship? Woah this is interestinganyone remember NAK? it's been just long enough for everyone to forget about it.

PAAS - A random IdeaDaily Formations allow for bigger moves. I'm interested in shorting on this backtest.
Also, my interpretation of what might happen. 90% chance it won't follow the path correctly, but I like to let the mind wander.

DBC - More Odd Charts - Commodity Drop Underway?Crude oil has been getting absolutely walloped for weeks now, having lost over a third of its value recently. Looking at the chart of USOIL I recently posted, it seems to me we are definitely primed for a bounce. The bounce will ultimately fail, but we’re really, really oversold at this point.
One thing I noticed is that the commodity ETF, symbol DBC, has actually cracked the channel which has been in place for years. Like I said above, I think oil will bounce, but I wouldn’t be surprised to see DBC hit resistance in the form of that now-broken channel.
DBC is the basket of commodities

Short GOLD (Fed day tomorrow)Gold is about to sell off that based on my indicator. Once it breaks, sell it to 1130 area.

"Two Corrections" - February and October 2018 "Two Corrections" - February and October 2018
Pattern symetry.

Long GDXJ (Alternative view from previous analysis)One week passed, GDXJ starting to form a bottoming signal (rising volume and bottom wick). With the equity market (SPY) so weak, gold may have the chance to breakout.
If GDXJ breaks above the triangle trend line, that will be a false breakdown. That we should expect a huge rally ~20-30% from current level.
The only risk is yield is about to explode, so if gold is negatively correlated to yield, this is unlikely to happen.
Trade plan: wait til the break above trendline to initiate long position. Otherwise, I am still short biased.

Long TBT (Short Treasuries and Long Rates)Daily TBT shows bull flag and seller exhaustion. Weekly bullish cloud ahead.
All major EMAs supporting the move higher, which means rates going to explode much higher. Bullish dollar $DXY and bearish gold $XAUUSD and miners $GDXJ $GDX

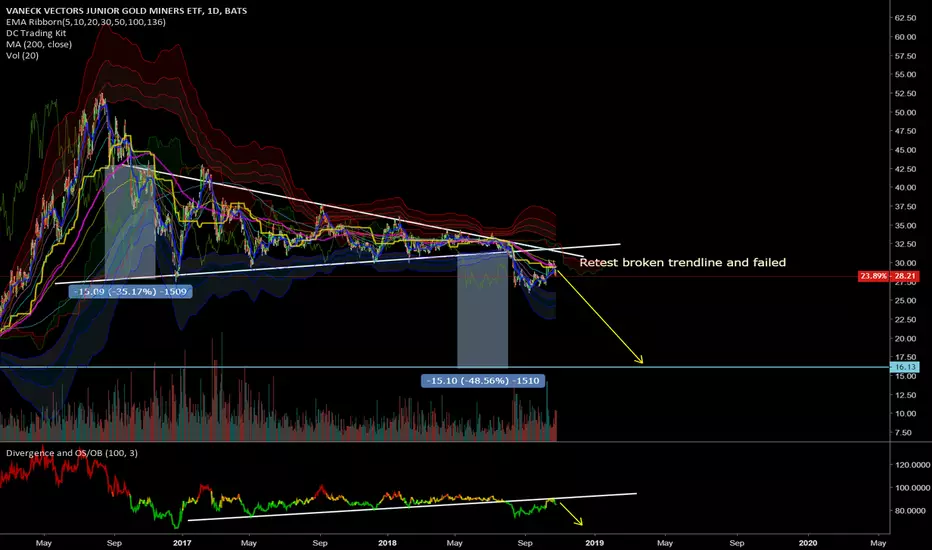
Short GDXJ (Gold miners)The big consolidation triangle broken this summer. It has retested the broken TL and failed.
My indicator retested the broken TL too and now its heading down. The next few weeks will be brutal for gold and miners.
Short TP: 16
GDX RectangleWhether we break up or down, I expect a move of about $4.82. High-side target of $30, low-side of $16.

Gold might be getting ready for another leg higherFrom my blog:
It looks we could see a correction in the US stocks too. We’ve been seeing it in other markets already. But don’t be mistaken, I think this could only be a correction within a secular bull market. I don’t want to be calling for a 2008 style crisis yet however it can always evolve into something bigger.
There is an interesting rotation happening right now though. Gold has been a mess in the past months and even years. Many were expecting it would start trending higher. I was one of them for some time but I’ve put that thesis aside until now. I’m starting to see reasons for joining the party! What if this correction in the US stocks will ignite it?


Gold, GDX & GLD: Correlated Markets Lead To BIG Profits! If you trade Gold, you must know that the GDX and the GLD are both derivative markets of Gold and are closely correlated since they both track aspects of Gold. So when either one of these move, then you must look to the other one's and see what they are doing, going to do or done already. They can give you precious clues as to what the other markets are going to do. In most cases, GDX and GLD are forward indicators of Gold itself.
Why do I point this out? Well, what you see in my charts is my analysis of these 3 markets and you can see that they are all closely mimic each other. Now, I follow the mantra of "Trade what you see. Not what you think". That means I look at each chart by itself and not dependent on what any other chart is doing or projected to do. But when I analyze Gold, I also do look to GDX and GLD as well and see if my independent analysis of those markets agree with what I see in Gold. But VERY IMPORTANT to keep in mind is that NO MARKET correlate 1:1 to any other market. What that means is that Gold can move 100 pips while GDX might only move 25 pts.
In any case, I'm showing you these trades that I took and issued out to my followers to illustrate this point. Just a tip for you the next time you decide to trade in Gold.
Want to know more? Look below to my signature box or PM me.

THE WEEK AHEAD: AA, NFLX EARNINGS; USO, GDX, XLB, EEM, IWMWith broad market volatility ramping up over the past week here (see VIX, VXN, RVX), premium sellers can afford to be picky here, since the board is alight from here to Sunday with implied volatility ranks in the 70's for ... well ... a ton of stuff.
For earnings, my eye is on AA and NFLX with nearly ideal rank/implied metrics for volatility contraction plays.
NFLX (rank 64/implied 61), a perennial earnings-related volatility contraction fave, announces earnings on Tuesday after market close. Due to its size and its having a tendency to move bigly around earnings, I would go defined: the November 16th 285/290/385/390 is paying 1.87 with a buying power effect of 3.13; a ten-wide with the same short strikes, 3.53, with a buying power effect of 6.47.
AA, announcing on Wednesday after market close: 93/52. In my mind, small enough to go full on naked: the November 16th, 71% probability of profit 31/40 short strangle is paying 1.72 with a 50% max take profit of .86; the at-the-money skinny, quasi short-straddle -- the 35/36, 3.78, with a 25% take profit of .95.
Alternatively, it's been somewhat hammered here and is within 5% of 52-week lows which may make it suitable for a bullish assumption play: the 32/39/40 Jade Lizard is paying 1.00 on the nose with no upside risk and a low side break even of 31, a 13% discount over where the underlying is currently trading.
On the non-earnings front: the top five funds in terms of implied volatility rank are USO (81/30), GDX (71/32), XLB (68/27),* EEM (66/27),** and IWM (63/26); the top five ranked by 30-day implied: EWZ (58/44), UNG (36/41),*** XOP (52/36), OIH (56/36), and GDXJ (60/34).
* -- Possible bullish assumption directional; new 52-week low.
** -- Possible bullish assumption directional candidate: new 52-week low.
*** -- Possible bearish assumption directional candidate: new 52-week high.

GDX VANECK VECTOR stands in front of a large rise...GDX VANECK VECTOR stands in front of a large rise. Your exchange rate can practically doubled. Therefore, gold miners' stocks are a good investment. The exchange rate increase can be achieved by building a triple wave structure. The first correction can start at 29 usd levels. Its size is 0.25 D1 ATR. Next, the second wave structure could be built with a target price of 35.89 usd. Then a 0.5 D1 ATR correction is expected and further rise. The third wave structure can reach 43 usd levels.


Jnug to gold Well I havnt done gold for a while now but it appears to me that a nice setup to go long is presenting itself. This ICL has been stretched but that just makes me more confident that I have a safe Jnug play here. I am not about to try to guess what kind of wave count we are in. However, If we have started our move down into the larger C wave then this move up could look like what I drew. However, It could also be the beginning of the end of the B wave which would take us higher than I drew. I will be just fine with a move back up to the 1300 range before reassessing the pattern. Jnug will do well. but I will be watching its movement along with gold to get a feel for how powerful this move will be.
Jnug chart

Bearish Cycle Wave in the Gold Miners ETFA double Zig-Zag in the (c) – wave would achieve a measured move equal in length to the (a) – wave.

THE WEEK AHEAD: MU EARNINGS; EWZ, GDX, USOAlthough both FDX and ORCL announce earnings tomorrow (Monday) after market close, the underlying with the implied volatility metrics I generally look for in a volatility contraction play are present in MU, which announces Thursday after market close.
With a rank of 82 and a 30-day of 60%, the 70% probability of profit 39/52.5 20-delta short strangle is paying 1.66 at the mid-price. Since it's been beaten down a bit recently, I could see skewing that setup a bit to the bullish side, and or capping off call side risk via a Jade Lizard (the October 19th 39/49/50 would do the trick -- it's paying 1.13 at the mid with no upside risk above 37.87).
As far as non-earnings are concerned, implied volatility is present where it's been for a bit -- in EWZ (rank 99/implied 55) (the Brazilian exchange-traded fund), PBR (88/72) (Brazilian petro), CRON (76/124) (cannabis), GDX (66/30) (gold miners), and USO (58/27) (oil). Naturally, there's also TSLA (69/54), but with earnings in 52, you might as well wait for the full-on, earnings related volatility expansion/contraction ... .

Bullish GoldXAUUSD is bull basing and traveling in wave 3. I'm expecting it to target 1265-1270 for short-term.
Cheers!
