US Stocks Record High with Record Retrenchment, What's HappeningIn January alone, Microsoft, Google, Meta, and other tech companies have collectively cut more than 21,000 jobs. Furthermore, last year marked one of the worst periods in recent memory, with approximately 260,000 tech professionals losing their jobs.
Normally, we expect to see cost-cutting measures during a contraction stage, as was the case during the Dot-com bust, rather than during a period of growth like today. So, what is currently happening?
My name is Kon How, my work in this channel, as always, is to study behavioral science in finance, discover correlations between different markets, and uncover potential opportunities.
Micro E-mini Nasdaq Futures and Options:
Minimum fluctuation: 0.25 index points = $1.25
Code: MES
Disclaimer:
• What presented here is not a recommendation, please consult your licensed broker.
• Our mission is to create lateral thinking skills for every investor and trader, knowing when to take a calculated risk with market uncertainty and a bolder risk when opportunity arises.
CME Real-time Market Data help identify trading set-ups in real-time and express my market views. If you have futures in your trading portfolio, you can check out on CME Group data plans available that suit your trading needs www.tradingview.com
Inverted Hammer

EURNZD - Bearish ReversalHarmonics pattern of AB = CD shows the potential reversal zone from where it is now going bearish. EURNZD shows a divergence on RSI. Inverted Hammer is already created. Short Entry on previous HL will be a confirmation of trend break.

Hammer of Trend ChangeThe Hammer and Inverted Hammer candlestick patterns, two powerful tools adept traders employ for reversals.
If you appreciate our charts, give us a quick 💜💜
Here’s what you need to know:
1. Understanding the Essence:
Hammer: This pattern typically emerges at the culmination of a downtrend, indicating a potential bullish surge. Its small body and extended lower wick signify the bears' struggle to maintain lower prices.
Inverted Hammer: Contrarily, this pattern usually appears at the end of an uptrend, foreshadowing a possible bearish move down. Its small body and prolonged upper shadow denote the weakening grip of the bulls.
2. Decoding the Signals:
While Hammers don’t provide direct trading signals, they suggest a shift in momentum. Traders often see them as a sign of potential upward movement after a downtrend.
Inverted Hammers, appearing after an uptrend, hint at a potential reversal. The failed attempt by the bulls to sustain higher prices signifies a looming bearish sentiment.
3. Crafting Your Strategy:
When dealing with Hammers, traders might enter immediately after its formation or wait for confirmation with a bullish candle. Setting a stop-loss just below the recent low and targeting a significant resistance level is a common strategy.
For Inverted Hammers, a similar approach can be employed, focusing on prior support-turned-resistance levels. Vigilance and additional technical analysis are crucial for accurate predictions.
4. A Word of Caution:
While these patterns are robust, they should never be sole trading indicators. Combining them with other technical tools enhances accuracy and confidence in your trades.
5. Practice and Precision:
Prior to real trades, practice these strategies on demo accounts or paper trading. Platforms like TradingView, Vestinda and others like MetaTrader offer a conducive environment for refining your skills.
Incorporating Hammer and Inverted Hammer patterns into your trading toolkit empowers you to detect potential trend shifts. Remember, in trading, nuanced insights can translate into significant profits. Happy trading!

Bounce at $5 support MSOS had an inverted hammer at $5 support. Traditionally seen as a reversal signal. Let's see how things go.

Bullish Opportunity on EURJPYBullish Opportunity on EURJPY - Inverted Hammer Pattern Indicates Potential Upside Move
Greetings, traders!
Today, I want to share an exciting trading opportunity on the EURJPY currency pair, which appears to be trading bullish on the 1-hour chart. After conducting a thorough analysis, I have identified a compelling bullish inverted hammer candlestick pattern, suggesting the continuation of the upward trend. Let's delve into the details of this trade plan.
Trade Plan:
Entry Point 1 (Market Execution): 155.878
Entry Point 2 (Market Execution): 155.874
Stop Loss (SL): 155.124
Take Profit 1 (TP1): 156.604
Take Profit 2 (TP2): 157.344
Reasoning:
Bullish Inverted Hammer Candlestick Pattern: The recent candlestick formation on the 1-hour chart has revealed a bullish inverted hammer pattern. This indicates a strong rejection of lower prices and potential buying interest in the market, validating the bullish sentiment.
Confirmed Bullish Trend: The presence of the bullish inverted hammer pattern further reinforces the bullish outlook on EURJPY. The pattern signifies a possible continuation of the existing uptrend, providing traders with an opportunity to capitalize on potential upward movement.
Trade Execution:
To take advantage of this bullish setup, I have executed a market order with two entry points. The first entry is at 155.878, and the second entry is at 155.874. This approach allows for a staggered entry strategy, which may result in a better average price and risk management.
Risk Management:
In order to protect our capital from potential adverse market movements, I have placed a stop loss (SL) at 155.124. This level represents the maximum acceptable loss for this trade setup, and it is essential to adhere to proper risk management principles.
Profit Targets:
For potential profit-taking, I have set two take profit levels. The first take profit (TP1) is at 156.604, aiming for a moderate resistance level. The second take profit (TP2) is set at 157.344, targeting a stronger resistance level. Traders are advised to consider adjusting their positions or securing profits at these levels.
Please be aware that trading involves risk, and it is vital to perform your own analysis and risk assessment before making any trading decisions. This post serves as educational content and should not be considered as financial advice.
Happy trading, and may the markets be in your favor!
Disclaimer: The information provided here is based on my analysis as a technical analyst and may not be accurate or suitable for everyone. Trading involves substantial risk, and you should only trade with capital you can afford to lose.

How to Trade Inverted Hammer CandlesticksHow to trade inverted hammer candlesticks with entries and stop levels.

Trading Series – The ManagementMost of us will spend about 90% of our time thinking of what to buy and at what price we should get in. In fact, that is only 10% of work done.
Focus on this scenario instead - “After getting into a position, how are we going to manage it with either a calculated loss when market go against us or how should we take profits when market perform better than our expectation?
As usual we will do a few case studies on how I manage my positions for this year.
Today’s content:
1. 90% of us – Spending too much time on “Getting in”
2. Steps to manage our trades after an entry?
If you have been following, today’s is the 7th tutorial in our Trading Series:
1. “The buy strategy”
2. “The sell strategy”
3. “Developing long & short-term view”
4. “Choosing between the time frame”
5. “The entry”
6. “The exit”
7. “The management”
Example 1
Micro E-Mini Nasdaq Futures
Minimum fluctuation
0.25 point = $0.50
1 point = $2
10 points = $20
100 points = $200
1,000 points = $2,000
Example 2
E-Mini Nasdaq Futures
Minimum fluctuation
0.25 point = $5
1 point = $20
10 points = $200
100 points = $2,000
Disclaimer:
• What presented here is not a recommendation, please consult your licensed broker.
• Our mission is to create lateral thinking skills for every investor and trader, knowing when to take a calculated risk with market uncertainty and a bolder risk when opportunity arises.
CME Real-time Market Data help identify trading set-ups in real-time and express my market views. If you have futures in your trading portfolio, you can check out on CME Group data plans available that suit your trading needs www.tradingview.com

"Biting Point" Signal in Every Turn for 2022Stay-tune for the video version shortly, we will do more in-depth study.
Micro E-Mini Nasdaq Futures
Minimum fluctuation
0.25 point = $0.5
1 point = $2
10 points = $20
100 points = $200
Disclaimer:
• What presented here is not a recommendation, please consult your licensed broker.
• Our mission is to create lateral thinking skills for every investor and trader, knowing when to take a calculated risk with market uncertainty and a bolder risk when opportunity arises.
CME Real-time Market Data help identify trading set-ups in real-time and express my market views. If you have futures in your trading portfolio, you can check out on CME Group data plans available that suit your trading needs www.tradingview.com
I hope this tutorial will be helpful, in enabling you to read into the market with greater clarity.

Tug of War Among Central BanksThere is a tug of war situation among the central banks to hike interest rates. What is the bad and the good that will come out from this?
i. Last week of October, European Central Bank officials announced another massive 75 basis point hike, increasing interest rates at the fastest pace in the history of the euro currency.
ii. This week, the Federal Reserve is expected to increase rates by 75 basis points for the fourth time in a row.
iii. The Bank of England could join the club on Thursday.
Content:
. The Interest Rate race has just started, why?
. The impact on different currencies
. It may not be all bad news, why?
With higher interest rates, it attracts investors to buy its currency, in this case the USD.
Currency is always a pair, when USD strengthens, the other side weakens.
When a currency gets weaker, it is very bad news for inflation because they will have to pay more on their imports.
Therefore in order to counter inflation, one of the best measures is to hike rate
Expect more volatility in the currencies market, meaning currencies will take its turn to move.
And if you are a trader, you should welcome volatility. Because with volatility, there are opportunities.
GBP Futures
0.0001 = $6.25
0.001 = $62.50
0.01 = $625
0.1 = $6,250
1.1000 to 1.2000 = $6,250
Disclaimer:
• What presented here is not a recommendation, please consult your licensed broker.
• Our mission is to create lateral thinking skills for every investor and trader, knowing when to take a calculated risk with market uncertainty and a bolder risk when opportunity arises.
CME Real-time Market Data help identify trading set-ups in real-time and express my market views. If you have futures in your trading portfolio, you can check out on CME Group data plans available that suit your trading needs www.tradingview.com

ETH 2 Signal Candles w Opposite MeaningHanging Man
and...
Inverted Hammer
Beside each other...
Choose your side wisely! (I set this trade idea as "Long" if we hold this break in market structure @ 1270 area).

BTC - 1W ThoughtsThe Inverted Hammer candlestick formation occurs mainly at the bottom of downtrends and can act as a warning of a potential trend reversal.
After a long downtrend, the formation of an Inverted Hammer is bullish because prices hesitated to move downwards.
Sellers pushed prices back to where they were at the open, but increasing prices shows that bulls are testing the power of the bears.
**This is not a signal and should be used for educational purposes only.**

Wish you all the bestGL to all...
Do your research, trust nobody, look first then leap, and don't trust your "feelings" that much...

SHOTING STARHere we can see the formation of an inverted hammer which is usually called as a shooting star. This generally appears in a bullish run and indicates a reversal in the trend. The very next candle is a conformation of the shooting star. If someone had taken an appropriate put trade they could have easily gained 454 points.

Granules Pain is not over yet!!!Looks like pain is going to stay
Inverted hammer at trendline resistance
Can come to 290 quite soon

NZDCHF DOUBLE BOTTOM - SWING LONG POSSIBILITYWe have had the pair ranging for two month forming two Doji Patterns on MN and a inverted hammer last week. Possible swing long for the pair.

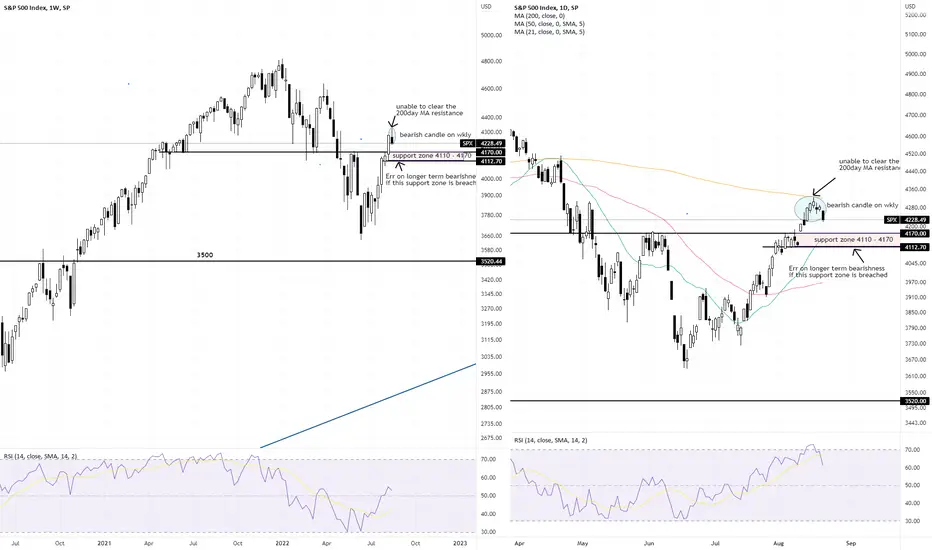
SPX (and NDX) - correction or turning bearish?We had a good bullish run lasting almost 2 month before ending in a rather brutal sell off last Friday. The weekly bearish inverted hammer candlestick suggests we could have potentially more downside in the coming days/week (unless negated by a rebound that took out last week's high, though the odds look slim at the moment).
However, whether we have turned longer term bearish remains to be seen. For SPX, we have support coming up at around 4170 and in the worst case 4110. I will definitely erred on bearishness should we have a close below 4110.
Similarly for Nasdaq, I will err on bearishness if we have a close below 12900.
This is coming from a swing trader's point of view (not a long term investor nor a short term scalper. Stay safe and do have stop losses in place.
p/s There will always be individual stocks that do not act with the flow of the overall market indices. It is still possible to ignore market noises and trade those stocks if the technicals lined up.
Disclaimer: Just my 2 cents and not a trade advice. Kindly do your own due diligence and trade according to your own risk tolerance and don't forget that money management is important! Take care and Good Luck!
[Candlestick Patterns] Just need to know these three!#Candlestick #CandlePattern #Tocademy #Tutorial
Hello traders from all over the world, this is HAMZA_ZDH=)
I was unexpectedly surprised by many of you who liked and supported my last post about the basic concept of TA( Technical Analysis ). Today I prepared a brief lecture about the Candlestick Pattern, one of the most fundamental phenomenon and behaviors that traders must be well-informed. In fact, we should be very familiar with these textbook contents and interpret it in a glimpse on the technical chart unconsciously. Just like we don't pay direct attention about each breathes when breathing, like we don't care each and all of the alphabets when we speak, or like we don’t perceive location of each keyboards every moment as we type, this very technique should be performed automatically and quickly by observing dominant formations of candlestick bars.
As a matter of fact, comprehending market trends and price actions only by referring to the candlesticks is yet too spurious. It should be used in such a way to weight on certain scenarios in a macroscopic view, rather than deriving precise and specific PRZ(Potential Reversal Zone)s and distinguish the accurate market trend. It’s never like ‘The price must go up because this pattern just appeared’. Furthermore, I strongly believe that the reliability of the candlestick pattern strategy is declining especially in recent financial market, where we encounter countless non-traditional and abnormal situations that were not very common in the past. Hence among the existing ‘Textbook’ candlestick pattern strategies that can easily be found on Google , there are particular patterns that are still very reliable on current market and there are ones that are not as reliable as it used to be. So here, I will organize everything very clearly for you guys.

Lots of high volume outside reversals today in growth stock landThe market has been moving higher nicely over the past few days, particularly in growth and tech stocks, however, throughout today's session we saw that momentum reverse with a large number of outside reversals and stocks trading from green to red.
Most short and medium-term trends remain in tact higher.


Why Is BTC about to begin a bullish rallyBTC is about to begin a bullish rally and here's why:
Looking at the graph, we can see a candle with an extremely big wick pointing upwards has formed (A.K.A. Inverted Hammer). There are also other reasons why it's about to happen. They include:
- Price hitting the 200 EMA and not crossing
- Price hitting the 61.8% fib line
- The downtrend is losing its momentum (hence the decreasing candles)
- The timeframe is 1 week
There is still a chance, however, that the price will keep dropping. But because we are talking about multiple types of traders, we can safely say BTC is about to begin a rally.
NOTE: this is not investing advice. If you would like to go against my advice, feel free to. There is nobody stopping you.

CADCHF | BULLISH trade OPPORTUNITY 🚀- CAD/CHF is trending towards the upside on multiple time frames following moving averages.
- We are seeing a bullish engulfing candlestick closure on the 4-hour chart, and an inverted hammer pattern on the 1-hour time frame, indicating buying pressure.
- The overall trade setup, has the potential to reach around 100 pips because of a potential monthly resistance re-test.

[Candlestick Patterns] Just need to know these three!#Candlestick #CandlePattern #Tocademy #Tutorial
Hello traders from all over the world, this is Tommy =)
I was unexpectedly surprised by many of you who liked and supported my last post about the basic concept of TA(Technical Analysis). Today I prepared a brief lecture about the Candlestick Pattern, one of the most fundamental phenomenon and behaviors that traders must be well-informed. In fact, we should be very familiar with these textbook contents and interpret it in a glimpse on the technical chart unconsciously. Just like we don't pay direct attention about each breathes when breathing, like we don't care each and all of the alphabets when we speak, or like we don’t perceive location of each keyboards every moment as we type, this very technique should be performed automatically and quickly by observing dominant formations of candlestick bars.
As a matter of fact, comprehending market trends and price actions only by referring to the candlesticks is yet too spurious. It should be used in such a way to weight on certain scenarios in a macroscopic view, rather than deriving precise and specific PRZ(Potential Reversal Zone)s and distinguish the accurate market trend. It’s never like ‘The price must go up because this pattern just appeared’. Furthermore, I strongly believe that the reliability of the candlestick pattern strategy is declining especially in recent financial market, where we encounter countless non-traditional and abnormal situations that were not very common in the past. Hence among the existing ‘Textbook’ candlestick pattern strategies that can easily be found on Google, there are particular patterns that are still very reliable on current market and there are ones that are not as reliable as it used to be. So here, I will organize everything very clearly for you guys.
The technical chart is well known as sort of a map tracing the mob-psychology of all the stakeholders in the market. Investors’ sentiments such as FUD(Fear, Uncertainty, and Doubt) and FOMO(Fear of Missing Out) that often cause panic buy/sell are visualized as data. Those with a clear understanding of the fundamental nature of how candlesticks are being formed, don’t even need to memorize these patterns one by one. As I emphasized at my previous post, candlesticks should be interpreted as a whole structure, unlike the line chart expressed in one-dimensional. Candlesticks are newly formed in each time interval and we can choose the timeframe for the chart that we are about to analyze. For instance, each candlestick in a daily chart is formed every day while each candlestick in a 5minute chart is formed every 5 minutes. Higher the timeframe of the chart is, longer-term the scope within the chart is. It is important as a TA analyst to start from macro-perspective with higher timeframe first, then go deeper to lower timeframe and find short-term factors.
There are four independent prices composing a candlestick: open, high, low and close price. Open price indicates the starting point while close price indicates the ending point of a candlestick. Just like the wording, high/low prices are formed at the highest/lowest price during the time period of candlestick being formed. A bullish candlestick is when the closing price is above the opening price (i.e., when the price rises), while a bearish candle is when the closing price is below the opening price (i.e., when the price is falling), and the two are expressed in different colors (green & red or red & blue). The thick part between the opening and closing price is called the ‘Body’, and the thin part is called the ‘Tail’ (Wick or Shadow).
Typically, the length of the body implies the strength of an ongoing trend. We learned from the textbook that the candlesticks with a longer body means stronger trend and those with shorter tails mean clearer trend. Back in the days, there was time when we could detect if whales are involved and deduct impulsiveness of ongoing trend when distinctly long bodied candlesticks with relatively high trading volumes take places. I am afraid to tell you that it is better to erase that memory. First of all, it is too obvious and cliché to announce that the long candlesticks with high volumes mean strong market trend. This criterion itself is quite vague and not 100% reliable to identify future trends or find insightful signals. Moreover, in recent days (especially in Crypto), whales like to deceive retail traders with a strong faith of trading volumes and since the future markets are becoming bigger, giving too much weight on trading volume paired to each candlestick is not as effective as it was when textbook used to work very well. I am not saying textbook is wrong. It just needs slight updates since the market we are dealing with keeps changing over time.
In TA world, closing price of a candlestick carries a great meaning and thus closing prices at higher timeframes should very well be monitored to become a successful trader. Sometimes whales even battle aggressively right before a major closing time often causing a weird ‘scam’ moves with a high volume. As shown below, we usually find the price and time when certain TA variables (such as top/bottom of trendline, channels, pivot levels, and other indicators) are broken, meaning if the price has penetrated those variables successfully, in order to find breakout entries, stoplosses, and target prices, etc. This whole concept of breaking above or below is quite vague, subjective, and relative idea. So, what we traders refer to as a reliable criterion is confirming whether the candle closed above and below the factors. For instance, let’s say that we are seeking and waiting for the breakout of the downward trendline. Well sometimes it’s not as easy as expected to precisely spot and determine whether the price has successfully pierced through the trendline. There are times when price breaks the trendline, but ends up coming back below leading close price of the candlestick to be formed below the trendline like the case 2 below. In this very case, it’s difficult to determine whether the breakout happened successfully or not. Nevertheless, like case 3, when both closing and high prices are formed above the trendline, we can clearly confirm and weight more on the breakout scenario, expecting more bullish rally.
Okay let's get to the point. In recent financial trading market, it's enough to know just these three.
1. Engulfing
2. Doji
3. Long Tailed Candlestick
As mentioned above, there’s nothing hard if you understand the essential concepts and principles of the above patterns and phenomena. The engulfing candlestick is a phenomenon in which the body of the previous candle is consumed by the body of the next candle, that is, a larger body than the previous one comes out. In other words, if a new bullish candle closes higher than the previous open price or if a new bearish candle closes lower than the previous open price, we say ‘the new candlestick engulfed the previous one’. If we look closely, this pattern implies the circumstance where the new candle completely overwhelms the trend of the previous candle and reverses it into a new trend despite closing the price from above or below. However, the appearance of an engulfing candle does not mean that the trend is unconditionally reversed. It is often the case that engulfing candles take place consecutively, with the second candle taking over the body of the first candle, the third’s taking over the second’s, the fourth’s taking over the third’s and so on. As the price fluctuates up and down, it creates a Widening or Broadening pattern also known as expanding sort of shapes, making it difficult for traders to figure out the current trend. In this circumstance, the entry prices, stop loss prices, target prices, or average prices of many participants in the market tend to be located relatively nearby. This price range or region is called a HVP(High Volume Profile or Peak) or an Orderblock and I will cover details about this concept later on another post. Anyway, there are numerous methods to derive Orderblock and one of them is to spot bodies of the consecutive engulfing candlesticks.
The tail(wick) of a candlestick can be interpreted as a sign of the fierce battle between the bulls are bears. Longer tail signifies bigger collision between buying and selling forces. The longer the upper tail, the more the bulls trying to raise the price up but the bears rejecting them eventually sellers ending up being dominant and vice versa for the longer the lower tail. Generally, when the long upper/lower tails are formed at a relative higher/lower part of the wave structure or at a distinctive pullback as a PRZ this can be a possible signal of trend reversal. Due to my personal trading experience, it doesn't matter much in recent TA market whether the long-tailed candlestick is a bullish or bearish. In other words, regardless of the color of Hammer or Shooting star (which are both long-tailed candlestick pattern), it’s better to check if the next following candlesticks are being formed opposite direction of the tail. Personally, I don't think the Inverted Hammer and Hanging Man are not as necessary as it used to be in the old days.
When the length of the candlestick’s body is relatively short meaning if the open and close prices are very close, forming a cross like shape, it’s called a Doji. Since Doji has a short body, the upper and lower tails tend to come out longer and thus can be considered as evidence of a tense confrontation between the bulls and bears that eventually ends up reaching a balance. Similar to the long-tailed candlestick, Doji is also known as a sign of a PRZ depending on the next appearing candlesticks. When Dojis are observed after swing high or low, it can be a possible indicator that the on-going trend is overheated and you might want to anticipate some pullbacks. However, it is too risky to directly assume that the top or bottom is near just because of Doji. Especially in the market these days, Dojis also appear frequently in sideways and sometimes confuses traders searching for a clear trend.
As emphasized above, as with other technical techniques, theories, and indicators, always remember to weight more to the emergence of patterns in higher timeframes and longer-term perspectives. The higher timeframe people globally refer to, the more the reliability the TA will be. Just think about it for a second. Which timeframe do you think that people consider more significantly about the closing price, a 5 minutes chart or a daily chart? I would obviously say that the price signals from the daily cart is relatively more representative and reflect longer-term than those of the 5 minutes chart. Keep in mind is that you also need to understand market trends from a macro perspective before approaching towards short-term perspective. It is always recommended to recognize long-term trends or situations in advance from the candlestick of a higher timeframe, and then look at more detailed and microscopic elements step by step.
All right. I will wrap up now. Thanks for reading my post.
Your subscriptions, likes, and comments are a huge inspiration for me to write more posts!

QI/BTC Inverted Hammer On Monthly TimeframeBullish candle could be signaling a reversal on this pair.
