BTC EDU post - 100 followers THANK YOU!TL;DR - Go back in history from 1928 to today and research A.i. design / Banking / Market psychology cycles / the 1987 crash / - We are living in a butterfly effect wave caused by your world leaders when gold lost the greenback and it was no longer backed by the green anymore. If you are young in the markets you will want to read this. If you are over the age of 30 you most likely understand a lot of this...
This is a story I decided to type up for my followers. Thank you very much for being so support even by liking and following. If you are young it is important for you to really read this....
----------------------------
The year was 1999 and I was just 10 years old. At this time I didn't care much about the markets or money unless I wanted some candy or a new bike. One thing that did catch my attention was the panic and scare of something that was called the "Y2k Bug" where everyone thought all computers were going to reset to 0 and destroy lots of information data and loss of funds throughout accounts in global tech businesses. Luckily for me, I was a kid fascinated by technology and told my parents to not even worry that the problem was going to be resolved and most likely the news was just wanting to scare everyone. Because I was huge into conspiracy as a kid it actually took into my favor....See...I grew up liking conspiracies, aliens, etc etc...and with only less than 500 million people in the world on the internet pre-2000 I had quite an advantage as a child having access to information at my fingertips through my 56k modem. I did whatever any kid addicted to his favorite toys would do and started to learn for over 10 years about the growth of technology and A.i. Back then the dark web existed with less than 1 million people in it....did you know that?? So here is the point of me telling you this...a portion of the public was scared out of the market before it peaked and this made many people think we had just had a price correction once the market started to dump. Well most were wrong and the market kept dumping just like bitcoin did in 2018...the hype of the internet boom was over and real world use had started to take place..the market was slow...it took 4 years to crash 70% and 16 years to bloom golden apple trees for people who DIDNT GIVE UP AND FOLLOWED WHERE THE INTERNET WAS TAKING US INTO THE FUTURE!!!!!
I am here to tell you we have just started playing with this technology on a larger scale.....and we are going through a very similar cycle but there are new pieces at play. Those pieces are defined into 3 simple words...
Artificial. Intelligent. Design.
Do you know that 50% of bitcoin holders today were not in BTC in 2016 or 2017? The majority of people who came into this market have been entering since the mini bubble of 2018. Why do I say mini? Because the Dot com bubble hit over 5-7 Trillion dollars before it truly crashed. Some have claimed as much as 10 Trillion in certain locations of the world. ..What I call bubble in crypto is simply a "test run" of how the people of this world will take to this technology. In 2016 Btc was between 500-800 dollars. If the block chain leaders of today have already got their prosperity and now are recycling price to grow it realistically...we can very well see prices as low as $1,000 because I feel most of the large capital investors who are holding their initial amount they got in with have reset that same amount at around the 1K marker so they break even on the investment that has also paid for itself for a future to grow with. Think about it....Charles Hoskinson (ADA), Vitalik Buterin (ETH), Dan Larimer (EOS), Charlie Lee (LTC), ...ALL OF THEM STARTED NEW PROJECTS TO ADVANCE THE TECHNOLOGY AND MAKE IT BACKWARDS COMPATIBLE WITH BTC!!!!
So if all of them own some bitcoin still...are bullish on it...building networks to connect to it...AND developing better protocols AROUND IT LIKE A FKN SOLAR SYSTEM>>!>!>!> WHAT DOES THIS TELL YOU???!?!
They have to obey the rules of the leaders of the world and our government on what they decide....so they are placing their chess pieces accordingly so even if bitcoin fails.. the grand architectural design of the new systems will be in harmony on a new system that can simply "snip snip" other networks out if need be. Personally...I don't see it going anywhere near 1,000 again but I do not exclude all options...I see it slowing down a lot and stabilizing with realistic price growth based off real world use-case by the banks, governments, corp leaders, etc etc...and for you conspiracy fans...the shadow government which is where I personally think BTC came from ;)
Personally I believe price will hit 1900 - 3300 zone again and we will have 3 falling valleys with a fake out descending triangle just like GOLD looked like when the greenback was no longer supporting it...it dipped below then slowly kept going up and up and never stopped climbing for over 20 years..if bitcoin is like the gold of the internet then you better get it now while supply is cheap because a million dollars today isn't much in the large scheme of things. It will become "heavy" in data...it will be "heavy" in the cost to carry it and pricey to exchange it so it can stay controlled by few with very little common folks being able to have "1 whole bitcoin."
It will be like how people chase 1 million dollars today...they might very well be trying to chase 1 full bitcoin in the year 2040....
ARE YOU SEEING WHAT IS HAPPENING??
These block chain leaders are playing it safe...if bitcoin fails to stay around and becomes history..it will be a piece of history worth holding because it was THIS digital asset that started the global change for the next 80 years...a plan that has been set since the stock market crash of 1987...the year I was born...what a time to bust out the baby guns and enter this chaotic world huh??
It takes 10 years to remold technology but its about to re-define the next 80...and you already see how fast technology grows....
The people who lost everything.....
their pensions....their homes...their savings.....these people are the ones who have stood up to make a new design "fair" and so the world leaders have heard them because WE stopped giving a shit about their banks and loans and started using their own system against them. When you make millions of peoples lives hell and 90% of them are mentally poor...eventually they will go into survival mode and do whatever it takes to survive. You can't piss off a world of people and expect nothing will happen from the outcome when you suppress them to try and fix your own mess : / (the market crash couldn't be stopped so they have had to try and come up with a new design since then...)
I am about to wrap this up and I apologies this is so long but I felt compelled to share after reviewing some old stuff today.....
So think about this....
22% of student loans fall into default...1/5th.. For many, the payments are proving unmanageable. By 2023, nearly 40 percent of borrowers are expected to default on their student loans.
Over the past 20 years we had the economy stabbed by a "recession" and even I felt it at age 17 working 2 jobs....
(look at the market cycle crashes from 1982 to now....Funny patterns will begin to show and tell you the story...how ..and why.....)
The kids who grew up and graduated between 2000-2007 is the generation who has had to feel the PAIN of our parents struggle to survive an economic turbulence caused by our very own governments of the world because THEY DIDN'T KNOW WHAT TO DO SO THEY PROTECTED THEMSELVES WITH NEW OVER-LAPPING LAWS, NEW LOANS, AND GREEDY WAYS...I don't blame them...I would have protected my family and self as well......I blame the lack of communication between the people and the movers and shakers..I fault the education system for not having the integrity to make it a point to TEACH the importance of money and how it really effects our world in trade and to survive from birth to death....the education system historically was designed to create industrial manufacturing workers...don't believe me...look it up...you will be mind blown how the system went from "teaching to supply workers to grow the world" to "teaching to make people careers and jobs"
I am not saying that the education system was developed to make new world order slaves or some crap...I am saying that over the years ..lots of information has been manipulated and left out to teach as a necessity for living life.
Money. Education. The way knowledge moves....
All of it is about to change and how it will effect you will be up to you.
The 1987 crash not only scared us...but it scared them as well......they knew something had to change when they couldn't control the market from crashing...this is when the white paper of distributed ledger protocols started to come into shape. Yes that is right...there was a protocol design just like bitcoin prior to the age of bitcoin post-2000.. Google it..you will find it...
-------------------------------------
Let me take you back some in time and what I learned as a kid and why I am so focused in the world of artificial intelligent design and why this is important to pay attention to not only as a new investment vehicle but as a whole new cycle is in our markets . It will begin starting now and begin transitioning in 2020. Most of us in our middle/young adult years will see how quickly these next 20 years grow and change and Im sure it will make all of us feel very old since some of us got to play with a nintendo and some in this realm and who could be reading this have had the pleasure of playing pac-man on an Atari....
I want you to really think big here. If you were a world leader planning for 100 years of growth for your family legacy and the families of the world for a stable growing world thats in chaos..what would you do??? You would plant the seeds today for your kids tomorrow and you would begin a rough draft of a new era before you started to write the final draft......
If you are 24 years of age or older and reading this you know damn well we have no pension plan for us. You know damn well there is no PLAN for us to retire...we have to make our own plan. I feel as time goes on the middle class is becoming more "spread" apart in order to truly have multiple ladders of wealth to play from...in a sense creating a human liquidity source of workers no matter what the outcome is in life on one side of the world or the other....so we always have a working class and a leading class. If you make the financial road longer...it will take longer for families to generate wealth without innovation...machines are 20% or more of what physical labor used to do...think about that...use your brain or work for pennies will become the next thing. We will always need engineers but you need to see how the job force changes. Some jobs will fall forever and become history and replaced by robots. Some jobs today already are at that point.
It will take hundreds of years to become wealthy enough to be a leader of the world in 100 years time...mark my words...this is the only time in our world in our time at our age (if you are around my age) that will be able to have an opportunity to be on the wealthier side of the fence by simply planting your little cryptocurrency seeds across the new designed web 3.0
NOW for this to make sense you need to be taken back to the year 2000....
Take back to the year 2000
The Nasdaq index peaked early March on the 10th of the year 2000 and nearly double over the prior year. Right at the market’s peak, several of the leading high-tech companies, such as Dell and Cisco placed huge sell orders on their stocks, sparking panic selling among investors. Within a few weeks, the stock market lost 10% of its value. As investment capital began to dry up, so did the lifeblood of cash-strapped dotcom companies. Dotcom companies that had reached market capitalization in the hundreds of millions of dollars became worthless within a matter of months. By the end of 2001, a majority of publicly traded dotcom companies folded, and trillions of dollars of investment capital evaporated.
Fastforward to today in 2019....
What has the stock market done since 2001 - 2019?
What have our fiat currencies turned into? Toilet paper??? They are all becoming weaker and have been printed as such! A NOTE IS ALL YOU HOLD WHEN YOU HOLD PAPER MONEY. YOUR NOTE IS BECOMING WEAKER IN ITS VALUE EVERY PASSING YEAR UNTIL THEY STOP PRINTING MONEY!
What has interest rates done? WHY?
The housing market? PFFFTTT Dont get me started....
Im 31 years old and I will be damned if I let some old ballsacks in congress try to design my future without me being apart of it or me breathing down their neck through our weapon.....
The internet of things....the internet of value...
Data is the new oil... will you begin to mine oil today? Or purchase it for retail price later?
My best advice for everyone in this realm is to learn your history...truly understand what block chain technology is and DLT...truly compare the protocols and don't just read to forums and reddit posts. DO YOUR DUE DILIGENCE! Your world leaders and these leaders in crypto today are just like the leaders who survived the dot com bubble.......
Be patient...be smart...dont chase losses...and invest what makes you HAPPY in life...for that is what truly brings you wealth. As they say..do what you love and the money truly can come abundantly when you realize that money is just a tool....do not let it control your life. Turn it into your bitch and make money work for you. Your opportunity is here...take it with a grain of salt and make yourself valuable in many avenues in life..not just crypto portfolio value...build value through multiple avenues. Keep the faucets dripping and you will always have a supply of money to go to.
Supply the demand.
Thats it for now. Way too long as it is! If you read this thank you for reading my story...please tell me your thoughts as I wrote this pretty scatter brained and jumped around a bit but I tried to hit some topics that are related to why our financial economy is in rambles right now..I will make a video in the future with a very good explanation of this. Overall you can find plenty of topics on the internet about the things I have said here. DYOR and you will be surprised what you will find if you keep digging deep enough....
Marketcycle

BTC Market cycle in disbelief. What's next?According to Market Cycle theory, we should be at the stage of disbelief. If that is correct, we can assume that next huge bullrun is starting to ramp up and it is our last chance to get aboard in to the btc hypetrain!
By playing with earlier "hyperbolic growth timeline" we should see new ath soon enough and fib 2.168 around january 2020. The big correction from fib 1.618 to fib 1 is just an assumption. Massive amount of people did get utterly destroyed when btc hype peaked in Dec '17 so i would expect these levels to have some huge manipulation by whales.
Buying every dip from now on.

Market CrashI didn't notice the purple trend line before, but it started the 2008/9 Financial Crisis. I see this as heavy resistance, if we get rejected at this trend line then for sure we will have a major economic collapse. If we bust through this resistance line then I can see the market going nuts for 5-6 more years. I tend to think we crash within the next year and a half.
Feel free to comment, I appreciate it and also smash the "like" button! Thank you!
- Matt

Called it to a T, yet again! (With trading advice)Another great trade from a couple of days ago in which I published in my channel. We bought right at the bottom between $9,700 - $9,750 and sold half positions right at today’s top @ $12,000. If you have also made good profits don’t hesitate to show your love in the comments section below.
Back on the 29th May I gave you the exact profit taking targets (Blue box on the chart). I am sure some of you think that I was mad to take profits as Bitcoin was going to the moon! But, what if, the price didn’t go to $13.8k in one straight line? What if, the price didn’t even get to $10k and starts to drop? Do you get what I mean? It’s difficult to predict market movement (half of those who predict BTC to $100k in 2018 have somehow vanished). As a speculator, you have a projection, a strategy and risk manage your positions. That’s it! Nothing more! Remember how I told you in 2018 that Bitcoin was going to drop to 3-4k yet I still kept buying at $6000ish and were still be able to make good profits?
As I have repeatedly mentioned, my strategy is simple -
1. Buy low & sell high
2. Take 50% profits when 2:1 rr ratio is achieved and leave the remaining positions until critical resistance (or long term hold)
3. Re-invest my profits at good support and ride the wave up
And my projection going forward?
Initially when price broke out of $7,500 I thought the bear market has probably ended. However, I was waiting for Bitcoin to pullback and consolidate before start moving up again. Surprisingly, it never happen. Instead it went straight to my huge resistance level @ $13,829 in one line. Many called this a start of new bull-run just like what happen in 2017. In my opinion, they are either naive or are probably just crowd pleasing “professionals” looking to gain followers.
First, the accumulation between 3-4k was too short to think that a new bull run has started. Second, a new bull run does not start with a parabolic movement. Further, there was no resistance whatsoever back in 2017 after the previous ATH @ $1,200 was taken out. The price just kept going up until when everyone, even your friend surround you who have never open a trade before, start to invest in Bitcoin. The bubble burst. In contrast, currently there are still many resistances on the way up to $20k. How can you compare the two? Different context, different scenarios.
As a result, my best guess now is that the market is trying to find it’s range. Probably between mid 5k and 16k. The range may sound too wide to be able to trade. However, if you focus on buying at good support (just like what I have been doing) and apply your strategy of trading a ranging market, you will probably be able to find some profitable trade setups. At present, the next potential buy zone is around $7k.
Of course, I will keep giving you timely updates in my channel. A follower mentioned that I don’t post ideas often. The reason is that I want to give you the most profitable and reliable trades I can, instead of giving you updates every few hours just to gain followers.
Some other advice:
Check the trader’s past records first and don’t follow the ideas blindly - why would you trust someone else with your money?
Don’t trade the news - I have called many price movements days/weeks before a news event was released. Yet, people still believe it’s the news that drive the price movement.
The moment you think making money is easy, the moment you are going to lose
Don’t be greedy - don’t go all in on one trade and not profit taking
Risk management - Have a stop loss and check if the rr ratio is good before entering a trade
Take profits on those trades that your have hold for more than 12 months first - not sure about US but in Australia your investment is entitled to capital gain tax discount if you hold the investment for more than 12 months

BITCOIN road to $100.000+ in the comming 2 years.BITCOIN road to 100k+ in the comming 2 years.
The market cycle has started again. Maybe this cycle wil be the biggest ever. And maybe it wil go over the 100/200/300k.
But realistically a 100/150k is very nice for this comming bullrun.
What we see now is a accumulation zone. We need to let bitcoin rest. And i think you can add position add $6000.
The accumulation zone is uptrending to the halvening. if we break this accumulation zone and break 11k i think there is another scenario then this.
But if that happens it could be a really different rally than the previous.
Lets see what happend the comming years!
Goodluck you future millionaire!
i am sorry if there are any faults in chart or the post.
Follow me for more crypto and like this post if u agree!

Bitcoin printed the most violent upside reversal of its HistoryThis chart is saying a massive F*ck you to the herd who joined late for the easy money end of 2017, who panic sold thinking it would tank to zero or close to it.
This market is punishing this herd who probably panic sold between 6k and 3k.
These punishing reversals type of moves are happening in almost every market cycles.
They are the perfect symmetrical opposite moves as the punishing raising parabolas who trap the herd that thinks the asset will keep on raising forever close to the top of the cycle.
Bitcoin is now probably going to keep on raising brutally and progressively, as these same late investors and newcomers are about to Fomo and frenzy join successively, as they realise this asset is not going to zero.
Market cycles.

Tesla (bag)holders on Robinhood are at all time high :)I should make a video so you can hear me laugh. At Tesla baggies face. But it is late here.
Robinhood = free trading "app" for complete casuals. It attracts complete noobs that look for an easy way to speculate and do not care / understand about quality of service. It's really the noob magnet.
Reminds me of something...
Oh right. Every single bear market ever.
Whales dumping. Morons buying "cheap".
Enjoy these bags. This time it's different.
This wall street cheat sheet or whatever you want to call it, just a general guide... Can look very different in some cases:
But I think for the "big stuff" with alot of participants, the patterns will be very much like that.
K that is enough examples for today. Just keep an eye on Tesla, see how it goes, next Tesla will be similar. Continuous learning. And BitconnectCoin too.
This is what institutions do btw. From what I heard + would bet 99%. + Wall street cheat sheet is their "10 commandments".
Market cycles / Elliot waves, more or less the same thing.

Is EurGbp heading north?This is my long term view on EURGBP, not much to be said. I believe price is on its last leg (V) of the impulse and will fall within the range of .95 - .98.

Bitcoin psychology market Psychology Market and Market phases
Chart BraveNewCoin liquid Index for Bitcoin daily scale

Bull Flag in Bitcoin Market Cap Dominance Disclaimer: If you are primarily interested in copying other people’s trades then this is not for you. However, if you are willing to put in the work that it takes to learn how to trade for yourself then you have found the right place! Nevertheless please be advised that you can give 10 people a profitable trading strategy and only 1-2 of them will be able to succeed long term. If you fall into the majority that tries and fails then I assume no responsibility for your losses. What you do with your $ is your business, what I do with my $ is my business.
Click here for my Comprehensive Trading Strategy | Click here for my Comprehensive Trading Process | Click here to learn about the 2 BTC' to 20 BTC' Trading Challenge
Quick update, without the normal comprehensive TA. What I think is most important right now is the Bitcoin Market Cap Dominance (BTC.D). This is my main indicator to identify alt seasons vs salt seasons. The best alt seasons happen when: BTC is in a bull market and market cap dominance is > 70%. Conversely when market cap dominance is less than 60% it is usually a good indicator to sell alts.
The target from the bull flag is 77%.
Furthermore I think this is a very strong confirmation of a bottom in Bitcoin. Throughout this bear market any time BTC has pumped, alts have pumped more. Now we are seeing BTC pump and alts sell off vs BTC. This is exactly what we saw at the beginning of the 2016 bull market. This combined with the EMA's starting to signal a reversal has me sitting up in my seat.
That being said I am not viewing this as an opportunity to buy BTC. We are at resistance and well overdue for a correction. Instead what I've been doing is shorting ETH:BTC and longing ETH:USD as a hedge. If BTC continues going up then alts should continue selling off vs BTC but not necessarily USD. If BTC goes down then alts should selloff across the board and I will exit my ETH:USD long. If all works out then I can use the ETH:BTC short to hedge BTC spot purchase(s) when it eventually corrects.
Hopefully that all makes sense, if not feel free to ask questions!

Bitcoin - Bear Market ComparisonTraders, I believe you will like the facts put forward in today's analysis on the weekly chart for bitcoin, it's a simplistic overview of what I see happening right now.
My main focus is the comparison between the current and previous bear market, there are a lot of similarities between both cycles that we can use to our advantage.
Firstly I'd like to talk about the overall decline in both market cycles.
During 2013 to 2015 bitcoin dropped from $1170 to $150 resulting in a decline of 87% which lasted 413 days.
During 2017 to 2019 bitcoin dropped from $20000 to $3140 resulting in a decline of 84.40% which lasted 364 days.
The percentage decrease and timespan are extremely similar in both cases, you'll find an in-depth calculation of bitcoins movements from my post regarding cyclical measurements below.
Going forward if I find this would be helpful to other traders I may revise and update the measurements shown in "Bitcoin - Cyclical Measurements" so they are more relevant in the current bitcoin market.
Moving onto my next focus point in today's analysis... The re-test of weekly resistance following the recently found "market bottom" which can be seen in both cycles as shown in my analysis.
Let's take a look at the price action from 2015 to provide more detail on what I'm really looking at.
As you can see this level held extremely well prior to price declining to $150, this support turned key resistance prevented a breakout during early July 2015, which was quickly followed up by a decline of 37.70% lasting 49 days. Only after this decline did price experience a breakout and continuation to the upside which resulted in a 2 year bull market and ultimately leading to the current all time high of $20,000 after years of progression.
When we take a look at the current price action for bitcoin, it holds a similar structure.
The resistance bitcoin is now testing is much stronger than before, this support level held for 9 months with at least 5 separate tests in which it finally broke during November 2018. For anyone looking at bitcoin I would pay close attention to the next few weekly candlesticks, mainly their closing prices and figure out what it is suggesting short-term.
It is highly likely bitcoin will fall short at this weekly resistance level and history will repeat itself, the bulls will be put back in their place (for now) and we'll experience a minor correction either to the support trendline or a similar decline to the previous cycle... 37.70%?
A smaller correction to the trendline would result in a decline of 20% or less which is unlikely, if a sell-off does happen it's likely it'll break that area and push further towards $4,000.
As mentioned this all depends on the price action in the following weeks.
This post is open to discussion, feel free to leave your own analysis below.

Is BTCUSDT going to behave like the main 20k to 3k cycle?Here ist he 20k to 3k market cycle bar pattern overlapped with the last BTC rally.

Tesla complacency is over. Watch it crash and burn. Dumb scam.Can you imagine a Tesla bull say "evil big money they knew" when all this information was available to the public?
I would not be surprised actually. I don't get how clowns like this get involved.
Nyways this is the story:
Elon & Kimbal start in 1995 with a dot com company named Zip2, with money raised from a small group of angel investors.
They took advantage of the dot com bubble hype to rapidly become millionaires.
In March 1999, at the peak of the dot com bubble when irrational exuberance was off the charts Elon made 165 million $ from selling X.com one of the first online banks. It merged with another company that had a product named paypal. We do not know how much of X.com is into paypal. Elon gets kicked as a CEO because he has too many bad ideas and paypal goes on to become successful without him.
In 2001 Elon Musk starts SpaceX, another hype ponzi - er I mean company, that attracts alot of interest from the public.
All along the way Elon works on his personality cult.
In 2003 Tesla comes to existence. It is supposed to change the world, starts with luxury cars, then switches to cheaper ones. Lots and lots of hype around it.
The company has not had a profitable year since its creation, interestingly its r&d green budget is one of the lowest of all car companies.
2006: SolarCity, to have "clean energy" and "save the planet" hype hype. One of the world's biggest polluters. Who knows, we might all die from all the heavy metal they dumped in nature. Great. Disgusting.
Apart from that he started all kinds of hype projects. Dozens of them. He just likes throwing hype ideas around. That's literally all he did his whole life and became a billionaire for it. Throw around dozens of ideas start a business and then that's it. Nothing never gets done nothing ever becomes successful (unless his company merges with another one and he gets kicked as CEO). I am sure every one has had the pleasure to meet people like this in their lives "oh ye i'll do this and this and that" taking plenty of responsabilities, too much to be able to respect them, and of course nothing gets done.
Tesla is just another name for "Elon Musk reality show". It's all hype, and unsurprisingly it attracted all kinds of idiots.
I wonder how many "Bitcoin true believers" are also "Tesla true believers", I am curious to know if it is 99.7% or 99.8%.
The facts were available to every one. Company is trash. Complete scam.
The big whales have dumped on all these "true believers" fools, and once again, like every single time, the public is now rekt.
Every one knows how this work, yet, somehow "Nooo I won't sell 'they' want to buy my stock cheap". I don't even get it. Last 500 billion times it happened the same way. W/e.
EVERY TIME.
If someone wants to invest in EV, there are plenty others. And hybrids are really good, better. Guess what works? Taking it slow, one step at a time, and making sure everything works smoothly. Saying you want to go from 0 to 100 gets the public excited. Saying you want to build a colony on Mars gets the public excited. But the public is made of idiots, and changes have to be progressive. Hybrids are really good, the perfect compromise, and the first step. Some EV are great but really expensive as of now.
Once again, Elon bite off more than he could chew.
He can't help himself, he just loves to start futuristic stuff that is bound to failure: Gigafactory Hyperloop Hyperloop Neuralink.
And he spends his time seducing people, and when someone doesn't fall for it he gets angry. Typical. So funny. pretty sad too.
This is how it usually looks like
And zooming in on the bear part
Remember when Bitcoin broke the downtrend & had a golden cross and the bear market was over?
I'll end with just 1 word:
Theranos.

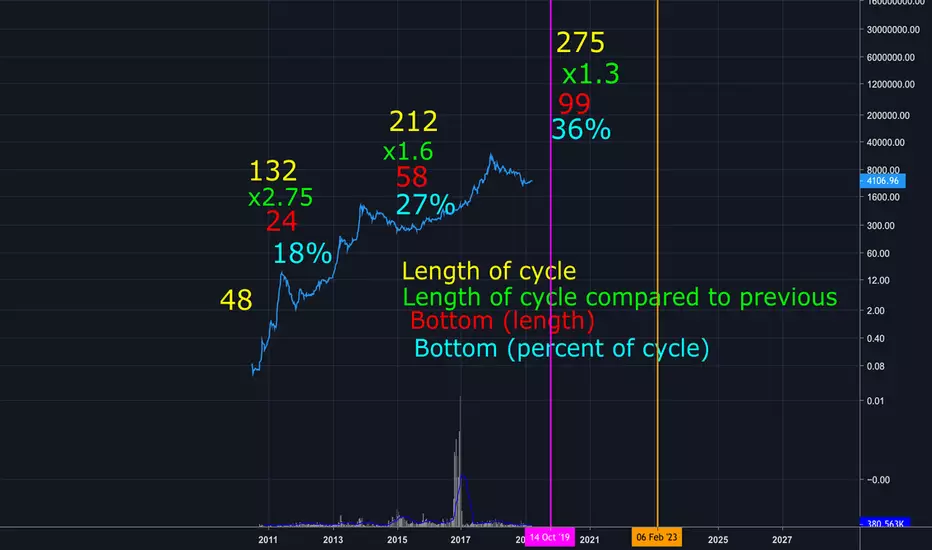
BTC bottom 14th October 2019, next top February 2023I'm no mathematician so I kind of pulled these numbers out my ass to be honest. But hear me out.
Assuming the trend continues (on increasing market cycle time), then these are some guesstimated numbers of this market cycle's bottom and top.
Pink vertical line is bottom, orange is top.
Bottom this autumn, with next top in 2022/2023.
Also note the time the market bottoms as a percent of the total trend time is getting later and later.
In the first cycle it bottomed at 18% of the cycle length, while the second cycle bottomed at 27% of the cycle length.
Believe it or not I'm not stoned making this post.
My guess is cryptos going to get real boring this year. Good luck everyone.
Market recession?There have been many talks about a recession, every youtube/facebook guru and their mom was talking about it, and although the market crashed late last year it was quite uneventful to the average individual. And we got quite a bull run afterward however, I believe the actual recession hasn't hit yet. on the 22nd of March, the 10-year U.S bond yield curve became equal to the 3-month curve. This shows a strong sentiment within investors, it shows a lack of confidence in economic prosperity within the years to come.
the chart shows a loss in momentum and the downward curve of my macd indicator confirms it. conversely, this could be a flat pattern forming and waiting for a next impulse upwards. but I wouldn't hold my breath.
I believe a second crash is imminent, my analysis is price based and not bound to time, this may take years or days to play out.
set ups*
be on the lookout for a strengthening yen and safe-haven assets like gold.
commodity (oil) correlated assets like cad MIGHT weaken, this will play out with my analysis on UCAD.

Important: Macro Market Cycle - T.A VersionHey Everyone!
First, here's a static picture of the chart we'll be discussing.
Something I do very often is get lost in the charts, comparing old data to new, recycling old methods and even memeing technical analysis like the Wall Street Cheat Sheet based off psychology.
Today, I decided instead of overlaying the two like I would usually do, was to just re create it. With some simple, yet effective technical analysis to understand why each of those points are labelled what they are.
After diving into it, The following is very clear :
1) That this is only a possibility, it's a simple interpretation of a chart that is based off psychology. We could still be at any given point of this chart on the grand scheme of things. I've picked this time zone based off when $BTC/$USDT pairing became available on Binance.
2) That simple technical analysis lined up with emotion, made much more sense as to why the traders at the time would feel the emotions that they did.
3) That the general feeling in the market right now is that of a possible disbelief, which would mean the bottom may well just be in based off a psychological point of the market
Let's zoom into each of these points and understand them more.
On the way up..
Disbelief , after finally rallying ~ a head and shoulders formed and completed, sending price dropping quickly. buyers quickly jumped in and a healthy double bottom/adam and eve pattern followed.. leaving a nice big wick on the bigger time frames. After forming another small head and shoulders and dropping, buyers quickly stepped in at support, and price sky rocketed in Disbelief . See image here:
Hope , after breaching above the previous high, price found a top just shy of a round number and then proceeded to form a successful bullflag.when sent price back up, which then formed a healthy double bottom/adam and eve pattern, which then found support above previous resistance and sky rocketed again. Once buyers were exhausted, another head and shoulders pattern completed sending price sky diving quickly. Traders had Hope that support would hold and the rally could continue, support was held and price bounced very quickly. See image here:
Optimism , After finding a local top, price created yet another bullflag, sending price higher creating a new high. Once found, price started to form an inverse head and shoulders and completed it, sending price sky rocketing once again. Another local top was found, and a bullflag was painted, however it was a very erratic one, big movements within each candle, yet it was successful and price jumped yet again breaching the previous high. Once above, it failed to stay above and sharp volume sent price down quickly, but buyers stepped in and kept the candle body higher than the previous high's candle body, giving great Optimism for traders. Once price was back above the high, and found support, price again, sky rocketed. See image here:
Thrill , After buyers were exhausted, a volatile sell off happened, which recovered and became yet another bullflag that completed. Once price reached the previous high, it formed another bullflag completed, found support above resistance, which would have sent a Thrill down bulls spines as their investment was now heading completely parabolic. See image here:
Euphoria , The parabolic curved reached it's peak, everyone was in a state of Euphoria but most were blinded by greed. See image here:
On the way back down..
Complacency , A higher high and low were finally reached. The brutal sell offs had finally stopped. Support will hold.. right? The majority were in a state of Complacency . See image here:
Anxiety , After forming the higher high and higher low, we're struggling to get back above the first support we failed, What do I do now? What is going to happen? Am I going to make a mistake? What if price rockets after I sell? What if I don't sell and price drops. At this stage, the majority were feeling a lot of Anxiety . The head and shoulders that has been forming was looking to complete.. I had to convince someone I lived with at the time, it was finally time to sell before. He literally suffered from both FOMO and FONS at the same time.
Denial , Support just failed. Most stared at their portfolios in Denial that we were heading down much further yet. Supports failing one after another. The momentum was so great and swift that most did not know how what the right move was. Denial that they hadn't sold earlier at the clear signals to exit. And were failing to see what was playing out right infront of them, a bearish pennant, and two failed double bottoms / adam and eves. See image here:
Panic , Support failed, which turned resistance.. price can't seem to get back above.. but also won't drop below the current support.. a state of panic follows.. people began to Panic sell, and others were Panic buying thinking they were catching a falling knife chasing a dead cat bounce.. to only have price continue to drop past previous supports. See image here:
Capitulation , No supports held long, emotions are high.. words like ponzi, scam, manipulation etc were used to describe the market movements as some were coming to terms that they had been in Denial and did not want to lose further funds so they sold to save the last of their portfolios finally surrendering to Capitulation . Price dropped 40% in less than a week. See image here:
Anger , A dead cat bounce followed Capitulation . Climbing nearly 100% in exactly two weeks. It hit resistance hard but failed to get over, sending price back down, creating yet another double bottom / adam and eve and inverse head and shoulders which failed and sent price diving. Once a local bottom was found, buyers in large volume appeared in April, there was buzz back in the market. Joe Perl and I assumed April would be a target/local/temporary bottom for Bitcoin based off a large descending wedge that was also playing out. However, months went on, and lower highs kept forming and slightly higher lows also. Until a Death Cross on the 3 day chart seemed to be enough to throw us off the edge, sending us further down. Reaching $3,200USD. Price has since inclined and broken above long term trend descending resistance. See image here:
Depression , With very few people left in the market in comparison to the major bull run, most with wounds of massive losses in both loss of profit and loss of funds left the market. and still call it a ponzi, scam etc. Some suffering from deep Depression , and a few even taking their own lives who were highly over invested or apart of elaborate scams.. I believe we're currently going through this phase. sooner or later, we'll start to reach a state of disbelief. I feel we're getting to that point now with many calling the market bottom, and many thinking we're going to leg down again. See image here:
Once we reach Disbelief again, the cycle can start again. Just because we end a bear market though, does not mean we'll automatically resume a bull market.
Something a lot of traders need to learn is "Price vs Time". There is no schedule other than Bitcoin's halving that may change price. Everything else comes down to supply vs demand.
I hope breaking this meme psychology chart down shows you just how psychology, sentiment, technical and fundamental analysis impacts the chart. But, regardless of the all the fundamentals.. The chart never lies.
Thanks for taking the time to read this.
If you wish to join my community, check out my discord here: discord.gg There is a 'Paid/Premium' section to it also, which can be found here: 'https://www.bearbull.market/premium'
If you wish to follow me on Facebook, find me at: https:www.facebook.com/tradertroy for my thoughts on the market/trading. And also https:www.facebook.com/cryptobearbull for my business page.
My Twitter handle is: @Daemon_Crypto
If you're reading this, then you already have access to my TradingView.
And lastly, if you want to join a genuine Cryptocurrency community on Facebook, check out https:www.facebook.com/groups/cryptoforblokes

Historical Average Bear Market Studies.. Applied To Bitcoin.Quite a few things going on within this chart, but what I'm trying to convey is actually very simple.
The chart is based off a few key models which have been used with tremendous accuracy for over a century.
Model 1) Bear markets will usually last about 18 months in duration.
Model 2) Bear markets will usually last about 1/3 as long as the previous bull.
Model 3) Average Model 1 and Model 2.
Blue Vertical Line: 18 Month Marker
.. Based on the historical average duration of bear markets.
Red Vertical Line: Bull Run Divided By 3
.. Based on the notion that a bear market will typically last
about 1/3 as long as the previous bull market. Historically
this is very accurate.
Yellow Vertical Line: Average of Both Bear Market Studies
.. Averaging both studies gives us a mean and a "prime"
timing window to hunt investment grade opportunities.
Purple Vertical Rectangle: The Window To Focus In On
... If you're long term bullish on this asset.
Key points here:
1) We've already retraced well beyond 78.6% of the entire range from bottom to top (from $109 to $19,800) - What I would consider Investment Grade location.
2) If history tends to repeat itself or rhyme... we're in the sweet spot in terms of TIMING a purchase, being right in between both of our historically accurate bear market studies.
3) Comparing this pice action to the 2015 bear market, we're actually in about the exact same location as we were in 2015 when the market bottomed. Right in between 78.6 retracement and 88.6% retracement . Anecdotal evidence we may be bottoming now.
4) "Buy When It Snows, Sell When It Goes" - Old adage in the stock market which has merit. Should you base your investment decisions based entirely off a saying on wall street? Absolutely not. But here we are coming out of the winter and in to crypto's favorite time of the year. Seasonality wise, we consistently see the market lift in the spring and in to the summer.
5) Internally - **NOT shown on this chart for the sake of keeping it clean and readable.
*Volume breakout shown on OBV.
*Looong double momentum divergence confirmed, shown in the MACD.
*Embedded momentum oscilator trying to break out of oversold. I use a modified W%R, but something more common like RSI or stochastics would give you the same reading.
*Overall the Weekly internals look massively bullish. Just keep in mind this is a WEEKLY chart. Each candle takes a week to print. So this DOES NOT MEAN that you can expect upward movement from this point forward. In many cases after the Weekly charts start showing buy signals, it can easily take a month before any significant price movement occurs. So be weary of the timeframe I'm referring to.
6) Final confirmation for me is a weekly close above $4040.99. At this point I'm not "betting the farm," but I will be exchanging a considerable amount of USD holdings back in to Bitcoin.

The Great Depression Fractal - Part 3 (Blow Off Top Incoming?)Hey guys! Posting an update on my DJI analysis, since we're close to invalidating the possibility of further weakness (for the time being). As I said in my previous analysis, it was best to remain on the sidelines after the bounce from the 21000 area, since it was fairly strong. In addition, I indicated the possibility that we'd actually break the previous high, since this would still be in keeping with my great depression fractal. In fact, I was actually MORE concerned about a further rise. This actually makes me even MORE worried, as I think the crash will now end up being much more severe, once we've officially topped out. I actually hope we find resistance here and drop soon, for the integrity of the market.
IF we don't break down here and make a higher high, I expect us to rally at least to the top of the GIANT uptrend channel (the resistance there is real - just look at my chart). This currently lies in the 30000 area. If we break that resistance, we will likely have an even larger rally, and we will have to create a new long term channel. As you can see, in the late 1920's, we rallied higher before the final 90% drop.
Between February 1927 and July 1929, the DJI rose 233% from about 167 to 384. This means that we could indeed rise up to somewhere between 60-63000 before a huge collapse, if we break the recent high. This target is well above the channel resistance though, so a rise this extreme might be unlikely. I think 30K is more realistic. Either way, this would be an enormous trading opportunity, but it's unfortunately NOT what I wanted to see in the market. I would have preferred a recession now rather than later. This is far less healthy, and it just goes to show that humans have not learned to stifle their greed, and history may indeed have to repeat itself. This final bubble phase may be led by a potential Weed bubble (I can already see major news outlets starting to incite retail FOMO into this sector, even though the ideal buy in point was any time during the last two years).
Anyway, this isn't as long-winded as my previous chart. That analysis speaks for itself. This is not financial advice. This is purely my opinion and for educational purposes only.
-Victor Cobra

GBP CAD Looking to Short at Resistance levelLooking to short it at resistance level marked on the chart.
This week we are in a buy model.
Low of the week was established on Tuesday. We have approximately 3 days of rise. Week high was on Thursday.
Price rised to week high today. Currently on intraday level 1 Rise.
Looking at CAD news to propel it upwards and reverse on hitting resistance.
Current price to Top of resistance is roughly 66 pips.
This is not trading advice and is just a projection.
most importantly TRADE WHAT YOU SEE. :D

MARKET PSYCHOLOGY & CYCLEYou will often come across the term market psychology. This is different from your personal psychology. Market psychology is the same as market sentiment we just discussed. Market psychology is the overall feeling that the financial market is experiencing at any given particular time. There are several factors that contribute to this market psychology and include economic circumstances, expectations, fear, greed etc. All these factors taken together actually contribute to the trading patterns of the investors. There is nothing much you can do about this because, apart from hardcore economic circumstances, human psychology also plays a very vital role in determining the overall market sentiment.
The problem is that all humans cannot be rational. Many of the traders will be driven by emotions like fear and greed. As an individual trader, no matter how rational you are, the moment you see that majority of people thinking that market will move in a particular direction, your rational mind will face a revolt from your emotional side and even if you know that majority of the people are thinking wrong, you may still end up trading in the direction they are trading.
It is because of this weird conflict between rational mind and emotional side that you cannot really depend solely on fundamental analysis of market. Often times, it is very important to go for technical analysis too because it will tell you, without taking account of emotions, the direction or the pattern that the market is following. Technical analysis is based on historical price data. This is crude data we are dealing. They are numbers that are brutally true. The numbers don’t speak emotions. But again, technical analysis cannot alone give you the true picture and you will have to use fundamental analysis at times. So, market psychology can be like a dreadful nightmare but that is what you need to deal with by balancing between your fundamental analysis and technical analysis. Knowledge and education is key to success in binary options market. You cannot afford to be irrational but you cannot even ignore those irrational traders who can and do affect the market as a whole.

Bitcoin's journey to the new peak will be longer this timeThis chart incorporates the Bitcoin's market cycles inside the parabolic shape factoring in the halving effect.
The halving has so far occurred after the bottom of each market cycle was made so based on that (next halving May 2020) the new bottom should take place inside this February - April.
What is even more important than that is the lengthening of each cycle, which seems to trade on an arithmetic progression. Approximately 583 days are added to the length of each subsequent cycle. Needless to say this affect the duration of the bear cycles as well, which also progress on an arithmetic mean (252 days).
This shows that this time the market cycle will take long to reach a peak that should be in by August 2023.

NDX, such an obvious thing..Shareholders must find some diversification place.
The money has to go somewhere, it's physic.

SNP500 - 2018 Buy / Sell Orders - Correction & Market Crash2018 - SNP500 - BUY & SELL Orders:
PRIMARY 4:
SELL @ 2800 with SL @ 2900 & Target @ 2500/2400
PRIMARY 5:
BUY @ 2500 with SL @ 2400 & Target @ 2900/3100
MARKET CRASH:
SELL @ 2900 & 3100 with SL @ 3300 and Target @ 800
Follow me and trade like a Champion!
P.S. Exclusive guidance available for Members.
PM me if you want to join my Sessions.
