Pyramiding money management. 2 part. Short LTC/USD This is the second part of the training material on the method of capital management - pyramiding or scaling as it is also called. Let me remind you once again in the first part of working long with an uptrend, we earned $ 20,000 - $ 52,000 time.
Read more about the process of working in long in this trading idea: Pyramiding How to earn 52000 with a risk of 5% from 20000 1part
After the breakthrough of the upward channel and exit from a long position, a downtrend and a downtrend are formed for us on the LTC / USD pair.
Here is my idea for June before breaking through the rising channel.
LTC / USD June
The trend is broken. A downtrend and a downtrend formed. Here is my trading idea for August:
SHORT LTC uptrend is broken. Trading in the downward channel.
LTC / USD August
______________________________________________________
Let's go back to our example of LTC / USD money management by pyramiding in a downward channel. When working long in an uptrend, we earned $ 52,000 on this coin from an initial deposit of $ 20,000 . Round up to $ 50,000.
Divide the amount into 3 parts of the entrance. A less risky entry point is the first, like a coin at the beginning of its downtrend and a big profit from the uptrend. Therefore, the first purchase will be a large amount.
First purchase - $ 30,000
Second purchase - $ 10,000
Third purchase - $ 10,000
Stop loss is always 5% and moves behind the price of a downtrend. Stop loss should always be behind the downtrend line. (outside the upper boundary of the downward channel). Breaking it will mean a potential change in trend.
_____________________________________________________
As a result of currently open trading deals, we have a profit:
1 purchase for $ 30,000 + 42% = $ 42,600 (net profit $ 12,600)
2 purchase for $ 10,000 + 19% = $ 11,900 (net profit of $ 1900)
3 purchase for $ 10,000 + 0% = as soon as we opened a deal (there is now an option to break the downtrend).
The risk is always 5%
The total net profit of work in the downward channel is currently + $ 14,500
$ 6,400 total position
______________________________________________________
If all 3 sales target work out as planned, then the potential from the entry point:
1 purchase - $ 53400 (net profit of $ 23,400).
2 purchase - $ 17,000 (net profit of $ 7,000).
3 purchase - $ 16,200 (net profit of $ 6,200).
Total short profit: $ 86,600 (net profit $ 36,600).
_____________________________________________________
If we take into account the work in an uptrend that we started with $ 20,000, then the net profit is $ 66,600 and this is on the same coin with a 5% risk and during this period we will only make 8 transactions. This is not fantasy, this is reality. I worked like this for more than a year on the ETH / USD pair in the downstream channel, all the ideas and work in the channel were published in my chat, also partially had ideas here, for example this one for December 2018 I complicated the work a little, but I increased my profits several times, I worked from trending channels. Also, most of the trading transactions were made from the trend lines of the internal channel.
This trading idea for December 2018, but I started trading this downward channel from March 2018.
ETH / USD
_______________________________________________________________
Money management by pyramiding or scaling.
The pyramiding method of money management (scaling) today is very popular among traders with experience. The essence of this method is the sequential opening of several transactions on the trend. We increase our position as profit grows, not loss.
Pyramiding method of money management is perfectly combined with a positional trading strategy. Also, this method increases the deposit well when a trader trades in upward (long work) and downward channels (short work).
Pyramid trading is a strategy that involves adding a new position to an existing profitable position. In other words, these are purchases or sales in order to add to an existing position, after the market has developed movement in a profitable direction for you. You are increasing your position. At the same time, the size of each next transaction may change taking into account the result of the previous one, that is, the position increases when you make a profit in the previous transaction to increase the deposit at a faster pace or after receiving a loss to accelerate the exit from the drawdown.
This is the main advantage of using pyramiding in trading. If you did everything right, then do not expose your trading capital to additional risk. In fact, you reduce risk as the market moves in a profitable direction for you. The main thing is to correctly determine the trend and "sit" on it. The most difficult moment is to determine the beginning of a trend.
On a bull trend it is better to always work on the bull side; on a bearish trend , on a bearish side. Always follow the trend!
However, just as pyramiding can be profitable, it can also be dangerous if used improperly. The main thing is to determine the trend correctly.
Many experienced traders consider this method the only possible way to quickly disperse the "deposit". One well-defined trend lasting only 1-2 weeks can double, triple the deposit with the right approach. Moreover, the risk is only 2% -5%.
It is very important, do not confuse averaging and pyramiding, since these two approaches are completely different. Averaging occurs when the price goes against our position. And pyramiding is the other way around when the price is in your favor.
Pyramiding allows you to achieve a super effective profit / risk ratio by transferring stop loss as the trend moves in your favor.
______________________________________________________
How to carry out a set of positions according to the trend, when to enter.
Another important issue in pyramiding is: when do you actually enter a deal, gain a position more? The answer to this question can be divided into several approaches. Each of them has its pros and cons and in different situations will give different results. Just who is comfortable and who is more used to what they trade.
Entrance to the transaction during the construction of the "pyramid":
1) On kickbacks.
2) On signs of continued movement. For example, it can be a powerful volume entry or a hammer candlestick pattern.
3) During the breakdown of important levels.
___________________________________________
How to use stop loss when building a "pyramid".
Naturally, with pyramiding, stop loss is used. It is recommended to use a separate stop for each entry (to buy the position). As the trend develops, it should be pulled up.
For example, I use 2 stop loss. Regardless of how much I had as the trend of inputs on kickbacks grew. The first is the top, which is about 30% of the entire position. As a rule, it is equivalent to the stop loss level of the last entry (buy by trend). The second is 70% of the position, this is when the trend breaks. Both stop losses are tightened as the trend grows.
It is logical to use stop loss outside of some important levels. The trader as a whole should decide on the overall risk that he is ready to bear. For example, it is 3% -5%. Therefore, it is necessary to calculate the following positions in such a way that, taking into account the profit of the previous steps, compensate for the loss of the subsequent ones and keep within 3% -5%.
You need to understand that with the correct determination of the trend, and the correct scaling of the pyramid, a loss of 3-5% is purely arbitrary, as long as you have a stop knocked out, you can already double or triple the total profit. The main thing with the price increase is not to forget to tighten the stop loss. And so put so that they are not knocked ahead of time. As a rule, I go out when stop loss is touched, just two, as the first one can knock out, and the price can go up further.
It is also worth adding that sometimes on some coins due to their volatility , their feet are knocked out by 5%, so that this does not happen, the size of the stop is not so important as the moment of entry.
________________________________________________
Profit taking.
How to take profit when managing money using the pyramid method? There are several different methods of closing positions:
1) According to the planned profit. For example, you planned to take profit + 100% from this tool. You have reached your take profit. We left the position, took profit and forgot about this tool.
2) With a slowdown in profit growth. For example, you have already doubled the profit on this trend and this is quite enough for you. The trend has moved in a lateral movement, profit is not growing, or growing slowly. It is more advisable for you to close this profitable deal and transfer the profit to the trend that is emerging, thereby building a new "pyramid" on a more rapidly growing trend.
3) At the first sign of a trend reversal. Not breaking through important resistance levels, reversal patterns, breaking the trend line .
4) By tightening stop loss. Knocked out stop loss. Depending on which stop loss ordering technique you use, either single or fractional for each entry separately. Stopped, took profits and forgot about this trading tool. They began to search for a new instrument with a good entry point at the stage of trend emergence. Started the construction of a new "pyramid".
In my opinion, a reasonable solution is to partially take profit at some maximum levels with the trend growing. I am also part of the position about 30% aggressively trading increasing the asset. An important point at local maximums I sell these 30% almost completely, I already shop a large amount of assets from the support if I trade in an uptrend. As the trend progresses, I constantly pull up the lower stop loss (main position). 70% of the position is exited when the trend unfolds completely.
_______________________________
Benefits of money management by pyramiding or scaling.
Pyramiding works well with strong steady trend movements.
The advantages of pyramiding:
1) the bistro is increasing the deposit.
2) minimal risks, and with the development of a trend, there are no risks.
3) psychologically comfortable trading due to the absence of great risks.
_____________________________________________________________
Disadvantages of money management by pyramiding or scaling.
As you already understood, pyramiding works well in the trending market. If the market turns into a flat or a trend movement is accompanied by deep pullbacks, then the pyramid can be destroyed very quickly. On few liquid, weak instruments, this method does not work! On cryptocurrencies, this method only works on TOP. Coins such as BTC , LTC, ETH.
This method does not work:
1) In lateral flat movement.
2) With a weak trend.
3) In a trend with deep pullbacks, in which there will be uncertainty about further movement and they will knock out stops.
_______________________________________________________________
We all heard the well-known trade axiom: reduce your losses, and give the opportunity for profit to grow. This is the aspect of money management in your trading system that issues major winners. Money management throws aside the subjective sensations present in people.
Richard Dennis
Pivot Points

Pyramiding How to earn 52000 with a risk of 5% from 10000 1partPyramiding. How to earn $ 52,000 with a risk of 5% from 10,000 1 part. LTC/USD Jobs in Long.
Money management by pyramiding or scaling.
When building a "Pyramid" from money using the pyramid method - your foundation of the pyramid is knowledge and experience.
One of the main features of this method is minimal risks with high rates of income.
In let's look at an example on the chart. LTC is a strong uptrend. Entering a transaction is not from the bottom of the price itself, but when the trend is confirmed. Trading only according to the trend, exit of the price for trend aisles - means exit from the position. Stop loss is always 5% below the uptrend line that you are trading. As the price rises, the stop loss pulls up. This is very similar to positional trading. But unlike position trading, you buy an asset as the trend develops, thereby increasing the position.
From the example, we see that $ 20,000 is allocated for the coin. They are broken into at least 3 parts. 1 entry is the largest at the beginning of the trend-$ 10,000. The next 2 entries as the uptrend develops for $ 5,000. Risk is absolutely always observed 5% of the position. Breaking the uptrend line means a complete exit from the long market position. If you are not sure that the trend has finally reversed, you can exit part of the position.
In this example, the profit was $ 52,000 + $ 32,000 net. I also want to emphasize, we did not buy at the very lowest prices and did not sell at the very peak of the price, 2 transactions were done quite already at an expensive price. The main thing is to follow the plan, understand what you are doing and what is happening. It is necessary to kill the “herd instinct” in oneself, try to buy the cheaper, sell the more expensive, buy for good luck, work without a strategy and plan. You work like everyone else - it will be like everyone else - nothing!
________________________________________________________
Pyramid mechanics in numbers.
The amount allocated for this coin is $ 20,000. Broken into 3 parts $ 10,000, $ 5,000, $ 5,000.
Profit from purchase №1 of $ 10,000 + 225% = $ 32,500 (net $ 22,500).
Profit from purchase №2 5000 $ + 145% = $ 12,250 (net $ 7250).
Profit from purchase No. 3 of $ 5000 + 45% = $ 7250 (net $ 2250).
Total profit for all 3 purchases $ 52,000
Net profit $ 52,000-$ 20,000 = $ 32,000
The risk has always been 5%
Next, I will describe in more detail this method and all the nuances.
_______________________________________________________________
Money management by pyramiding or scaling.
The pyramiding method of money management (scaling) today is very popular among traders with experience. The essence of this method is the sequential opening of several transactions on the trend. We increase our position as profit grows, not loss.
Pyramiding method of money management is perfectly combined with a positional trading strategy. Also, this method increases the deposit well when a trader trades in upward (long work) and downward channels (short work).
Pyramid trading is a strategy that involves adding a new position to an existing profitable position. In other words, these are purchases or sales in order to add to an existing position, after the market has developed movement in a profitable direction for you. You are increasing your position. At the same time, the size of each next transaction may change taking into account the result of the previous one, that is, the position increases when you make a profit in the previous transaction to increase the deposit at a faster pace or after receiving a loss to accelerate the exit from the drawdown.
This is the main advantage of using pyramiding in trading. If you did everything right, then do not expose your trading capital to additional risk. In fact, you reduce risk as the market moves in a profitable direction for you. The main thing is to correctly determine the trend and "sit" on it. The most difficult moment is to determine the beginning of a trend.
On a bull trend it is better to always work on the bull side; on a bearish trend, on a bearish side. Always follow the trend!
However, just as pyramiding can be profitable, it can also be dangerous if used improperly. The main thing is to determine the trend correctly.
Many experienced traders consider this method the only possible way to quickly disperse the "deposit". One well-defined trend lasting only 1-2 weeks can double, triple the deposit with the right approach. Moreover, the risk is only 2% -5%.
It is very important, do not confuse averaging and pyramiding, since these two approaches are completely different. Averaging occurs when the price goes against our position. And pyramiding is the other way around when the price is in your favor.
Pyramiding allows you to achieve a super effective profit / risk ratio by transferring stop loss as the trend moves in your favor.
______________________________________________________
How to carry out a set of positions according to the trend, when to enter.
Another important issue in pyramiding is: when do you actually enter a deal, gain a position more? The answer to this question can be divided into several approaches. Each of them has its pros and cons and in different situations will give different results. Just who is comfortable and who is more used to what they trade.
Entrance to the transaction during the construction of the "pyramid":
1) On kickbacks.
2) On signs of continued movement. For example, it can be a powerful volume entry or a hammer candlestick pattern.
3) During the breakdown of important levels.
___________________________________________
How to use stop loss when building a "pyramid".
Naturally, with pyramiding, stop loss is used. It is recommended to use a separate stop for each entry (to buy the position). As the trend develops, it should be pulled up.
For example, I use 2 stop loss. Regardless of how much I had as the trend of inputs on kickbacks grew. The first is the top, which is about 30% of the entire position. As a rule, it is equivalent to the stop loss level of the last entry (buy by trend). The second is 70% of the position, this is when the trend breaks. Both stop losses are tightened as the trend grows.
It is logical to use stop loss outside of some important levels. The trader as a whole should decide on the overall risk that he is ready to bear. For example, it is 3% -5%. Therefore, it is necessary to calculate the following positions in such a way that, taking into account the profit of the previous steps, compensate for the loss of the subsequent ones and keep within 3% -5%.
You need to understand that with the correct determination of the trend, and the correct scaling of the pyramid, a loss of 3-5% is purely arbitrary, as long as you have a stop knocked out, you can already double or triple the total profit. The main thing with the price increase is not to forget to tighten the stop loss. And so put so that they are not knocked ahead of time. As a rule, I go out when stop loss is touched, just two, as the first one can knock out, and the price can go up further.
It is also worth adding that sometimes on some coins due to their volatility, their feet are knocked out by 5%, so that this does not happen, the size of the stop is not so important as the moment of entry.
________________________________________________
Profit taking.
How to take profit when managing money using the pyramid method? There are several different methods of closing positions:
1) According to the planned profit. For example, you planned to take profit + 100% from this tool. You have reached your take profit. We left the position, took profit and forgot about this tool.
2) With a slowdown in profit growth . For example, you have already doubled the profit on this trend and this is quite enough for you. The trend has moved in a lateral movement, profit is not growing, or growing slowly. It is more advisable for you to close this profitable deal and transfer the profit to the trend that is emerging, thereby building a new "pyramid" on a more rapidly growing trend.
3) At the first sign of a trend reversal. Not breaking through important resistance levels, reversal patterns, breaking the trend line.
4) By tightening stop loss. Knocked out stop loss . Depending on which stop loss ordering technique you use, either single or fractional for each entry separately. Stopped, took profits and forgot about this trading tool. They began to search for a new instrument with a good entry point at the stage of trend emergence. Started the construction of a new "pyramid".
In my opinion, a reasonable solution is to partially take profit at some maximum levels with the trend growing. I am also part of the position about 30% aggressively trading increasing the asset. An important point at local maximums I sell these 30% almost completely, I already shop a large amount of assets from the support if I trade in an uptrend. As the trend progresses, I constantly pull up the lower stop loss (main position). 70% of the position is exited when the trend unfolds completely.
_______________________________
Benefits of money management by pyramiding or scaling.
Pyramiding works well with strong steady trend movements.
The advantages of pyramiding:
1) the bistro is increasing the deposit.
2) minimal risks, and with the development of a trend, there are no risks.
3) psychologically comfortable trading due to the absence of great risks.
_____________________________________________________________
Disadvantages of money management by pyramiding or scaling.
As you already understood, pyramiding works well in the trending market. If the market turns into a flat or a trend movement is accompanied by deep pullbacks, then the pyramid can be destroyed very quickly. On few liquid, weak instruments, this method does not work! On cryptocurrencies, this method only works on TOP. Coins such as BTC, LTC, ETH.
This method does not work:
1) In lateral flat movement.
2) With a weak trend.
3) In a trend with deep pullbacks, in which there will be uncertainty about further movement and they will knock out stops.
_______________________________________________________________
To be continued...

BTC.USD "Pivots Points" in action: Simple, Classic, Free TV indiWhat is a Pivot?
The word "Pivot" is used a lot, meaning many different things.
What I am showing is the ''Old-School'' definition of that term.
This "indicator" has been in use since 1970's with great results.
Pivots are as simple as this:
(H+L+C)/3 of the previous period = Center Pivot (P) in current period.
The 'Support' ( Sx ) and 'Resistance' ( Rx ) pivots are calculated based on above equation.
There are many variations used, but ''Traditional'' is the first, and I think most commonly used.
What do they tell you?
The seem to make good TARGETS for a move, and often lose energy there.
Many traders will look to take profits at a Pivot , which is obvious in above chart.
The real beauty is Pivots do NOT repaint, they are drawn at period beginning.
Who uses them?
Many, many traders still use them, as do Banks and Money Managers.
Swing traders looking for Daily, Weekly, or Monthly trades, set and forget.
Even Fibonacci fans such as myself will glance at the Pivots to get a bearing.
For a Tutorial on How to Use Pivots, see this Idea (and other chapters linked within):

BTC.USD "Pivots Points" in action: Simple, Classic, Free TV indiThe word "Pivot" is used a lot, meaning many different things.
What I am showing is the ''Old-School'' definition of that term.
This "indicator" has been in use since 1970's with great results.
Pivots are as simple as this:
(H+L+C)/3 of the previous period = Center Pivot (P) in current period.
The the 'Support' ( Sx ) and 'Resistance' ( Rx ) pivots are calculated based on above equation.
There are many variations these days, but ''Traditional'' is the first, and I think most commonly used.
What do they tell you?
The seem to make good TARGETS for a move, and often lose energy there.
Many traders will look to take profits at a Pivot, which is obvious in above chart.
The real beauty is Pivots do NOT repaint, they are drawn at period beginning.
Who uses them?
dMany, many traders still use them, as to Banks and Money Managers.
Swing traders who look for Daily, Weekly, or Monthly trades, set and forget.
Even Fibonacci fans such as myself will glance at the Pivots to get a bearing.
For a Tutorial on How to Use Pivots, see this Idea (and other chapters linked within):

How I Analyze the Markets - Part 4 of 4PUTTING IT ALL TOGETHER
=======================
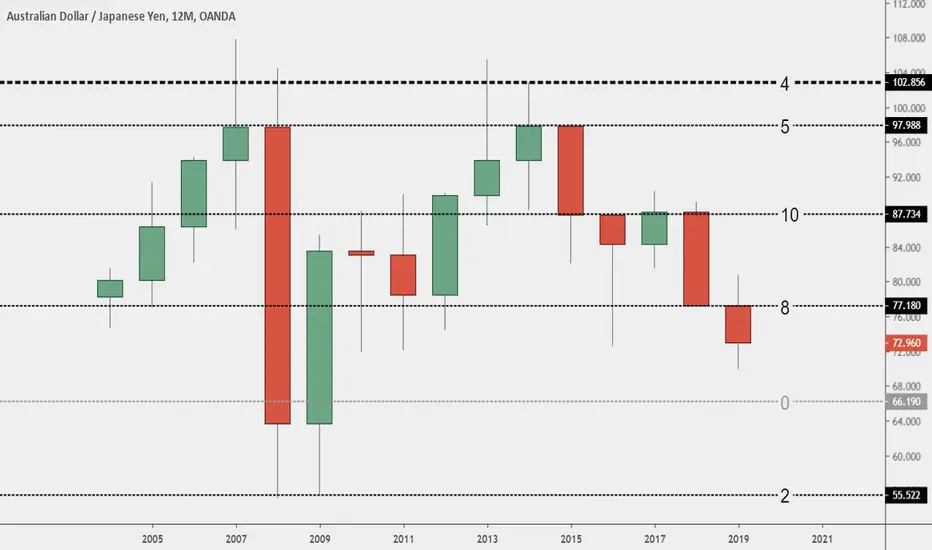
Window 1 shows the yearly candlesticks. Here I can see the long term trend is down. I can also see the real body of the 2019 candle is bearish (red) and is completely below the long term swing level at 77.217. This exposes the next lower support level at 66.19. I also know that it will take a new yearly candle, either 2020 or beyond, to reverse this long term downward trend. Further a yearly candle would have to close above 77.217 at the end of the year before this price level can be considered broken. Think about that! It will take more than a year from now for resistance from 77.217 to turn into new support. When we think about this we begin to understand why this price level is so important for us to know about as we analyze the short term markets.
Window 2 shows the monthly candlesticks along with the yearly pivot points. Here I can see the year started with candles below the pivot point "P" indicating the year started out with a bearish bias. When the market is below "P" I want to be a seller so I look for pullbacks. The ideal pullback candle occurred in April when April's candle formed a Pin Bar labeled "P" on the chart. This was a signal to go short. There were no other short signals before April. With the market in bear mode I would expect price to move down to support S2. Here I see the market tried to move down to S2 put then started to reject lower prices in August when the candle formed in August formed a lower shadow. This was a warning of a potential reversal ahead. September's candle formed an inside candle rejecting to move above S1 now acting a resistance. This is seen by noting the upper shadow in September's candle. I can now see October's candle breaking out above resistance at S1. Octobers candle made a higher low and if October closes the month with a higher high it will signal a reversal in trend from down to up for the intermediate term time frame (monthly chart).
Note: I also recognize on the monthly chart that a support or resistance level cannot be considered broken until the end of the month as the market must close above or below a support or resistance level at the end of the month for it to be considered to be broken. Another way of looking at this is that it takes one month for a support or resistance level on the monthly chart to be broken. This concept is important to understand as it gives us insight as to how significant certain support and resistance levels are.
Window 3 shows the daily candllesticks along with the monthly pivot points. Here I can see the month of October started out with a bearish bias. When the market opens below the monthly pivot point "P" I want to be a seller so I look for a pullback followed by a Short trade setup. No short trade setups occurred and price moved above "P". I also notice price never did trade down to support at S1. This tells me there were more buyers in the market than sellers and is a warning of a trend reversal. Once price moved above "P" it confirmed the trend reversal. Now I want to be a buyer and I look for a Long Trade Setup. The long trade setup came in the form of 3 doji's. A close above the first doji is a signal to go Long this market. However, I then realized price was too close to potential resistance at R1. So now I am waiting for a pullback for a better long term entry into this market.
Note: It is also important to understand that on the daily chart it only takes one daily candle to close above a support or resistance level in order to break that level.
Conclusion: It is important to gain an overall understanding of what the markets are doing or as to understand what the markets will do in the future. In this analysis I can see the long term trend is down but the intermediate term trend is up. I can also see the intermediate term trend will run into very strong resistance at 77.217. I can also see that until this market reaches 77.217 it is in a shorter term upward trend that could last until it reaches 77.217. At 77.217 I would then expect this market to turn back downward. There are several nuances I did not cover in this tutorial that I also take into consideration when analyzing the markets as it was not my intention to provide a complete description on how I analyze the markets but just to give enough of a description so as to provide a basic understanding of how I do analyze the markets.
This might seem quite involved and a long an intensive method of analysis, however when viewing the 3 windows side by side the analysis goes very quickly. This complete analysis is important so as to understand where all the important support and resistance levels are in order to gain a better understanding of what the market might do in the future.

How I Analyze the Markets - Part 2 of 4After I have plotted all the swing levels on the yearly chart I move to the monthly chart.
Chart setup: On the monthly chart I show the yearly pivot points. These pivot points are plotted on the chart from the beginning of the year to the end of the year. I also drawn in any swing levels from the yearly chart that pass through or are close the the yearly pivot points. In the chart I show the swing level from the yearly chart having 8 touches as it passes through the yearly pivot points. This swing level is drawn on the chart as a dashed black line at price level 77.180.
Analysis: The chart shows AUDJPY starting the year below the yearly pivot point "P". To floor traders pivot point "P" represents the "True Value" of AUDJPY for the year. When the market opens the year above true value it indicates the market is bullish and floor traders then expect price to continue to move upward towards "R2" by year end of before year end. When the market opens the year below true value it indicates the market is bearish and floor traders then expect price to continue to move lower towards "S2" by year end. Since AUDJPY began the year below "P" floor traders expected price to move lower for the year. As the chart shows price moved lower almost touching "S2" in August. The last part of August say price reject moving all the way down to "S2" and closed the month off its monthly low leaving a lower candlestick shadow. This indicates price rejecting lower prices and is an indication price wants to start moving higher. In September we see price move back up through "S1" during the month but then rejected higher prices closing out the month below "S1" leaving an upper shadow indicating price is rejecting higher prices. Also notice price moved below the yearly swing level at 77.180. It is going to take a lot of work for price to move back above this level. As a result I consider 77.180 to be a very strong resistance level and I do not expect price to move back above 77.180 any time soon. The last candle on the chart is the October candle that is only half way complete. It looks to me like this candle is testing resistance from "S2". I would not be surprised to see this candle close below last months low by the end of the month. This would keep in step with the monthly candles making lower highs and lower lows as the downward trend continues. With very strong overhead resistance at 77.180 above this months candle I would be surprised to see the market try to attack this resistance level. To get a closer look at this months trading we need to move to the daily chart.
To complete this monthly chart analysis I must mention the next possible very strong lower support level comes in at 66.1900 or 55.5200 (See yearly chart in Part 1 of this tutorial).
Note: I am analyzing AUDJPY to show how I analyze all my currency pairs to gain a complete understanding of the trading psychology behind each of these markets.
Conclusion: Price is in a downward trend and with very strong resistance just above at 77.180 I would expect this market to continue downward for several months ahead. Next very strong support level could come in at 66.1900 or lower.
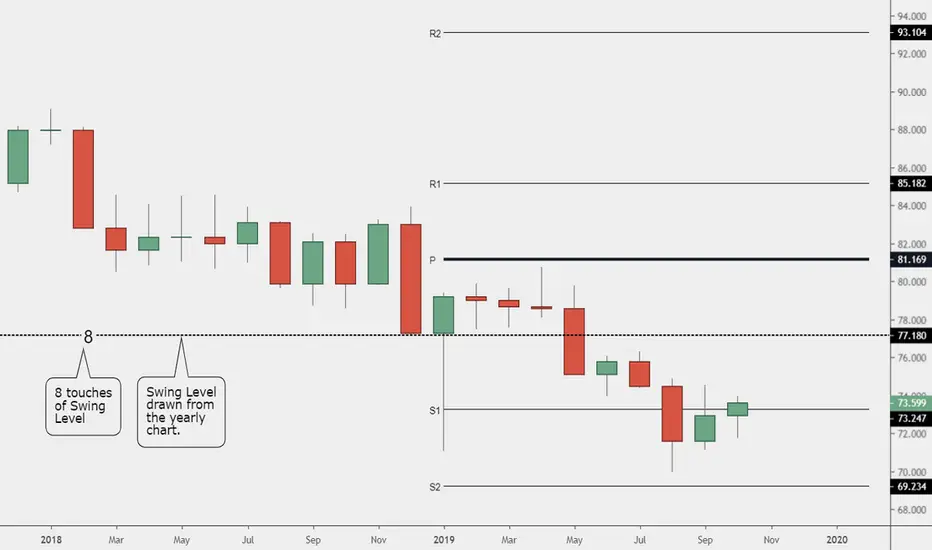
How I Analyze the Markets! - Part 1 or 4I start my analysis of each of the 22 currency pairs I trade by looking at the yearly chart. What? The yearly chart! Why? Because it is here that I find the most important swing levels. OK! OK! What is a "Swing Level?" A swing level is an important price level on the chart where traders make trade decisions. If there are more buyers than sellers at a swing level the market moves upward. If there are more sellers than buyers the market moves downward. A swing level on a chart is a price level that determines if the future price direction is going to be up or down. So how do I determine swing levels? To find these swing levels I look for price levels where bullish candles open at a swing level and close above the swing level and also where bearish candle open at the same swing level and close below the swing level. In addition if a bullish candle opens above a swing level its lower shadow must touch or move through the swing level and if a bearish candle opens below the swing level then its upper shadow must touch or move through the the same swing level. Further a bullish candle can open below a swing level and close at a swing level or a bearish candle can open above a swing level and close at the same swing level. Also if the bullish candle closes near a swing level but not at a swing level then its lower shadow must touch or move through the swing level or if a bearish candle opens near a swing level but not at a swing level its upper shadow must touch or move through the same swing level. Confused? I am! Let me show you what I mean by looking at some examples on a chart. On the chart look for the horizontal line identified with the number "8". This swing level shows there were 7 times when bullish candles opened at or above this swing level with their lower shadows touching or moving below the swing level or bearish candles closing at or above the swing level with their lower shadow touching or moving below the swing level. This line also shows 1 candle opened at the swing level and closed below it. Now look at the other swing levels and analyze them until you can reach the same count as I did.
There is one nuance I need to tell you about concerning swing levels. The majority of the time multiple swing levels on the chart will be spaced approximately equal distances apart. Having said that nothing is guaranteed. There will be times when multiple swing levels on a chart will be irregularly spaced.
I want to point out to you that there is one swing level that is missing. It is the swing level I have penciled in with the color 'grey'. I have penciled in this future swing level midway between the swing level above and below it. While not yet a valid swing level there does exist the possibility that as price continues to move downward during the year 2020 or 2021 this grey line could turn the trend back upward and would then be considered a possible swing level. I really like to see two valid points on a potential swing level before qualifying it as a valid swing level.
Note: Swing levels can be drawn on any chart time frame besides the yearly time frame so why do I draw them on the yearly time frame? Good question! Here is my answer! Swing levels on the yearly chart take years to develop. Swing levels on monthly chart takes months to develop. Swing levels on weekly charts takes weeks to develop and swing levels on daily charts on takes a few days to develop. When I consider the significance of each of swing levels on each of these time frames I consider the swing levels developed on the yearly chart to be the most significant and the swing levels developed on the daily charts to be the least significant. So what to I mean by significance. It is going to take a several years of trading decisions to move price from one side of the swing level on the yearly chart where on the daily chart it only takes a couple of days worth of trade decisions to move price from one side of the chart to the other side.
OK, so why do I care about the significance of these swing levels? This is the "take-away" from this lesson. If I am trading on the daily or 4 hour chart and price runs into a yearly swing level I know that the majority of times price is going to reverse its trend. Further, should price move through a yearly swing level I know that it will eventually move back to it. Thus these are extremely important price levels to know about and gives the trader an edge over the market.
Here are a few other examples of yearly swing levels:
Dragon figure. Formation. Structure. Targets.“Dragon” is a reversal pattern that indicates almost the very beginning of a trend reversal. The formation of the Dragon tells the trader that market sentiment may change soon and the current trend will unfold.
The figure is a more modified version of the "Double bottom" or "W" shape, while it signals the change of the bear market to the bull market. But there is one fundamental difference from the “Double Bottom” figure.
A prerequisite for the formation of the Dragon is a trend line drawn through the head and hump of this model ("Dragon Ridge").
It is important that this trend line is clearly visible on the chart. The trend line plays an almost decisive role in the figure.
“Dragon” and “Inverted Dragon” with the correct identification and understanding of the work, you can get good profit on various time frames.
The figure “Dragon” and its mirror image “Inverted Dragon” are very similar to the figures “Double top” and “Double bottom”, however, they also have significant differences, which will be described below.
________________________________________________
There are two types of this figure, depending on the trend:
1) “Dragon” - is formed during a downtrend and signals a trend change to an uptrend;
2) “Inverted Dragon” - is formed during an uptrend and signals a trend change to a downtrend .
___________________________________________________
The figure "Dragon" got its name due to some similarities with the fairy-tale character: he also has a head, two legs, a tail and a hump on his back.
The figure "Dragon" consists of 5 parts, formed in the following order:
1) Dragon Head - the maximum price of all parts of the figure;
2) The first paw of the Dragon - a local minimum price;
3) The Hump of the Dragon - the maximum price between its paws;
4) The second paw of the Dragon is another minimum located slightly below / above the first paw, in rare cases equal to the minimum of the first paw;
5) Dragon Tail is the target price that should bring you revenue.
____________________________________________________
Additional signals that confirm the trend reversal and enhance the development of the "Dragon" figure:
1) The ratio of the length of the "dragon's paws" - if the "second paw" is longer, then there is more confidence in the upcoming turn.
2) When the level of the "second paw" coincides with some important level of support / resistance, already tested in the past, this also enhances the development of the figure.
3) Candles are strongly pronounced (large bodies with short shadows) that have gone in the opposite direction after the formation of the "second paw", the greater the likelihood of a change in the current trend.
4) The more a trend exists, the more likely it will end. The “Dragon” pattern is often in the 5th wave of the trend and in this case the reversal signal is very reliable.
5) An additional confirmation signal can be an increase in the indicators of the trading volume, which should increase during the break through the price of the downward trend line of the “Dragon” figure (resistance). This is the line drawn from the top of the Dragon Head to the bottom of the Dragon Hump.
__________________________________________
Setting goals when working with a figure.
There are two options for entering a deal:
1) Entrance when breaking the line of the "Dragon Range" of the downtrend (line- "Head" - "Hump").
2) Entrance when breaking through the "Hump of the Dragon" level.
__________________________________________
Now you need to decide on our targets:
The first targets will be at the level of the last maximum - the level of "Hump".
The second target will be at Head level
The third target is, in rare cases - the full length of the fall from the “Head” to the lowest “Paw” - then from the breakdown point of the downward trend line (“Dragon Ridge”) we set the entire length of the last price
See the chart above. The graph shows that it was the Third Goal that worked completely on the graph.

Example of BTCUSD Charting with PAL8H:
1H:
4H:
30m:
EMAs used are 20/50/100. PAL (Price Action Levels) is used to automatically draw the relevant Open/High/Low.

Profit on NZDUSD!Hi @FollowMyForex fans!
After our last update, all our targets were hit netting us a nice profit of +43 pips. By actively managing the position we were able to identify a change in the market momentum, adjust accordingly and take full advantage of it! Gotta love it when a plan works out like this ;)
On to the next!

Pivot Points with TDI ProI am going to show you how to use Pivot Points with TDI to make the best use out of the three powerful indicators: Hull Moving Average, Fibonacci Pivots, and TDI indicator.

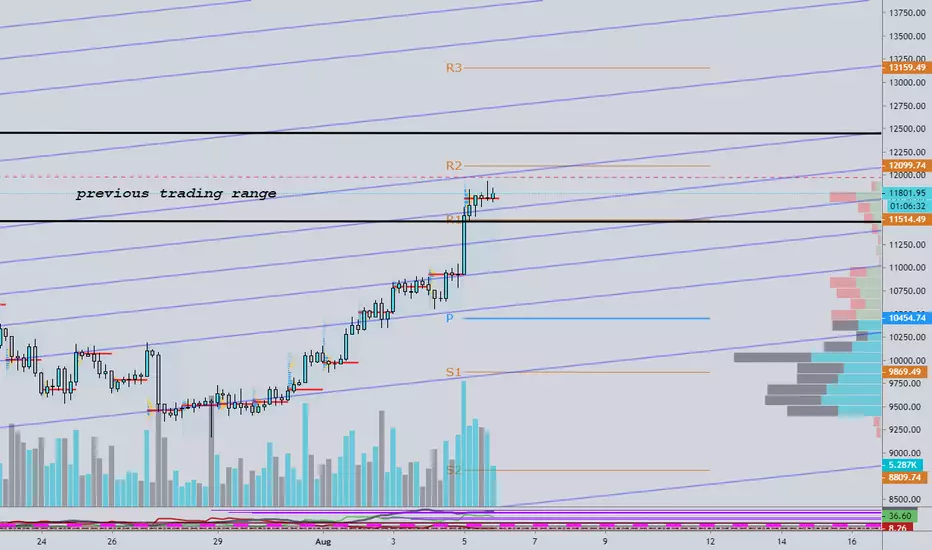
BTC 4H Look with Pivots and a Fork to get a grip on it . Hi .
Thank you for looking . . Its hard ATM for anyone to predict whats going on . I was trying to put some sort of channel on this and after doing so I dragged the pitchfork and they mach perfectly so why bother ... I think this is good look for now with this price moves . We can still see accumulation on smaller time frames witch its conforming the trend .. Until we see major sales accruing we are marching up for now looks like .. Pivots are great to see the trend . I have Weakly pivots in place to give us and idea and support zones . We are currently in trading range from previous run . Historically we accumulated in this zone around EQ and then pushed thru . If we see some major problems with this area we have to consider other options then straight bull run and hitting previous high . I will follow with my other platform soon waiting for big cluster to tell us whats going on. For now there are small sell and buy orders going thru . But staying in positive delta Makes me think we going Up and to hit the top of that channel before some pull back .
Happy Trading . Thumbs up keeps me motivated so if you like my content hit one .
Part 2. The Power of Algorithmic Support and Resistance - AppleWelcome to Part 2 of the series examining algorithmic support and resistance (S/R).
Today we'll check out Apple Inc (AAPL), and how the algorithm defined S/R zones over the last 15 years.
So, as I mentioned in Part 1 (see the Related Ideas link below), the algorithm incorporates a number of factors to determine, in real-time, viable support and resistance zones. I primarily trade currencies, and dabble with some indexes, so I was interested to see how the algo performed in a upward biased equity market (equity markets, unlike currency markets, have an intrinsic upward momentum over the long-term). Spoiler alert: it was almost flawless.
Now, I have to admit that I've cherry picked this example; not every equity/currency/index/bond market will work this well - but it is a good example of how valid the algo is. But, like every tool in a technical analysts arsenal, nothing works every time.
Okay, without further rambling, let's check out some examples. We'll start back in 2006:
So far, so good! There were heaps of great tradeable signals provided by the algo. Remember, as soon as a zone is identified (the vertical background colours), you can trade any subsequent signal - there's no need to wait for confirmation of the zones validity. Let's have a look at the next chart:
The really interesting thing for me is how price gets stuck between Zone 3 and Zone 4. This is a perfect example that highlights how accurately the algo manages to identify zones, and how the market respects them in a consistent manner. Onto the next chart:
Here we can see how, even when a zone is initially breached, it can later provide significant support/resistance. We never know exactly when a market is going to respect a zone - we simply have to wait for market/price confirmation. The next chart:
Again, some really great trading opportunities here. Breakouts and retests of S/R zones are particularly great trades. You will sometimes experience false breakouts, but that's where trade and risk management comes into play. I really love how zones can come back into play years after they're formed. Okay, the last chart:
Now we're up to date! Zone 8 again provided some great opportunities, and Zone 9 has yet to be re-tested by the market.
That's all I wanted to cover for today. Basically just providing further examples of how the algo forms zones, and how the market (fairly) reliably reacts to them. Knowing where the market may react and where price may turn is half the battle. As you can see, you could have made a great deal of money trading these signals (ignoring the fact you could have made a great deal just buying and holding Apple, but that's not what we're looking at today).
Feel free to get in touch if you have any comments or questions!
All the best,
DD

Donchian Channels + Bollinger BandsIn the beginning of the video I lie, it is not July 27th, it is in fact July 17th ;)
I talk about using Donchian close channels combined with Bollinger Bands and how they compliment each other in trades.
Indicator link at the bottom of this page.

Part 1. An Algorithm Based Support & Resistance ToolWelcome!
Today I'll be demonstrating the efficacy of a method I've determined to identify and trade support and resistance (S/R) zones in real-time.
Normally, traditional technical analysis requires a S/R zone to experience multiple validation events (touches, reverses, bounces), before it becomes tradeable. The downside to this method is that numerous profitable trades are bypassed while confirmation is being developed. Unfortunately, many of the most profitable S/R trades appear soon after a level develops (think double/triple tops).
After much research and experimentation, I've come up with a tool/indicator that can identify significant S/R zones in real-time. Once a bar closes, there is ZERO repainting. As the chart above shows, this means that you can trade a level as soon as price returns to it - no matter how quickly that occurs.
The tool takes into account (not in order of weight):
Price action
Volume
Chart patterns
Volatility
Momentum
By combining multiple methods of analysis, levels are formed quickly, yet accurately. It's pretty important at this point to mention that I'm not claiming this is a get rich quick plan. All the tool does is identify potentially profitable zones that price will often react to. However, it's not infallible (nothing is), and it doesn't teach you to trade. You, as the trader, need to know how to trade price action to ensure a confirmation signal is given before trading a S/R event. You also need to know how to set a stop less, determine appropriate levels of risk, and undertake trade management to ensure profitability.
Now, some people say S/R zones are easy to identify - in that case, what's the point of this tool? Simply, this tool takes the guesswork/bias out of S/R zones. As human beings, we're uniquely unsuited to investing money. We're irrational, emotional, ill-disciplined, and impulsive. Frankly, the average person (of which I'm one), needs every useful tool they can get their hands on. This tool means that one step (determining a trade area), is covered for you. That's it.
Given the proprietary nature of the tool, and the value it has, I won't be releasing the code for it. At least not yet. However, something I really enjoy is helping other traders, so I've decided to start producing charts across various markets that identify relevant S/R zones identified by this tool. At this point in time they'll be provided free of charge, but depending on the demand for multiple markets (and time frames), that may change in the future.
Oh, and remember that zone I mention in the chart above? The one between 27.47 and 27.17? The one from 1995? See the comments below for an example of how it came into play 24 years later...
If you have any queries please let me know. And let me know which charts & time frames (bearing in mind, like most things, the higher the time frame the more reliable the signals).
DD

AUDNZD, buy and buy in dip.
Follow and LIKE if my work is useful for others.
Buy at value low with excess and tail is perfection. Everything is mentioned in the chart.
This chart showing you fair value working for a long time.

Every excess detected at resistance, 100% sure sell.
1) Very tight channel detect here with 3 excess and currently forming 4rd an excess. I prefer to sell when price with excess at a value high.
2) The tail should be in excess is more accurate.
--> First condition meet here, short at a higher price will be great. Each trade must have a protective stop, therefore keep your stop above resistance.
---> Wait for the 2nd condition to meet and enjoy 99% accurate trade.
Hit LIKE button if you want to alert REAL-TIME .
It is not gambling if you know what you’re doing. It is gambling if you’re just throwing money into a deal and praying. - by Kinnari Prajapati

95% WINRATE STRATEGY? (MUST WATCH!) PART 3/3There’s a better way to do things. I don’t care what you’re using, maybe, just maybe, there’s a way to improve your strategy. I can confirm this idea is seen as wildly offensive. Ask someone why their strategy works and they’ll cringe like you just asked them if their spouse is cheating. “How dare you question their effectiveness! I’ll let you know we have a long history together and I love them very much.” I’m sure you do, but have you noticed some of the warning signs? They’re all right there in front of you. It may not feel good when I ask, but if the signs are there and 3/4ths of marriages fail, it wouldn’t sit well with me if I didn’t speak up just to keep you comfy cozy.
Analogies aside, your “spouse” is your strategy. The warning sign is that you keep on losing trades, blaming your loses on “volatility” without wanting to admit what the real problem is. Perhaps you’re still green for now, just wait for a larger sample size of a trade history. Much like your imaginary marriage, the odds are wildly against you. Why do you think 95 plus percent of traders fail? You can massage data however you like, the problem is at some point you decided to stop improving because you got confident.

EURUSD Perfect Pivot Play : EU pivoting downwardHere is a great example of how TV's free indicator "Pivot Points Standard" can be used.
EU started this Month in a Picture Perfect fashion, for anybody watching Pivot Points.
Pivot traders take Swings that start or end at the Central Pivot, of the timeframe of interest.
Pivot Strategy :
If rejected from Daily Central, target the daily M1.
If rejected from Weekly Central, target the weekly M1.
If rejected from Monthly Central, target monthly M1.
(or vice versa, swing from M1 to the Central).
That term ''Pivot'' is used to describe many different things by different people.
BUT there is only ONE true ''Pivot Point'', per each period.
The above chart has Daily (blue), Weekly (green) and Monthly (brown) pivots .
See my three chapter Guide to Pivot Points: one of TV's greatest free tools'' below :

AUDCHF - love the fade post newsI love fading the AUD pairs after news. I love it when they spike. Just saying.
Here's an episode of the podcast where I talked about trading the news.
Nothing to buy, just something to share.
traderspodcast.com

LTCUSD Pivot Point study: LItecoin shows it knows PivotsThis is a current example of TV's free ''Pivot Points Standard'' indicator.
All of those Pivot lines are drawn at the beginning of each period.
They do not 'repaint' like most other indicators, making for good targets.
Last week was a perfect Pivot trade, weekly R1 to S1, a common swing.
This week the Monthly (new for Jan.) Pivot was found to be support.
So it is possible that the Monthly R1 will be hit before the end of Jan.
NOTE
The term ''Pivot'' or ''Pivot Point'' is used in different manners by different people.
But originally, that term described a very specific method of calculating pivot price points.
TV has captured that original method, in the standard indicator ''Pivot Points Standard''.
Here is a 3-chapter guide to using TV's indicator

XMRBTC pivot point play: Monero at a Central ClusterXMRBTC is at an interesting price, for anybody watching Pivot Points.
That term ''Pivot'' is used to describe many different things by different people.
BUT there is only ONE true ''Pivot Point'', per each period.
The above chart is showing Weekly (green) and Monthly (brown) pivots.
See my three chapter Guide to Pivot Points: one of TV's greatest free tools'' below:

HOW TO TRADE WITH THE TREND + IDENTIFY TREND REVERSALS / VIDEO This is a 9 minute video that covers how to ensure you are trading on the right side of the trend.
Lots of good stuff on this topic, unfortunately it's impossible to cover everything in the 10 minute limit provided by TradingView for videos, so if you have any questions please feel free to get in touch.
