CADJPY Bullish and Bearsih scenarioCADJPY
BULLISH SCENARIO : retest and continue upwards
BEARISH SCENARIO : drop below support and retest rejecting the new resistance line
NOTE : personally I am leaning towards the possibility of a sell.
Scenarios

Bitcoin Weekly Analysis: Important Support. Hi, I’m David and I write one of the most read columns in the Netherlands about Bitcoin on a Dutch crypto platform for several years now. As of now I will also share my columns on TradingView. I hope you enjoy! More info about me you can find in my bio.
Last week it finally happened! The 200-day Moving Average (MA) was broken upward with a lot of force and the price of Bitcoin surged to $ 9500 on coinbase. A resistance that I indicated as the next important resistance in my previous analyzes. By crushing the 200-day MA, all major Moving Averages haven been broken to the upside. I'm talking about the 200-, 50 day and the 21 week Moving Average. I was of course bullish for a long time and when Bitcoin's price went into the $ 6XXX zone, I thought it was the best time to go long and to increase positions. At that time my arguments were mainly based on my personal analysis that the underlying trend was bullish as a result of observing that the upward action was stronger and more aggressive than the downward action where the price of Bitcoin slipped slowly away and with little volume. In addition, there was of course strong support in the $ 6XXX area and it was that combination that made me so bullish at the time. By breaking important resistances and Mas over the last few weeks, however, we now also have proof on the chart that the trend is bullish and, as I described last week, I think that the brakes are now off for Bitcoin! Anyway, the fact that I think we're just on the eve of a big rally doesn't mean we're going there in 1 straight line. In fact, there are few things that are certain and that I can guarantee in trading, and this is one of them: while the trend is bullish, the price will see rallies and pullbacks! I mainly trade the weekly and monthly charts and the art of surfing a long trend is not to grab your profits too quickly and not to panic in a pull-back. In those long waves, in my view, is where the real money lies and to get that you need a healthy dose of confidence to stay put when it gets exciting and it is now exciting because with an open-interest of more than a billion on Bitmex and the fact that the price of Bitcoin is moving against the resistance of $ 9500, we are about to shoot up (on the way to the resistance of $ 10400) or first make a retrace. Yes indeed. The price can go up or down (go figure). Anyway, it doesn't matter because as you may know I always do scenario planning and I am prepared for any outcome of the $ 9500 battle.
In figure 1 I have shown the daily chart of Bitcoin on coinbase and the first thing I notice is that a bullish flag has formed on this chart. The fact that the price of Bitcoin is consolidating at such a high level after the previous rally is a positive sign for me. At the same moment we can see from the wicks at the top of a number of daily candles last week that the resistance around the $ 9500 is not small but that at the same time the support on the $ 9200 level is also strong. The bulls and bears are in a stand-off. As a result of the previous rally, the bullish trend and the formation of a bull flag, I do give the bulls the benefit of the doubt.
In the above figure we also see that after a very long time the 200-day MA (orange line) is finally flattening out (since the price of Bitcoin moved north again off the 200-day MA it is expected that the 200-day MA will be upward sloping within the foreseeable future as long as the price remains north off it off course) and we also see that the 50-day MA (blue line) that was broken some time ago now has a lot of momentum. It will probably not be long before we see a golden cross (50-day MA breaks the 200-day MA). Anyway, most people know that the chart looks bullish. However, the momentum indicators on both the daily and weekly charts show that the power of the bulls is decreasing somewhat (this is also reflected in the consolidating candles) and that the volume is also decreasing. The fact that the price is pushing against the resistance at $ 9500 leaves a possibility open for a short pullback. If a retrace would take place, I will first look at the $ 9200 zone. This is because this level is the lower limit of the bull flag and in addition this level has acted as strong support several times in the past week. However, should the price break downward through this level and actually make a close below this level (on the daily chart), I would immediately look at the support zone around $ 8800-9000. In order to maintain strong upward momentum, I personally think it is important that the $ 9200 is maintained because as long as that level persists, the bullish flag is still fully intact, and I believe there will be sufficient confidence to break the $ 9500 AND $ 10400. In that scenario the price of Bitcoin would reach five-digit values again, and that should sound like music to most people, I guess. Anyway, back to the scenario where the price of Bitcoin makes a pullback. If the $ 9200 doesn't last, I would - as I just indicated - immediately look at the zone around the $ 8800-9000. In my view, this zone must hold because in addition to the fact that the $ 8800 is an important support level anyway, this level also includes the 200-day MA! A retrace back to the 200-day MA where support would be confirmed on the 200-day MA would also be a good scenario (in addition to keeping the bull flag intact) because this scenario would confirm that breaking the 200-day MA wasn't just a lucky shot but that the 200-day MA is here to stay and that in the coming period the market can have confidence that there is strong support at this level. Since I am bullish and since the trend confirms this, it believe it is wise to go long on the dips. Should the price fall back to a level of $ 9200 and find support on this level, then this can already be a good moment to increase or open positions. For the real short-term trader this is a good idea anyway because they can of course trade the flag whereby positions are opened and closed on the bottom and top off the flag. A break downward through the $ 9200 with subsequent support on the 200-day MA would, in my view, lead to the best entry and be truly a bonus. It would create a situation where a Stop-Loss can be established very well (take into account any wicks that may form but look at a level of $ 8500-8600 for the S/L, for example) and would also be a great position for breaking $ 10k+ levels. A break through the 200-day MA would make the whole chart rather bearish (although there would still be hope at a few other levels which I will share in case that happens), certainly if the 200-day MA will start to act as a resistance afterwards, but so far there are no signs of this and I do not see this happening quickly.
On the other hand, a move upwards through the $ 9500 would open the road to first the $ 10000 and then the resistance around the $ 10400-10600. Personally, I think that as soon as the price breaks the $ 9500, the $ 10000 is also virtually broken because the price of Bitcoin is naturally attracted to this level. The challenge will mainly be in the zone around $ 10400-10600 because around this level we can see clearly on the weekly chart (but also on the daily chart) that there is fierce resistance (Figure 2).
A break upward through the $ 9500 would therefore automatically make me look at the zone around $ 10400-10600. Shorter-term traders could secure some profits in this zone.
Although the momentum indicators are on the high side, there is still ample room for direct continuation of the rally. It would not surprise me if the current bull flag holds and the rally immediately continues its hunt for the $ 10k and then the level above that at $ 10400. On the other hand, a retrace up to the 200-day MA would not be bad news either, as confirmed support at this level will pay off considerably in the longer run because a market with confidence reaches higher than a market that is restless and continues to rise without confirming important support. All in all, I am and remain bullish and I would certainly not panic from a small pull back (as long as the 200-day MA lasts!). It will be an exciting week because I think there will be a lot of volatility! Enjoy your day and see you next week!


BITCOIN DAILY, Patience Is Key!Dear Traders,
Right now we're sitting in the middle of the parallel channel.
We can predict alot of situations based on this chart.
On the short-term bearish scenario, Bitcoin can retrace at support of our parallel channel, we can expect upward at 10,555.
On the mid-term bearish scenario, bitcoin could break our parallel channel, possibly retracing back to our descending triangle, this is a major support. From there we can expect bitcoin to go back upward.
On the long-term bearish scenario, bitcoin could break our descending triangle, which indicates a very bearish sign, with possible correction to our 6000-6500 level.
On the bullish side, bitcoin could breakout from our descending triangle and possibly create higher highs, which is a very bullish sign.
Like the title says, patience is key! we have to follow the market very close.
If you like my Trading Analysis, please leave a like and follow me!

S&P 500 possible buy set upThe Price is in its highest level and had retested it twice, so we are expecting it to break it and seek for new highs.
RSI shows overbought levels but could be the confirmation of the ruptura once the candle closes above the resistance.
Another scenario is a pullback and then the Price Will continue the upwards trend.
We should wait for the buy in both scenarios.

Can Ethereum follow Bitcoin? If 320$ price level breaks bullishI think Ethereum price depends on where Bitcoin price goes. First, we need Bitcoin to reach new highs around 11200-11300$ then I think Ethereum will start test the resistance around 320$ (lines up with 0.236 fibonacci level)
If it breaks up, then my next target is around 390-400$, if fails I think Ethereum will retest the support zone. At the moment there is a bearish divergence, but if the RSI can reach a higher high it will become invalid.

BTC NEARING CRUCIAL TIPPING POINTWhen you look at the chart we can see that we are nearing the apex of another triangle. Although we broke bullish this weekend, the chances of the long awaited correction are still there.
IF the triangle is broken and we go below the previous ATH, we can expect a drop to 8100/7900. When the 100MA and 200MA on the daily are broken we can see a drop to even lower levels to around 6700.
WHEN we break bullish we can expect a run up to about 11000, if we manage to break the resistance around 9800. Chances are slim, but looking at the overall market the past few months there is no scenario crazy enough.
This being said, there are two scenario's once again. Looking at the past few month BTC holders are afraid to sell their coin. On the other hand people are keeping on buying like their lives depend on it. We do need to realize that there are a lot of stops in play around 8300. Once these are broken by a stop hunt for instance (happend a lot the past weeks), we can see a dramatic dump due to sell orders activated.

ETHBTC Potential Paths to moon or doomPrice only goes up or down, but the paths it can take are infinite.
To help fight my biases I take a number of potential paths including important zones where price is more likely to stall or bounce.
With ETHBTC the over-all shape since the lows is that of a large flag which could lead to an impulsive break up. The move resulting from this would be powerful, but we don't know when it may happen, so here are some potential scenarios.
A bear break has a similar potential to be a large move.
As always risk management is key.


BTC Scenarios for January '19Today's BTC drop move is very welcomed from a technical perspective because it adds some clarity to the picture.
I have activated a couple of Daily scenarios to be monitored.
First one (orange arrows) would give us some bullish market structure drawing a bottom at around 3400 (Binance).
The second one (teal arrows) assumes a deeper correction back to 2800 area, and start drawing market structure from that point.
I am not (yet) focusing into sub-2000 levels, since that belongs to Weekly based scenarios and would be a consequence of the failure of 2800 area.

BAT/BTC Basic Attention token a Follow-Up, and possible scenarioLast post:
' BATBTC Basic attention token small rebound expected, not rallies'
Written ~3949, later rebounded to ~4200, then to now ~3650
Future scenarios:
Scenario A:
- Supported at ~3600 (Last trend; 50EMA)
- Trough seen in a few days, need to refer to MACD and stochastic
Scenario B:
- Does not find support
- Next stop could be 2600-2800
I hope buying it lower though.

BTC – 4 scenarios to follow in the near futureHi Guys!
BTC is struggling with the lack of an interest thus volume is very low.
We distinguished 4 possible (fulfilling) scenarios in the close future.
The price chart is currently in the middle of the rectangular triangle which is a neutral pattern.
We broke EMA 9 and EMA 21 and what is even more important EMA9 broke EMA 21. This is positive.
We are at the end of the falling wedge which is also bullish but in order to jump up out of this pattern, we need more positive volume.
Speaking of which when looking at the Weis Waves we can clearly see there is no interest. A bit of demand has shown up and no supply. So this
is touch and go and e have to wait for more information and observe this pattern.
We can also distinguish weakly tilted support which might be another level of the support.
MACD looks good as we can see their positive divergence.
Here are 4 possible scenarios
1. The most optimistic one – due to positive info we will have more demand and we will manage to break up the triangle shape which ends up
at $6500 level and we will even go further breaking another resistance at $6600.
2. Neutral one – we will stay in the triangle moving slowly towards $6500 level.
3. Slightly negative – we can mark up weakly tilted support which might be another level of the support. It is possible to stop there but still,
this is below the triangle pattern.
4. Negative – we jump out of the triangle pattern and the break the support down. Anyway, we should stay within falling wedge borders.
So guys, time will tell which scenario will come into effect.
The first info we should get will be as soon as 5th of November.
On Monday SEC will decide whether they postpone their decision regarding ETFs again (most likely) or they will say YES or NO (less likely).
So thank you for being here. Please take a bit of LOVE from us. <3 <3 <3
If you like our job please do give us a like.
Don’t want to miss the update = click follow on our profile.
MASSIVE Hugs!
WBM Team.

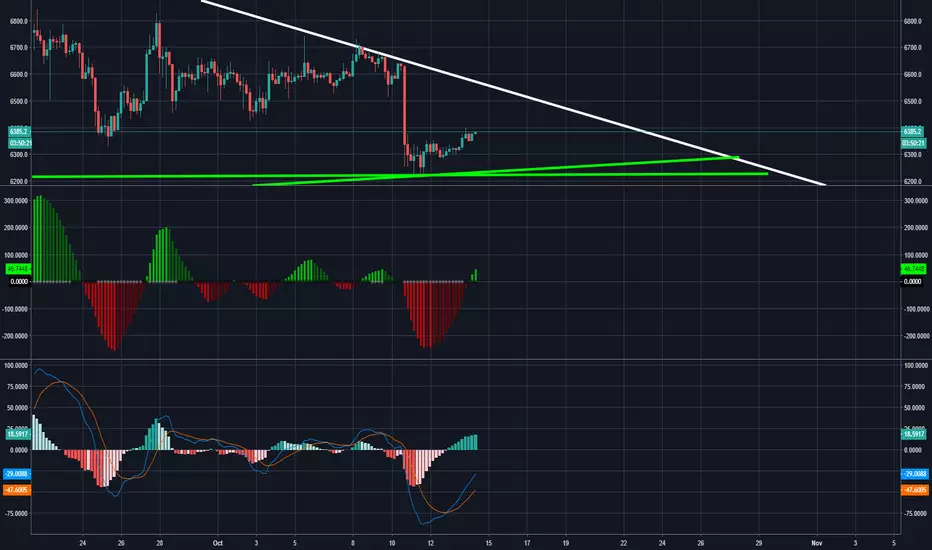
Possible Bitcoin Scenario's.Bitcoin is currently trading within a very tight range. We've got overhead resistance from our long-term descending triangle or wedge formation depending on how you look at it, and we've got our support trend-line(s) from our previous bottoms and previous support area's that we hit earlier in the year. I believe there is 2 scenario's which could play out here over the next few hours.
1.) Bitcoin moves from its current levels to 6500-6550 before finding resistance and moving back down to test the trend-line(s) around 6200-6250. There is a chance it could break above 6500-6550, I discuss that below.
2.) Bitcoin is unable to sustain its current (albeit limited) upward movement and moves back down to test the trend-line(s) around 6200-6250. There is also a chance it breaks below 6200-6250, and I discuss that below as well.
Based on the 4-hour indicators I have shown, I favor scenario 1 as of right now. MACD on the 4-hour is showing upward movement following a bullish cross on October 12th, and the Squeeze Momentum indicator is showing signs of upward momentum alongside that. RSI is sitting at 48, which is right below the bullish zone indicating it has room to move to the upside if we did some upward price action. I think a test of the resistance zone around 6500-6550 should occur, and if we are unable to break through and have sustained volume and buying around those levels, then we could see a retest of 6200-6250. If we do get a break above that area, 6650 is the next area to watch, followed by 6700, then 6800. For a bullish trend to take place, we need to get above some of the key moving averages (50/100/200 day,) we need to get out of the descending triangle or wedge formation that we are in, we need to make a higher-low, and we need to maintain higher levels of volume throughout any upside action. On the flip-side, if 6200-6250 support (depends on which pattern you look at) is unable to hold, we could see a retest of 5800-6000. If the 5800-6000 area is unable is hold, we could be in for a wild ride down to 4000-4500 (if not lower.)
--This is not financial advice. Always do your own research and come to your own conclusions before buying/investing, as investing in cryptocurrencies comes with high risk and high amounts of volatility.
Neutral - Watch and shoot. 2 potential scenariosI'm currently neutral and watch EURUSD.
LONG:
We could see a continuation of the upward trend on the 1 hour, also supported by the oversold on the RSI - this will see a TP in the red zone TP1.
SHORT:
This is will be the bigger move of the 2 scenarios.
Note the potential double top on the 4 hour chart with two potential TP Targets. Waiting for a break of the 1 hour support line to enter a short trade.
Both scenarios are possible, I am waiting for the market to provide the confirmation of direction.

BTCUSD Possible Scenarios Martin Trend Line BITMEX SignalThis is a better picture of the short term idk why i had it so zoomed out, still figuring TV out.

Bitcoin Long Term Plan - two scenarios After receiving mass hype and exposure, bitcoin topped off at $20000, the same day bitcoin futures starting trading. Since then, bitcoin has been consolidating and forming a massive wedge. Completion of this wedge will indicate which way we can expect price action to swing. Volume has been on a slow and steady decline. The Kujin and 300-day moving average are acting as a strong support. Also, visible range shows that we are in the thick, which means a majority of orders were taken within this range, which means that this area is both the strongest support and biggest resistance. Worst case scenario we complete this wedge and break down to our strongest support at $5000. Best case scenario, we enter a post-consensus bull market and bitcoin breaks right through the wedge and confirms an upward price action. We would then look at our three biggest resistances which are the 200-day moving average, top of the cloud, and the $11750 area. I would expect some struggles around this area but a break above would take us straight to $20000. Other possible scenario, we complete this wedge and slowly form an uptrend. We would then have some liquidation battles at the big resistance and would ultimately watch the move from here. It is best to plan out your trading and all of the possible scenarios that can occur. I personally expect the most bullish scenario to happen, a post-consensus run straight to $20000 while alts moon. However if that doesn't happen, I am still prepared.

DASH - Long term: Multiple ScenariosGreen = Bullish Scenario (Highly Unlikely - approx. 5% chance)
Yellow = Unbiased Scenario (Extremely Likely - approx. 70% chance)
Red = Bearish Scenario (Somewhat Likely - approx. 35% chance)
Dash likes to aggressively spike on the way up and down. Hence, you need to be in the trade before the breakout.
The support and resistance zones, visualized with rectangles, are your accumulation and distribution zones. These levels can be used for ping pong strategies.
As of today, the best trading strategy to trade DASH is to scale your buy orders (give more weight to lower prices), and to stay in the trade until it enters the resistance zone which is your sell target. This will take less than 4 months.

Possible Scenarios for BTC Based on Support and ResistanceSo I have plotted the scenarios for BTC, please note that it has not been accurately plotted for actual times so dates/times may be off but prices and levels are all based on correct support and resistance areas and if we break through each support or resistance point there is secondary scenarios to play out. The most logical right now is if we break through 9200 we are headed to 7000 most likely.
If you appreciated the analysis please follow me and comment. Thanks! :)

EUR USD - EUR Minimum Bid Rate possible scenariosEUR Minimum Bid Rate possible scenarios
The EURUSD general trend is the 1.3000 area

Ascending broadening wedge - two possible scenariosThis is an interesting move folks; identifying an ascending broadening wedge pattern has the same chance more or less to continue downward or to breakout and go upward. In my opinion, based on the bigger trend's descending triangle wedge, and the minor descending triangle wedge following it (the fib retracements placed on the graph), my bet would go towards the bearish breakout.
What do you guys think?
Below are some interesting facts to use in your strategies:
Bearish breakout
If the wedge’s lower support line breaks, the probability that the price will reverse and continue back up is higher than it falling lower. The odds are close at about 51:49.
Selling at a downward break of the mid line of the pattern greatly improves the odds of success. If the price breaks the mid line of an ascending broadening wedge, there’s a 53% chance that a further downward move will happen.
Bullish continuation
From historical currency data, there is about a 55% probability of a further bullish advancement after a break of the upper resistance line. The bullish move lasts at least for the same duration as the pattern itself.
Based on historical forex data, the ascending broadening wedge typically ends in a bearish or downwards correction in price. But only just.In 47.8% of the patterns, the upside move was greater.
Reference/Read more at:
forexop.com

Four S&P 500 crash scenarios for Q4 2016, potential support 2017After a long battle the bears are gaining control again at the start of earnings season one month before the US election.
The odds for the bulls to hold the red trend line the next weeks are slim and falling, therefore I drew four scenarios how the "S&P 500" might move in the last quarter of the year 2016 and further in the year 2017 after the US election. I suspect one last bounce higher to occur in the next two weeks, which would be a better time to post this bearish chart, but on the big picture as mentioned before I don't see this changing the outlook anymore. This is the reason though why I post this chart as "neutral" and not as "short", because the crash scenarios are not fully confirmed yet with a final bull trap.
Scenario A:
Awesome. A fast but brief drop into support around 2085-2100-2115. Followed by a very strong rally starting in the first quarter of 2017 with rally target 2300 points for the year 2017 (maybe the rally starts even earlier after the US election, after a December FED rate hike).
Scenario B:
A slow choppy but controlled pullback into support around 2015-2030-2045. This scenario also offers the chance of a very strong rally back towards at least 2200 points again in the year 2017.
Scenario C:
A fast chaotic crash below 2100 might find support around 1950-1975-2000 points. Most likely after this large decline the stock market might only move back up to 2150 in the year 2017 to test the resistance there.
Scenario D:
Doom. A massive flash crash due to the lack of liquidity in the market and the burst of the real estate REIT bubble, tech unicorn FANG bubble and the overall ETF market bubble (among many other bubbles which might burst simultaneously as mentioned in the related link "Bubbles everywhere" below).
My original idea from 2 months ago: Bubbles everywhere: Current risks to the US stock market rally

Short on EURJPY // @ 114.800 - 114.880, bearish (multi-scenario)Multiple scenario's drawn out for EURJPY. I myself haven't traded EURJPY a lot, but the orderblocks seem consistently promising at the moment. It could be that the monthly support is going to cause a stronger bounce. The strength of the bounce shouldn't matter. Reconsider your options at every 'crossing' of the arrows representing potential orderblocks. I'm personally going for this green arrow entry as the previous bearish orderblock seems rather significant.
Good luck!

Push it to the Limit - Dow Jones Industrial 25000 points in 2025Thank you "Helicopter Ben" Bernanke, "The Dove" Janet Yellen, "Daruma" Haruhiko Kuroda and "Super Mario" Draghi for pushing it to the limit around the world.
Technical analysis tools used: 1.618 Fibonacci extension and Fibonacci time zones.
Inspiration for the title: Scarface (The lyrics are below)
www.youtube.com
Push it to the limit
Walk along the razor's edge
but don't look down, just keep your head
and you'll be finished
Open up the limit
past the point of no return
You've reached the top but still you gotta learn
how to keep it
Hit the wheel and double the stakes
throttle wide open like a bat out of hell
and you crash the gates
crash the gates
Going for the back of beyond
Nothing gonna stop you
there's nothing that strong
So close now you're nearly at the brink
so, push it
Ooooh yeah
Welcome to the limit
The limit
Take it maybe one step more
The power game's still playing so
you better win it !!!
