DBC commodity indexDBC commodity index, Commodity prices have stalled but should continue higher as mother nature continues to go haywire interfering with the growth of crops. with a lower yield and ever increasing demand producer prices must raise to accommodate for the hardships therefor that price increase should become reflected on the index price as well.
Search in ideas for "COMMODITY"

Non-straight arbitrage on commodity marketThe commodity market, including the agricultural sector, shows a steady growth in prices.
The growth in the value of corn futures was influenced by the economic recovery, favorable weather conditions and yields. But back in the summer of 2020, prices for this view were at historic lows. Then I drew attention to one feature. Based on the reports of summer maize companies in 2020, most of them were in the zone outside the profitability of production, thereby the companies suspended corn crops and instead of the traditional use of futures for hedging (that is, instead of the usual short deals), the companies began to buy futures. At that time, manufacturers accounted for about 2,000 contracts out of all completed purchase transactions.
Poor margins due to falling corn prices, as well as deteriorating weather and sales conditions in summer 2020, resulted in below-expected (or historical) yields and a hundreds of percent increase in corn prices. The recovery in prices was also facilitated by the transition of manufacturers from liquidity providers (selling futures) in the market to the side of liquidity withdrawals (buyers of futures), and the recovery in demand in China, which is the largest consumer.
This idea is that the fundamental rationale for the rise in corn prices has exhausted itself and most likely in the future, prices will begin to stabilize. That is, the expectation that the cost of this product will decrease from the current one. But for the purposes of more accurate trading and the possibility of not directly hedging oneself from the possible continuation of price increases, I propose to consider the possibility of indirect arbitrage.
The graph shows the ratio of corn prices to wheat prices, which shows the historical average, which I compared between 200MA and 50MA. Thus, it is possible to hedge the risk of possible further inflation of prices in the commodity market and the possibility of earning money on the return of this ratio to average indicators.
The idea is to buy wheat and sell corn through derivatives. In addition to the fundamental and technical rationale, you can add my observation that China, due to the increase in the cost of corn prices, began to buy more wheat. The volume of supply and demand also begins to move towards equilibrium (median).
Good luck to all

Nickel short tradeThanks for viewing,
I am not sure how widespread interest in Nickel is, my interest in Nickel is;
- It is a valuable metal that is in demand as the world turns towards electrification (Nickel currently has a low proportion of its demand ~3% from batteries and ~70% from steel-making but EVS. Vehicle manufacturers are turning towards much higher proportion of vehicles being EVS and battery manufacturers are turning to higher efficiency batteries with a higher proportion of nickel,
- There are therefore, strong fundamental reasons to expect strong long-term demand,
- It is possible to buy large volume physical metal and store it in secure locations (you can even take out a low interest loan on a %age of the market value of the metal collateral) like silverbullion.com.sg.
- I would like to add physical Nickel into my "all weather portfolio" (so that commodity positions comprise 7.5% of the portfolio - a la Ray Dalio) I am looking for an entry point to buy.
If you trade, I put my entry point on a break below the swing low for a 1:1 extension of the previous drop. If my view is correct this would allow wave (B) to complete without making a lower low (than was set in Feb 2016). This would set the scene for a new bull move towards all-time highs. That short trade (stop placed arbitrarily above nearby resistance) could net -27% closing out at $180.93. Actually, I may look into a platform that offers a short contract. If the Feb 2016 low is exceeded, my bullish scenario is off the table.
Reasons for a bearish view:
- MACD histogram strong down trend,
- MACD moving averages looking like crossing over to the downside,
- If a wave (B) unfolds to an expected 1:1 extension that will mean an 44% price decline,
- Lower buy volume for Iron ore over the past 18 months and signs of exhaustion in the Iron Ore rally - and as so much of nickel demand is from steel-making this would also drag down Nickel,
- Nagging suspicions about a generalised property bubble that is in the process of deflating in the west (commercial property down 20-30% in the US in 2020) if it gets underway (massive manipulation will be required to stop the implosion of a huge speculative bubble in residential and commercial property) in China - there could be a huge reduction in steel demand for construction.
At the moment I'm not trading, but looking to enter long around the $180 (below $8000/ton) mark. At the moment silverbullion.com.sg is offering just under 4% over spot and similar buy-sell spread. Storage fee are around 1.5% per year at current prices (more as a % basis for smaller 250kg / 550lb amounts). They have 2000kg bags of 99.8% pure Nickel at USD14,986/ton. I would be looking to enter below USD8000/ton and am hoping for a ~40% price drop overall before the next bull market. Of course, I could be wrong, or right but too early, or I may miss the buy-zone for some reason (like lack of funds) even if it unfolds exactly as I have charted it.
I am not an affiliate and the link posted isn't an affiliate link. It is just something I discovered in my search for gold and silver bullion non-bank vaults. If anyone knows of a better offering elsewhere - please let me know (I am also interested in low premium / spread bulk copper - not small ingots or coins).
Lately, I have been finding Elliot Wave principles very helpful in determining entry-points into commodity, gold and silver, and equity positions. When pessimism prevails people and organisations sell or get liquidated and the bottom normally isn't right at the point that fundamental factors switch from 'sell' to 'buy'. I find EW is helpful for setting entry and exit points - especially in lieu of more concrete information.
Protect those funds

Fed Decision, Inflation in Britain, China and Commodity PricesThe main event of yesterday, and of the week as a whole, is the announcement of the Federal Reserve Open Market Committee two-day meeting results. Markets were expecting assurances from the Central Bank that monetary policy will remain unchanged despite a sharp rise in US inflation.
The Federal Reserve raised its forecast for headline inflation to 3.4%, which is a whole percentage point higher than the March forecast and brought closer the timing of the next increase in interest rates. The Federal Open Market Committee, which sets policy, indicated that the rate hike could occur as early as 2023 (before that, it was announced in March that the rate increase would not be observed until at least 2024). The central bank has given no guidance as to when it will begin cutting back on its aggressive bond buying program.
As we predicted, the US stock market collapsed and the dollar shot up.
The next meeting of the key Central Bank will be held last week - the Bank of England will announce its decision on the parameters of monetary policy. Taking into account yesterday's inflation data from the UK (consumer inflation rose by 2.1%, which exceeds the target of the Bank of England), the Central Bank has a formal reason to start tightening monetary policy. But he is unlikely to use it.
We have already written that China is very unhappy with the current prices for raw materials. The lion's share of the rise in prices for commodity items is accounted for by speculative activity. Not surprisingly, China continues to tighten speculative screws. This time, China has ordered state-owned enterprises to limit their presence in overseas product markets. But most importantly, the authorities also announced that they would soon dump zinc, copper and aluminum from secret national reserves on the market. After this announcement, copper prices fell by 10%.
In this light, let us recall once again our recommendation to sell commodity assets.

US Stock Market= Commodity Type Blow Off This Summer The United States stock market has all the characteristics
of heating up big time this summer,
and potential upside targets, at this point are impossible to predict.
I base this opinion on the rapidly increasing speculative risk tone of the market,
that does not feel like it's late in the game. In fact, it only appears it's just starting to kick off,
with a commodity type blow off in stocks now possible this summer.
Dead in the water stocks during the pandemic like AMC,the movie theatre chain,
now have retail buyers once again pummeling short sellers with AMC rising over 50 % just Thursday/Friday alone this week.
Market Vane's Bullish Sentiment poll has also reached a new 2021 high with 59% of traders polled now bullish.
Historical tops in this indicator, I have been informed have not been hit until the mid 60's bullish
so this market is doing it's thing in converting the masses to this blow off.
The rapid descent of the VIX, back into the teens during the month of May
ashows that big money volatility traders are absolutely sensing the same kind of continued drive to the excesses top.
Commodity blowoff tops are rare for the US stock market.
Certainly in the 1920's, and now precisely 100 years later, .we are in one again.
It is impossible to predict,where, when, or why it will all end
But I assure you ,it will end as badly as you might imagine it could.
Just don't be in the stock market then. Or you shall pay an unimaginable cost.
Enjoy your Memorial Day holiday weekend.
Remember above all else what it stands for.
THE_UNWIND
5/29/21
Woods Of Connecticut
Doge Falling, Commodity Boom and Scottish IndependenceThe main event of the weekend was the epic firing of the Doge token after Musk jokingly (or seriously) confirmed the idea of the host of the Saturday Night Show that the cryptocurrency was a scam. A drop of 30% is a very serious reason to think about the future of the crypto-currency-meme, which, thanks to Musk's PR, almost reached the moon (meaning the price of $1 per token).
And then the head of the Bank of England recalled the consensus opinion among financial professionals about cryptocurrencies: "Cryptocurrencies have no intrinsic value and those who speculate with them need to be prepared to lose all their money."
Note that the demand for cryptocurrencies is one of the derivatives (perhaps the most extreme case) of the overall rally, when an excess of cheap money provokes a rise in prices across almost all ranges of financial markets.
Let's now cast a glance at the commodity markets for example. The Bloomberg Commodity Index has updated its highest levels since 2015. At the same time, the price of iron ore on Monday soared by 10%, and copper renewed its all-time highs.
The pound was also aiming to reach the highest levels since spring 2018 yesterday. On the one hand, the basis for this agility was provided by the dollar, weak after the disastrous data on the NFP. On the other hand, the markets are counting on a sharp growth in the UK economy in connection with the country's exit from the lockdown.
What would happen to the UK economy if Scotland leaves it? The Scots generate about 8% of the Kingdom's GDP. And this question is not so hypothetical. The fact is that last week's elections allowed the political parties advocating the independence of Scotland to gain full control over Parliament (72 out of 129 seats). Their next step is obvious: an attempt to hold a referendum on independence. And although Johnson will obviously refuse, it is unlikely that this will stop the Scots. In any case, we should expect a permanent negative background for the pound on this issue in the foreseeable future. But Britain has not yet recovered from Brexit and the pandemic. In general, a pound at 1.41 is a fair price to sell it in the current realities and prospects.

India's Economy Starts to Slip, but Commodity Markets BoomingThe start of the week was marked by India. In the sense that pandemic records in the country and a complete loss of control over the situation are increasingly materializing in the Indian economy. A number of indirect metrics (the volume of goods transported by rail, the number of residents leaving their homes, etc.), as well as direct ones (the unemployment rate), indicate that economic activity in India is beginning to experience serious problems.
Considering that India has been one of the main drivers of growth in the world economy in recent years, it is somewhat strange to see a record rise in prices in the commodity markets against the background of such news. Copper prices reached their highest level in 10 years. Soybean, wheat and corn prices all hit their highest levels in eight years. And the Bloomberg Commodity Index has reached its highest level in the past few years.
However, the oil market was far from being so optimistic. A sharp slowdown in the economy of the world's third oil importer is a serious cause for concern. Coupled with the increase in production from OPEC Plus, starting from May, the level of anxiety should only increase. In this light, our recommendation to sell oil at current prices remains relevant.
As for the situation on the US stock market, this week the official presentation of Biden's tax plans in all their glory is expected, which will be quite expensive for taxpayers. We have already noted that this is a very serious bearish signal for the stock market. For example, last week on the news of plans to double the tax on capital, the largest exchange-traded fund of shares of technology companies QQQ lost about $ 6 billion. On the other hand, these giants are reporting this week. If they do not repeat the Netflix failure (which is unlikely), the US stock market may well renew all-time highs.

New Agriculture Commodity Bull Market The Entire Agriculture Complex is in the process of breaking out, and not just breaking out, but breaking out of a 12-year old downtrend. I will be posting more charts showing the developing bull market in ag and other commodities, and how I'm expressing that outlook in the portfolio.
In terms of the macro inflation cycle, I think we are somewhere similar to early 2002. I.E. We're fresh out of a cycle low for inflation and commodities which means the new bull market has already started, but it can only be seen in momentum, volume for particular commodities (copper & wheat), and smart money moving into commodities the past few months. By the time price is showing a technical breakout smart money will be selling into volume from moving average breakout chasers. That being said, this commodity bull market can last a long time but it won't come without its volatility. it will be important not to chase extreme moves, but rather be patient and wait to buy on pullbacks. Experience has taught us to wait for weakness to buy and to sell into strength.
If you're not convinced Agriculture is breaking out, look at $IPI Intrepid Potash $Corn $Sugar.
With the assumption that inflation is in the 2nd or 3rd inning of the inflation cycle, stocks like $ICL still have a lot higher to go even though its moved a lot off of its cycle low. Notice that the cycle low was right at the opening original price 14 years ago. The long-term structure of $ICL's price trends shows a well-managed and healthy company that does well in commodity inflation cycles and shareholders haven't been diluted to death in a long-term bear market.
Additionally, $ICL is a similar company to $IPI intrepid potash, but it is better managed and more diversified and internationally-oriented which gives it less market risk and an advantage in terms of globalism-accelerating and Israel having a security and investment advantage on the global market. This being said, $ICL still has 500% upside over a trend-duration to get to a new all-time high, while $IPI potentially has much more than that (1000%+) should it ever overcome the long-term bear market and equity dilution.
Not an equity analyst or licensed professional. Do your own DD.

Gold Commodity Markets11.23.20 I wanted to finish up on my GOLD review from this weekend. The main point that I wanted to make about gold is that there are different trades for different types of traders in that area, and while you may understand how markets like this can appeal to both buyers and sellers in a fairly narrow range, it doesn't mean that it will be your kind of a trait because of your rules. In my own trading, I had to make a distinction between knowing how to read the market, and what markets are suitable to trade regardless of how I read the market. At some point you have to decide what type of trading is most suitable for your personality, and your capabilities. Trading is a business and you want to stay in business, and you want to like your business, and you wanted to be dependable. It doesn't make sense to trade your business as a lotto ticket. Some businesses require a little less time, and this is important because the determination of what kind of a trader you want to be changes many aspects of your trading including the amount of time that you will have to be watching your trading screen.
I ran through some commodity markets that I think will be useful to my students who are far enough along that they may benefit by looking at some commodity markets. There are many reasons for these markets to move higher and lower, The probability of inflationary influences on the markets is very high, and I suspect that you'll see some great trading agricultural markets as well as other commodities markets moving higher as inflation becomes more apparent.

Elliott Wave View: Correction in Oil CompletedElliott Wave View of Oil (CL) suggests the cycle from August 26 high has ended as wave II. The correction unfolded as double three Elliott Wave Structure. Down from August 26 high, wave ((W)) ended at 40.22 low. The bounce in wave ((X)) ended at 41.87 high. Afterwards, the commodity resumed lower and ended wave ((Y)) at 36.21 low. This ended wave II pullback in the higher degree. Since then, the commodity has resumed the rally higher.
Up from wave II low, wave 1 ended at 38.45 high. Wave 2 dip unfolded as zigzag correction and ended at 36.67 low. Currently, wave 3 higher is in progress. The subdivision of wave 3 is unfolding as 5 waves impulse structure. Wave ((i)) ended at 37.82 high and wave ((ii)) dip ended at 36.82 low. Wave ((iii)) higher ended at 40.34 high. Afterwards, pullback in wave ((iv)) ended at 39.51 low. Oil can push for another high before ending wave 3 and followed by a pullback in wave 4 later. As long as 36.21 low stays intact, expect the dips in 3,7 or 11 swings to find support. However, oil still needs to break above August 26 high at 43.78 to confirm that next leg higher in wave III has already started. Otherwise, wave II could still unfold as a double correction before upside resume again.

#SPGSCI - Commodity decade will begin! #Commodity #20%p.a.Question to the readers:
What kind of chart formation is that?
Return would be a minimum of 20% p.a. over a maximum of 5 years After breaking red resistance line.
Greetz from Hanover, Lower Saxony
Stefan

Coffee has taken a dive, now looks ready to rally againPost the sugar-rush of speculative buyers, the commodity sold off heavily, gapping through a short term uptrend-line. Now the commodity, represented by the ETF JO, looks to be stabilizing at the 38.2% Fibonacci level from the Dec 13 high. Moreover, we see a cluster of moving averages, including the 200day Exponential Moving Average at this level. Given the current risk-on, and dollar-down environment, coffee should be supported moving forward. This sell-off is overdone, and other soft commods such as Cocoa and Sugar have performed splendidly in recent weeks. There is no reason for Coffee not to do the same. I am targeting new near term highs, and a 141% extension from the previous rally off the lows.

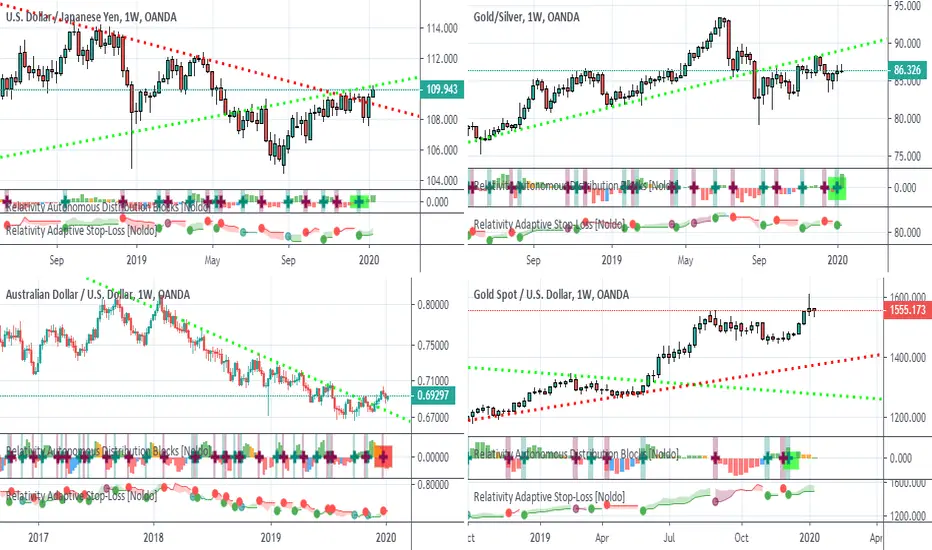
Why did the General Commodity Rally still not start?4 parities were specifically selected.
USDJPY :
It is in very similar movements with Gold.
Even if the buy signal is received, it is still at a critical point.
XAUXAG :
It has finally broken the trend channel been trying to break down for a long time, but still moving very close.
The buy signal is observedit can be evaluated if the trend channel is broken upwards and the signal does not change.
AUDUSD :
A very important parity for commodity rally confirmation.
The country's commodity resources are the largest sectors in the country.
The industrial metal rally will be evident with this pair rising.
Parity broke the trend line he couldn't break for a long time.But short signal received.
This may only be exhausted by the weak momentum as it is on the trend line, even under the influence of the signal.
XAUUSD :
Gold's way behind the trend lines.It's still under buy signal.
But Gold is under the influence of the highest long positions in its history, although it is not included here.
CONCLUSION
For the industrial rally we need to observe:
AUDUSD : Uptrend
XAUUSD : Downtrend
USDJPY : Downtrend
XAUXAG :Downtrend
After that, we can literally watch an industrial metal rally.
This may indicate that the risk will decrease in the world and there will be a great entry to the industrial shares.
If we are only going to watch a gold-based rally, we need to be ready for stable global markets.
Gold-based increases of course on industrial metal rally too, but I think this can only happen after hard sales and declines.
Note :
This will also partially affect energy and agricultural commodities.
Dollar in danger, trade optimism and commodity markets go upThis week, as we noted yesterday, will not be rich in fundamental events, so markets have focused on the trade war.
China deal is likely to be signed in November. Added to this positive news the information that the United States may not set tariffs on imported cars from Europe and Japan.
Naturally, the safe-haven assets adjusted against this background. Despite yesterday's decline, we continue to recommend the purchase of gold and the Japanese yen. Entry points based on yesterday have become even more attractive.
Therefore we observed the growth in the commodity markets. Recall, we recommend buying oil in the region of $ 60 (brand WTI). Especially when you consider the latest news that the IPO Saudi Aramco is finally completing its long epic. With the current information, on December 11, shares of the company can be offered for trading on the Riyadh Stock Exchange.
Returning to the foreign exchange market, we note that the dollar looks less strong in the foreign exchange market. According to the Commodity Futures Trading Commission (CFTC), speculative rates on the growth of the dollar on the Chicago Mercantile Exchange fell by almost two-thirds. Thus, speculators sell the dollar for the second week in a row, and if this trend develops, then in the next reporting period its net position may become short.
So we recall our recommendation to sell the US dollar. The sale of USDCAD seems to be promising. According to CFTC, the net long speculative position on the Canadian dollar reached its most bullish level since December 2017. That is, the markets are very aggressive and it is worth to join the general rush. However, sales of the dollar against the yen, the euro and the pound also look quite prospective.
As for today, the Reserve Bank of Australia expectedly left the rate unchanged. And the most interesting event in terms of macroeconomic statistics today is the publication of the ISM index of business activity in the US services sector. Also, pay attention to the data on the US trade balance.

The break goes on, commodity currencies and the pound purchases The break is going on. Bursts of volatility are observed in pound pairs (just after the last two volatile weeks, this activity seems to be increased only against the background of other currencies standing still). This contributes to both the accumulated fatigue after full of events weeks and the lack of important news.
Justin Trudeau has won a second term as Canada’s prime minister after the country’s federal election. The news as a whole is positive for Canada in general and the Canadian dollar in particular. However, no one rushed to buy it. Nevertheless, we consider Canadian dollar purchases to be a rather prospective trading idea, despite the strong oversold of USDCAD and rather weak data on retail sales in Canada published yesterday (-0.1% with the forecast a + 0.4% rise). So today we will look for points for sales of USDCAD.
Since we are talking about commodity currencies, we want to draw the attention of our readers to AUDUSD. If today it can gain a foothold above 0.6880-0.6890, this will be an excellent occasion to open long positions with a minimum target in the region of 0.7020.
Note that in the light of progress in the negotiations between the US and China, trading currencies, which include the Australian and Canadian dollars, actively work out latest losses and, on the whole, seem quite prospective.
Another good trading idea. Descents of 150-200 +/- points should be used to buy the GBPUSD. Remember, set stops because, at any moment, Brexit news may provoke bursts of volatility.
Speaking of Brexit and the reason for pound’s fall. The main question that plagued the markets can Boris Johnson 'get Brexit done' by October 31? Recall that we predicted that he could not, but in the end, everything would be okay. On the one hand, the Parliament made it clear that it was ready to support the agreement. On the other hand, there is no way to be in time before October 31.
In addition to the statistics on retail sales in Canada, yesterday was remembered for its still weak data on the US real estate market (Sales of existing homes in September fell by 2.2%, while analysts forecast a 0.7% decrease). In this light, we once again recall our recommendation to focus on looking for points for the US dollar purchase. In addition to commodity currencies and the pound, safe-haven assets (gold and the Japanese yen) are well suited for this.

NZDUSD Forecast: China hurts commodity-based currenciesChinese Data released last night does not meet the expectations:
China’s industrial production growth slowed considerably in November – increasing by 5.4% yoy (compared with 5.9% in October).”
China’s nominal fixed asset investment grew a little more slowly in November.
China’s retail sales growth edged marginally higher in November – to 5.8% yoy (from 5.6% in October), a historically weak result
The slowdown on the Chinese Economy hurt commodity-based currencies and commodity exporter countries. New Zeland and Australia are at the top of the list.
RBNZ pointed out that it will keep the interest rates at low levels for a reasonable period until it reaches the target of permanent employment and inflation.
On the other hand, there is FED and USD, which is expected to raise interest rates in December by over 70% possibility and is expected to put interest rates between 2.25% and 2.50%.
Looking at the matter technically;
After yesterday’s brief pause, the pair came under some renewed selling pressure and tumbled to sub-0.6800 level, or over two-week lows in the last hour.
Technical indicators on hourly charts are already pointing to oversold conditions and thus, warrant some near-term consolidation/minor pull-back.
On the weekly chart, Kiwi was unable to break above EMA 100 resistance. An inverted hammer candle indicates a strong bearish reversal.
The head and shoulders pattern started to work again. Daily closings below 0.68000 would trigger the bearish move.
The Targets will be:
0.6750
0.6670
0.6590
0.6550
0.6440
0.6340
and the target of the formation 0.62200
Note: Daily Closings above 0.69800 would invalidate the pattern.

Crude oil to see recovery from current levels!SELF DEVELOPMENT/METHODOLOGY/PSYCHOLOGY
Chart time frame - 2 daily
Timeframe - 1 - 2 Months
Actions on -
A – Activating Event
Commodity finds Support @ current levels . Commodity to move towards the @60 level,
B – Beliefs
Crude Oil needs to consolidate before I look at going long. I will stay on the sidelines until then. Will keep u posted :)
FX_IDC:USDWTI
Happy trading.
Follow your Trading plan, remain disciplined and keep learning !!
Please Follow, Like,Comment & Follow
Thank you for your support :)
This information is not a recommendation to buy or sell. It is to be used for educational purposes only!

Go long commodity and commodity currencyUptrend of the commodity market after USD downside and demand in the world is continues support (Especially China's demand for commodities)...

RunningAlpha Upgrades Commodity Markets Update to Priority ListRunningAlpha dot com Capital Markets Intelligence High Priority Update for Monday, May 2nd, 2016
Although $39 and $36.50 remains baseline intermediate to long-term support for Light Crude Oil ( in reference to June Contract Pricing ), the recent advance upwards has opened the door for a further short covering rally upwards to $62 to $65, and perhaps $74 to $76 levels if on a spike. Bullish window for buying on dips extends into at least June period -- this also applies to Brent Crude. Russian Stock Market ( $RSX ) looks bullish during this period. Oil and Gas Drilling stocks will likely continue higher on balance -- particularly a core position in stocks like $PBR.A would be sensible, which should also benefit from a continued bullish run in Brazilian Equities ( which I expect Brazilian equities should trend higher into the summer, and again later in the fall to close out the year much higher ). Among many other equities in Latin America, $ARCO and $KOF also have a strong bullish bias with sentiment conviction windows extending into foreseeable future.
Other Commodity Markets showing very significant sentiment strength going forward are in the Agricultural complex -- Soybean, particularly Soybean Meal $SOYB, Rice, Corn $CORN, Cotton $BAL and Coffee ( $JO is ETF -- when above $18.02 and especially when trading above above $19.00, then $27 is interim target ), and even wheat to some degree. Equities that would benefit from a rise in these commodity markets should have a tail-wind. Silver and Gold stocks, which RunningAlpha.com has been bullish on for a few months now, still shows signs of strength on pullbacks. Sourced from premium sentiment conviction list on RunningAlpha dot com

Gold in limbo after commodity markets reopen"While we have stated that Fed tightening may not be as negative for gold as in previous tightening cycles, an April rate rise would likely knock gold lower near term."
- HSBC (based on CNBC)
Pair's Outlook
The bullion is continuously set to hover in limbo after the commodity market returned back to trading on Monday morning, meaning the outlook is largely the same as we had indicated on Friday. This is because the closest resistance lies at 1,227 (23.6% retracement of Dec-Mar uptrend) and the nearest support is the 1,205 mark (monthly PP), while the present spot is placed somewhere in between at 1,215.50. This week's technical indicators are giving a "strong buy" signal, meaning we can foresee buoyant gold near the aforementioned support and also the weekly S1/lower Bollinger band at 1,199.
Traders' Sentiment
Even though the commodity market was shut for trading on Friday, this did not prevent the bullish side from gaining market share. It has advanced to 44% by the March 28 morning from 42% three days ago.

GS Commodity Index indicating higher pricesThe Goldman Sachs Commodity Index appears to have broken its recent down-trend, and may be poised to move higher. As oil is a large component of this index, it suggests that oil is also likely to continue higher.
If higher commodity prices are in our future, rising inflation could become a topic that impacts US stocks (positively), bonds (negatively), and currency (positively).

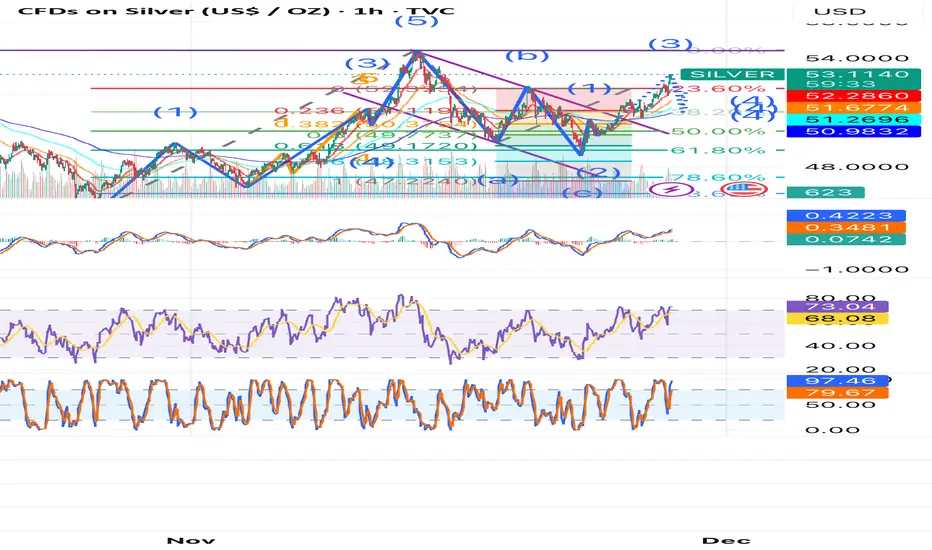
Silver: The Most Mispriced Asset of the Current Commodity SupercSilver looks like one of the clearest cases of mispricing in the current commodity supercycle. Fundamentally and from a demand-growth standpoint, silver is extremely strong, yet the market continues to price it as if the metal were abundant and optional, not structurally tight and increasingly indispensable.
The gold-to-silver ratio tells the story clearly: with gold around $4,065/oz and silver around $50/oz, the ratio sits near 81:1, far above the post-1970 historical mean of roughly 60:1. Historically, deviations above 75–80 have tended to be temporary dislocations that lasted 4–12 months before mean-reverting violently. In many such cases, the reversion came not from gold falling, but from silver accelerating upward at a much faster rate.
That setup is now repeating.
Technically, silver is sitting at a compelling entry zone. On the short-term structure, the metal has already broken above its downward corrective A-B-C channel, completing the C-wave at approximately 0.786 × Wave A rather than a full 1.0 extension, showing buyers stepped in early and with strength. This is often a hallmark of a developing impulse structure.
Price has also double-topped near the marked purple resistance around $54.50, which could be used as a short-term trade resistance or a long-term buying opportunity. A decisive breakout above this level with strong volume would confirm the beginning of a much larger impulse, which aligns cleanly with the broader Wave 5 interpretation on the 1-day chart. That gives the setup both:
- a macro-ratio tailwind, and
- a technical pattern showing the early phase of a bullish expansion leg.
Silver is acting like a coiled spring: ratio extreme, structural demand pressure, and impulsive wave dynamics all point toward a potential accelerated repricing phase.
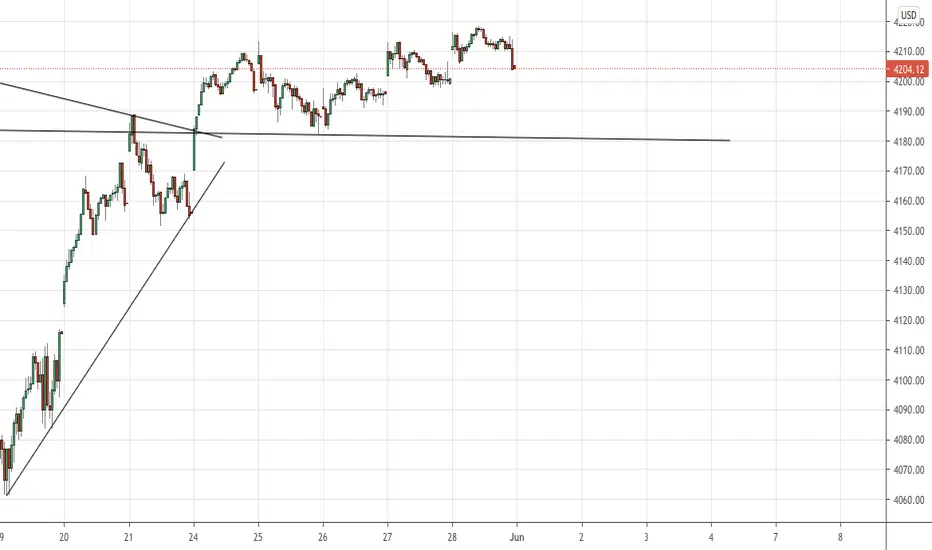
AUD/USD: Uptrend Supported by Stable Commodity MarketThe AUD/USD pair continues to rise, supported by the Australian dollar benefiting from a stable commodity market and a positive risk sentiment. The US dollar is under pressure due to the Fed cutting interest rates, weakening the USD.
AUD/USD is maintaining a strong uptrend, with resistance at 0.6650. Although there has been a slight correction, the primary trend remains upward. If the price breaks through the 0.6650 resistance, the next target could be the 0.6680 area. At the same time, the support trendline at 0.6580 remains intact.
Strategy to consider:
Buy at 0.6580, targeting 0.6650 and 0.6680.
Stop-loss below 0.6580 if the price drops sharply.
With the current uptrend and the stability of the underlying factors, AUD/USD could continue to reach new highs in the short term.
