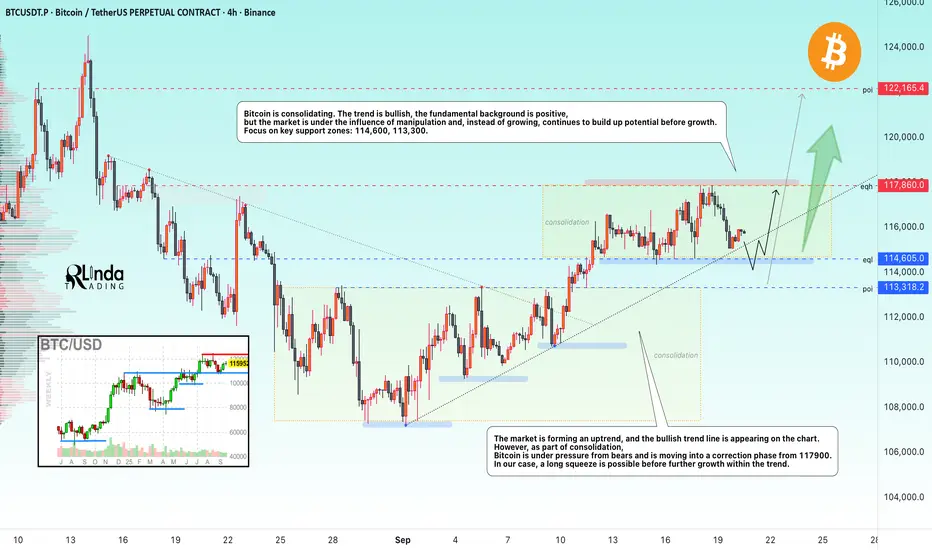
BITCOIN → Manipulation, long squeeze before growth BINANCE:BTCUSDT is in a global bullish trend. The fundamental background, following the start of interest rate cuts, is taking a positive turn, but instead of growth, the market is consolidating...
Bitcoin is showing resilience, trading within the specified trading range (above 114K) amid the Fed's policy easing. For three weeks in a row, growth has been supported by dovish signals from the central bank and growing institutional demand.
Key drivers: The Fed's 25 bps rate cut and forecasts of further easing (to 3.6% by the end of 2025) have strengthened the fundamental backdrop in the cryptocurrency market. Corporate and ETF purchases continue to fuel the bullish trend. Low rates reduce the attractiveness of bonds and increase interest in Bitcoin.
Technically, the market, influenced by manipulation rather than growth, continues to accumulate potential before growth.
Resistance levels: 117860,
Support levels: 114600, 113300
The market is forming an uptrend, with a bullish trend line appearing on the chart. However, as part of consolidation, Bitcoin is under pressure from bears and is moving into a correction phase from 117900. I expect that MM may form a long squeeze in the liquidity zone. That is, a false breakdown of the consolidation support and trend at the same time, and only then return to an upward movement.
Best regards, R. Linda!
Support and Resistance
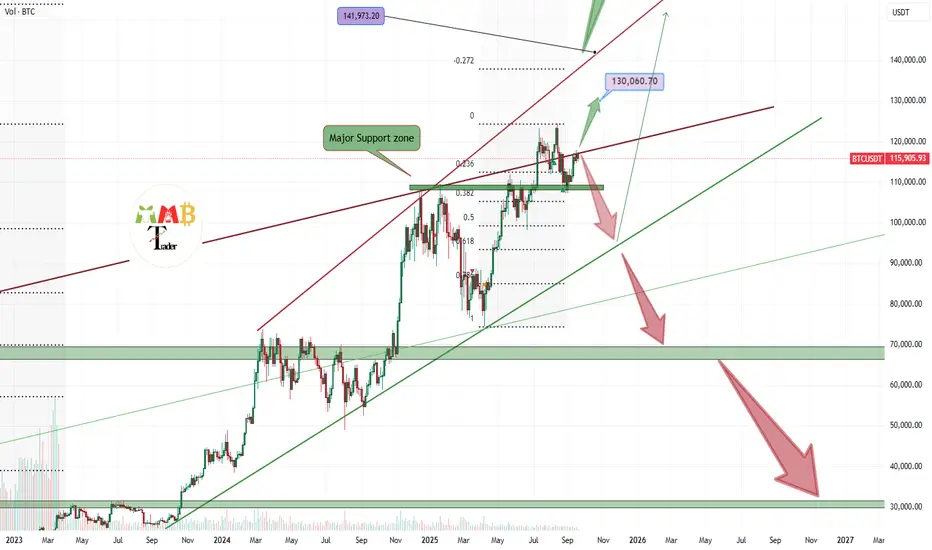
Bitcoin is struggling with 117K Resistance and may dumpAs we can see the chart is clear for the targets like 130K$ but only if the 117K$ resistance zone break to the upside else the market will see some boring range here or even short-term fall first and then near 100K$ support zone again pump will lead to new ATH.
DISCLAIMER: ((trade based on your own decision))
<<press like👍 if you enjoy💚
Learn the Significance of Psychological Levels and Round Numbers
When traders analyze the key levels, quite often then neglect the psychological levels in trading.
In this article, we will discuss what are the psychological levels and how to identify them.
What is Psychological Level?
Let's start with the definition.
Psychological level is a price level on a chart that has a strong significance for the market participants due to the round numbers.
By the round numbers, I imply the whole numbers that are multiples of 5, 10, 100, etc.
These levels act as strong supports and resistances and the points of interest of the market participants.
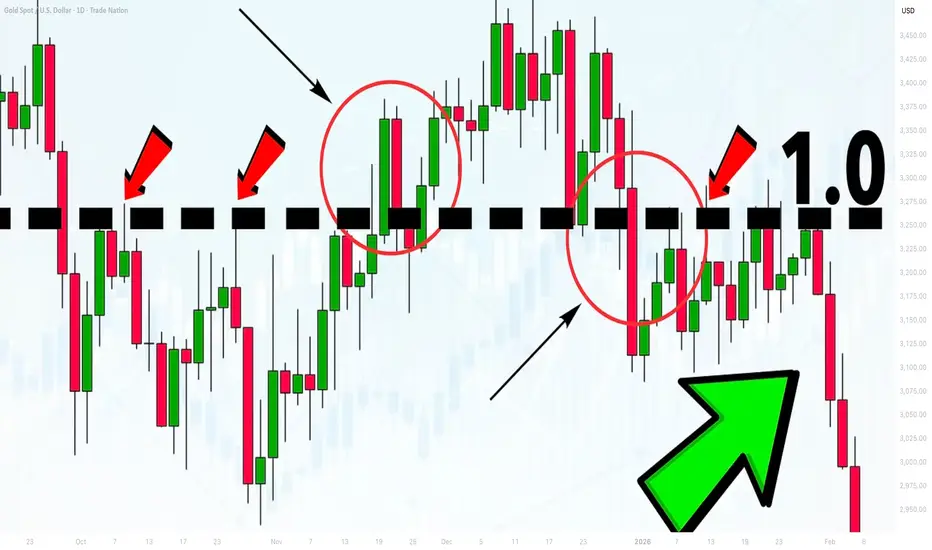
Take a look at 2 important psychological levels on EURGBP: 0.95 and 0.82. As the market approached these levels, we saw a strong reaction of the price to them.
Why Psychological Levels Work?
And here is why the psychological levels work:
Research in behavioral finance has shown that individuals exhibit a tendency to anchor their judgments and decisions to round numbers.
Such a decision-making can be attributed to the cognitive biases.
Quite typically, these levels act as reference points for the market participants for setting entry, exit points and placing stop-loss orders.
Bad Psychological Levels?
However, one should remember that not all price levels based on round numbers are significant.
When one is looking for an important psychological level, he should take into consideration the historical price action.
Here are the round number based levels that I identified on AUDUSD on a weekly time frame.
After all such levels are underlined, check the historical price action and make sure that the market reacted to that at least one time in the recent past.
With the circles, I highlighted the recent reaction to the underlined levels. Such ones we will keep on the chart, while others should be removed.
Here are the psychological levels and proved their significance with a recent historical price action.
From these levels, we will look for trading opportunities.
Market Reaction to Psychological Levels
Please, note that psychological levels may trigger various reactions of the market participants.
For instance, a price approaching a round number may trigger feelings of greed, leading to increased selling pressure as traders seek to lock in profits.
Alternatively, a breakout above/below a psychological level can trigger buying/selling activity as traders anticipate further price momentum.
For that reason, it is very important to monitor the price action around such levels and look for confirmations.
Learn to identify psychological levels. They are very powerful and for you, they can become a source of tremendous profits.
❤️Please, support my work with like, thank you!❤️
I am part of Trade Nation's Influencer program and receive a monthly fee for using their TradingView charts in my analysis.
PEPE is near weekly support If it hold this major weekly support of 0.000010$ then we can see at least 2x here on chart which is easy target for it but also any breakout here to the downside cause two months at least dump and boring range and then pump is expected like second path on chart.
DISCLAIMER: ((trade based on your own decision))
<<press like👍 if you enjoy💚

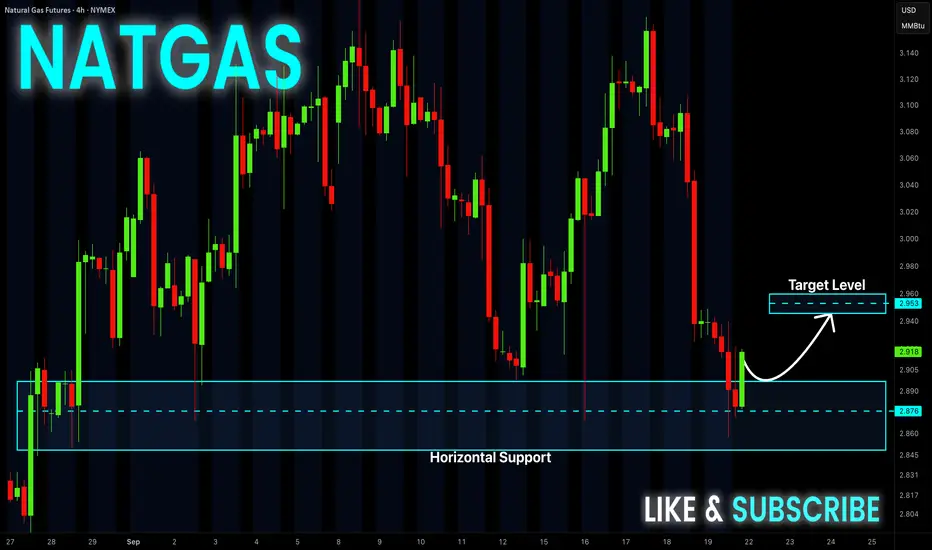
NATGAS Long From Support! Buy!
Hello,Traders!
NATGAS made a retest
Of the wide horizontal
Support level of 2.876$
And a local rebound is
Already taking place so
We are bullish baised
And we think that a local
Bullish correction is to
Be expected on Monday
Buy!
Comment and subscribe to help us grow!
Check out other forecasts below too!
Disclosure: I am part of Trade Nation's Influencer program and receive a monthly fee for using their TradingView charts in my analysis.
NZD-USD Support Ahead! Buy!
Hello,Traders!
NZD-USD keeps falling
Down and the pair is locally
Oversold so when the pair
Hits the support on Monday
We will be expecting a
Local bullish correction
Buy!
Comment and subscribe to help us grow!
Check out other forecasts below too!
Disclosure: I am part of Trade Nation's Influencer program and receive a monthly fee for using their TradingView charts in my analysis.

BNB remains extremely bullish and can hit $1400 soonBNB continues to hold a strong bullish structure on the 4H chart, staying above the 50 EMA and maintaining higher highs and higher lows. Momentum indicators remain supportive of the trend.
📌 Plan: Look to buy the dips.
First demand zone: $959 – $975 (Fib 0.618 support + previous structure)
Second demand zone: $939 – $950 (deeper retracement area)
🎯 Upside targets:
$1,050 → short-term extension
$1,280 → continuation
$1,400 → major bullish target

SHIBUSDT is for sure dead but long-term target is +600%This dead market here is bad and annoying for investors and token and can dump this token below 40 TOP token in next year if it continue like this because in bull market we do not even see nay specific gain here on chart and that is showing dead token because when the dump arrive it will follow that dump for sure.
But we should consider this that still price is holding two major daily support and can pump and break that red trendline and if that happen we will see huge gain here on chart.
DISCLAIMER: ((trade based on your own decision))
<<press like👍 if you enjoy💚

GOLD → Breakthrough of correction resistance. Uptrend FX:XAUUSD entered a correction phase after the Fed meeting and interest rate cut, but by the end of the week, the market managed to recover from the decline and return to the zone of interest, breaking through the resistance of the downtrend...
The dollar is correcting after the Fed meeting on interest rates. The index is testing resistance at 97.5-98.0, and a false breakout of this zone could trigger a fall in the index, which in turn would only support the forex and gold markets...
At this time, the metal is reducing its correlation with the DXY and breaking the resistance of the downward correction, which is provoking an impulse to 3685. Technically, Friday's trading session is closing quite positively, which generally indicates a high level of demand.
I would highlight several key levels: the previously broken resistance at 3674 (below this zone there is a hidden liquidity pool) and resistance at 3685 (trigger). A retest of the lower level is possible before the price continues its growth. The target within the current movement can be considered 3700 - 3710.
Support levels: 3674, 3668, 3660
Resistance levels: 3685, 3703, 3710
If, during the Asian/Pacific session, gold consolidates without a pullback and closes above 3685, the market may continue to rise towards the specified target. However, if the market lacks potential (after the weekend), then MM may test 3674 - 3668 before the price returns to growth towards the target of 3700.
Best regards, R. Linda!

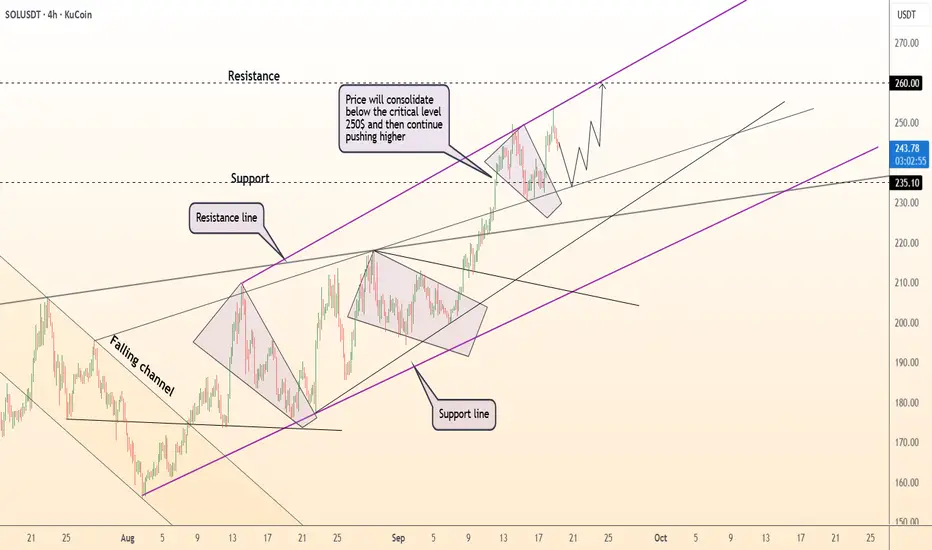
DeGRAM | SOLUSD seeks to the $260 level📊 Technical Analysis
● SOL/USD maintains a rising channel, consolidating just below the $250 resistance after strong rallies from $200 support.
● Structure suggests a bullish continuation, with a breakout targeting $260 if buyers defend $235–$240 as short-term support.
💡 Fundamental Analysis
● Solana gains momentum as institutional flows and DeFi growth increase, while broader crypto sentiment improves with easing risk aversion.
✨ Summary
SOL/USD is consolidating below $250, with $235–$240 as support and upside potential toward $260 if momentum holds.
-------------------
Share your opinion in the comments and support the idea with a like. Thanks for your support!
BITCOIN Update: Stay Alert (4H)This analysis is an update of the analysis you see in the "Related publications" section
Read the analysis carefully
Given the loss of the trendline, Bitcoin stalling, and decreasing momentum, the previous Bitcoin analysis needed to be updated.
If Bitcoin fails to make a valid breakout above the yellow line at $116,520 and does not sustain above it, a bearish scenario will emerge, and the price will drop significantly
A bullish outlook toward the supply zone shown on the chart above is only valid if Bitcoin executes a confirmed breakout above $116,520.
So stay alert and follow the chart closely.
For risk management, please don't forget stop loss and capital management
Comment if you have any questions
Thank You

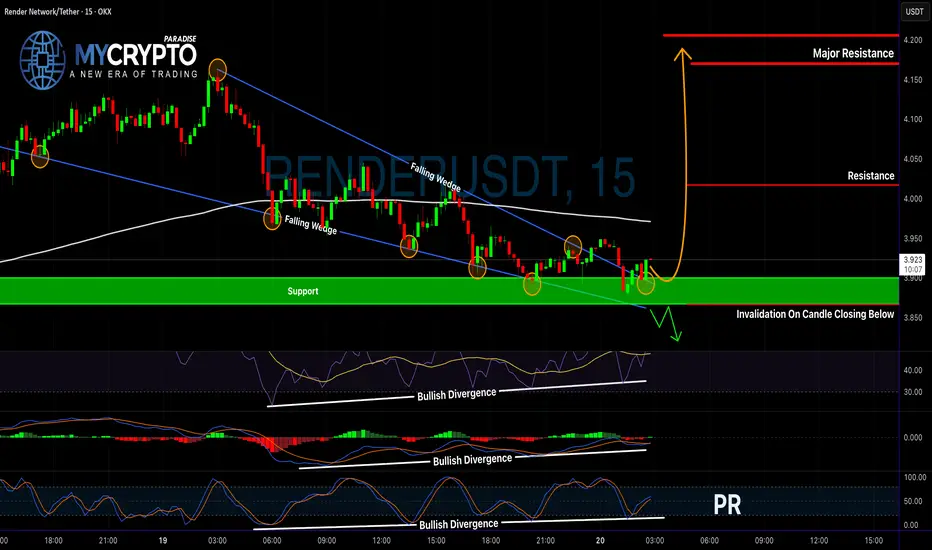
Is RENDER About to Explode?Yello Paradisers, are you watching closely? RENDERUSDT just completed a textbook breakout—and it might be your best shot at catching a high-probability move before the crowd even notices.
💎RENDERUSDT has officially broken out of a falling wedge—a powerful bullish pattern—confirmed by bullish divergence on the RSI, MACD, and Stochastic RSI. When all three indicators align like this, the probability of a strong upside move significantly increases.
💎Even better, price action has already retested the wedge breakout, and from the current levels, the market is offering a favorable risk-to-reward (RR) setup.
💎Now, if you’re looking for additional confirmation, a more cautious play would be to wait for a pullback into the nearest support zone, and then enter on a bullish candlestick formation. This approach could not only boost your confidence but also improve your overall RR.
💎However, stay sharp—if price breaks and closes below the support and our invalidation level, the entire setup gets invalidated. In that case, patience is key. Wait for stronger price action before considering re-entry.
🎖Strive for consistency, not quick profits. Treat the market as a businessman, not as a gambler. Be patient, stay focused, and let the market come to you, Paradisers. That’s how the winners play this game long-term.
MyCryptoParadise
iFeel the success🌴
GOLD (XAUUSD): Rise to All-Time High Confirmed
There is a high chance that Gold will continue rising next week,
following a completion of a correctional movement on a 4H time frame
with a confirmed bullish Change of Character CHoCH.
Odds are high, that the price will rise to 3707 level,
with a highly probable update of ATH.
❤️Please, support my work with like, thank you!❤️
I am part of Trade Nation's Influencer program and receive a monthly fee for using their TradingView charts in my analysis.

THE KOG REPORT - UpdateEnd of day update from us here at KOG:
What a week! Our path worked well from Monday-Wednesday which is when we published the FOMC Report, which also worked extremely well on the red box indicator and hot spots. Yesterday we wanted that low for a push up and as you can see now, the move is in progress.
It's too late in the session now to attempt anything other than a scalp, but ideally the entries long are from the red box level which was given yesterday. We now have resistance at the 3695 region with support 3664 which needs to hold. The race for the close is on!
Wishing you all a great weekend ahead and we'll see you on Sunday for the KOG Report and our view for the week.
Please take some time to hit the boost button on our ideas and we appreciate the following.
As always, trade safe.
KOG

EURUSD: Support & Resistance Analysis For Next Week 🇪🇺🇺🇸
Here is my latest structure analysis:
important supports and resistances for EURUSD for next week.
Consider these structures for pullback/breakout trading.
❤️Please, support my work with like, thank you!❤️
I am part of Trade Nation's Influencer program and receive a monthly fee for using their TradingView charts in my analysis.

GBP/USD 4H Setup✅ Plan: Looking to BUY at support zone once clear bullish confirmation is triggered.
🔑 Trade Idea:
Entry: Around 1.3430 – 1.3450 (support zone)
SL: Below recent swing low aftr bullish confirmation
TP1: 1.3640
TP2: 1.3800
⚠️ Wait for confirmation before entering — no blind buys.
#GBPUSD #ForexSignals #PriceAction

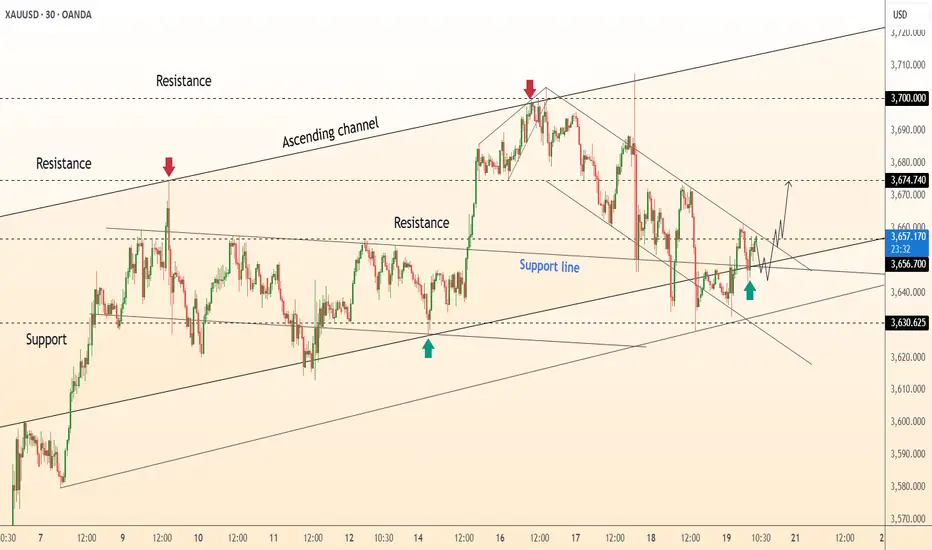
DeGRAM | GOLD fixed above the support line📊 Technical Analysis
● XAU/USD is trading within an ascending channel, holding above the 3630 support and attempting to reclaim 3656 resistance.
● A breakout above 3674 would confirm bullish momentum, opening the path toward 3700 while the lower boundary near 3630 acts as structural support.
💡 Fundamental Analysis
● Gold gains short-term support from weaker Treasury yields and cautious Fed outlook, as traders weigh inflation risks against slower global growth.
✨ Summary
XAU/USD defends 3630 support and targets 3674–3700 resistance, with momentum favoring a bullish short-term continuation.
-------------------
Share your opinion in the comments and support the idea with a like. Thanks for your support!
GOLD may need some rest now After the expected gain:
now we may have some rest and short-term dump here like red arrow on chart but only if more war news did not pump the price.
DISCLAIMER: ((trade based on your own decision))
<<press like👍 if you enjoy💚

YOU MAY LIVE TO SEE MANMADE HORRORS BEYOND YOUR COMPREHENSION :)"Beyond Technical Analysis" aka "Wave Analysis > Shingo Waves"
Some very notable calls in recent years:
SPREADEX:NIKKEI and TVC:DJI both to 40k (over 1y in advance)
CRYPTOCAP:BTC pico bottom at 15k and recent local top at 70k
FX:EURUSD pico bottom & TVC:DXY pico top at 115
TVC:USOIL pico bottom at 68
NASDAQ:SMCI mega breakout at 100
NASDAQ:NVDA mega support at 120
NASDAQ:TSLA pico bottom at 105
NASDAQ:NFLX pico bottom at 165
I've also absolutely NAILED _both_ OANDA:XAUUSD and OANDA:XAGUSD breakouts in their entirety (@ see history)
USDJPY BUY IDEA!A good buy opportunity is envisaged in USDJPY. We await price to retrace to around 147.203 it’s a good zone to go long. Our target profit is at 150.728

XAGUSD Holds 41.40 Strong – Bulls Ready for 43 AgainAs I’ve often highlighted in my previous Silver outlooks, OANDA:XAGUSD usually offers cleaner technical setups than Gold, with less “noise” and fewer manipulation spikes. This time is no exception.
After touching the 43.00 zone, Silver entered a corrective phase, sliding down to 41.40 – a key confluence support. Price tested this level no less than four times, and each time buyers stepped in, eventually pushing the market higher.
Much like in Gold, this drop from the highs should not be mistaken for a trend reversal. Instead, it’s a healthy correction inside a strong uptrend. Based on the price action, we can now argue that the correction is likely complete.
📊 Trading plan:
• My strategy is to buy dips, ideally around the 41.80 zone.
• First target remains the 43.00 resistance area.
• Invalidation (negation) comes only with a daily close below 41.50.
In short, Silver has shown resilience at support, and unless 41.50 breaks, I stay with the bulls. 🚀

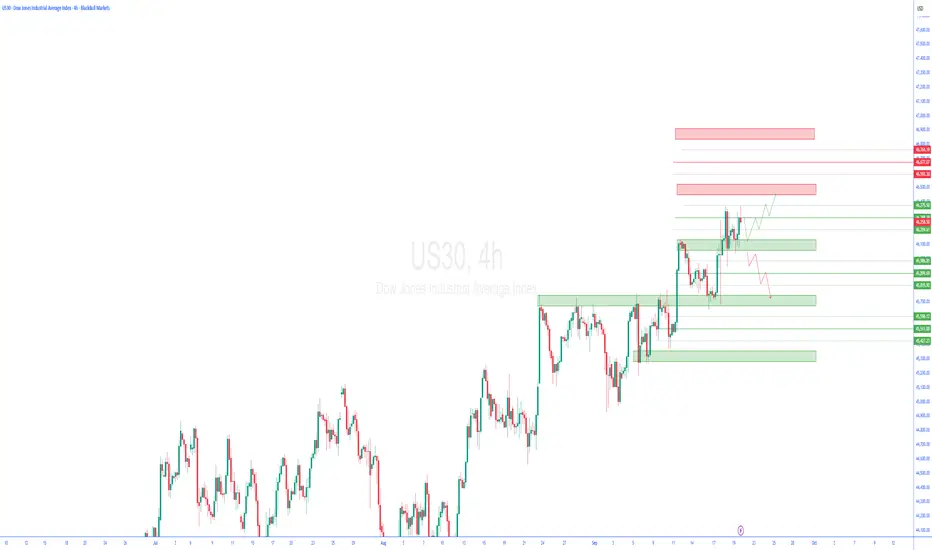
us30 4hTrading Perspectives for the Upcoming Week
In this series of analyses, we have reviewed short-term trading perspectives and outlooks.
As can be seen, in each analysis there is a significant support/resistance zone near the current asset price. The market’s reaction to or break of this level will determine the future price trend up to the next specified levels.
Important Note: The purpose of these trading perspectives is to examine key price levels and the market’s potential reactions to them. The analyses provided are by no means trading signals!
BITCOIN Update: Stay Alert (4H)This analysis is an update of the analysis you see in the "Related publications" section
Read the analysis carefully
Given the loss of the trendline, Bitcoin stalling, and decreasing momentum, the previous Bitcoin analysis needed to be updated.
If Bitcoin fails to make a valid breakout above the yellow line at $116,520 and does not sustain above it, a bearish scenario will emerge, and the price will drop significantly
A bullish outlook toward the supply zone shown on the chart above is only valid if Bitcoin executes a confirmed breakout above $116,520.
So stay alert and follow the chart closely.
For risk management, please don't forget stop loss and capital management
Comment if you have any questions
Thank You
