KOLD in BUY ZONEMy trading plan is very simple.
I buy or sell when at either of these events happen:
* Price tags the top or bottom of parallel channel zones
* Money flow volume spikes beyond it's Bollinger Bands
So...
Here's why I'm picking this symbol to do the thing.
Price in buying zone at bottom of channe
ETF market

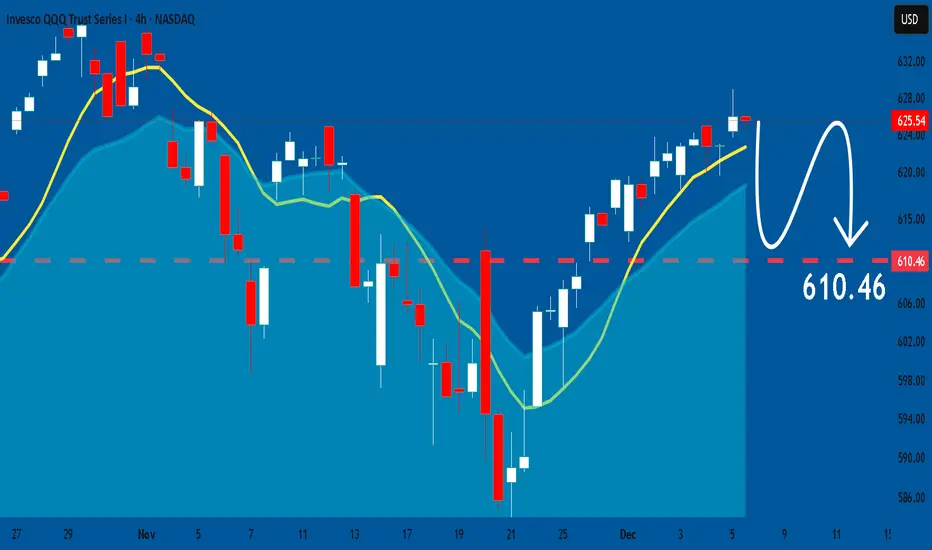
QQQ (5 December)When QQQ tops on the daily timeframe, you typically see upper-band overextension, multiple rejection wicks, bearish engulfing candles, a clear lower high formation, EMA breakdown & shrinking momentum + rising volatility, but the chart shows the opposite
Price bounced cleanly off the mid-band & is

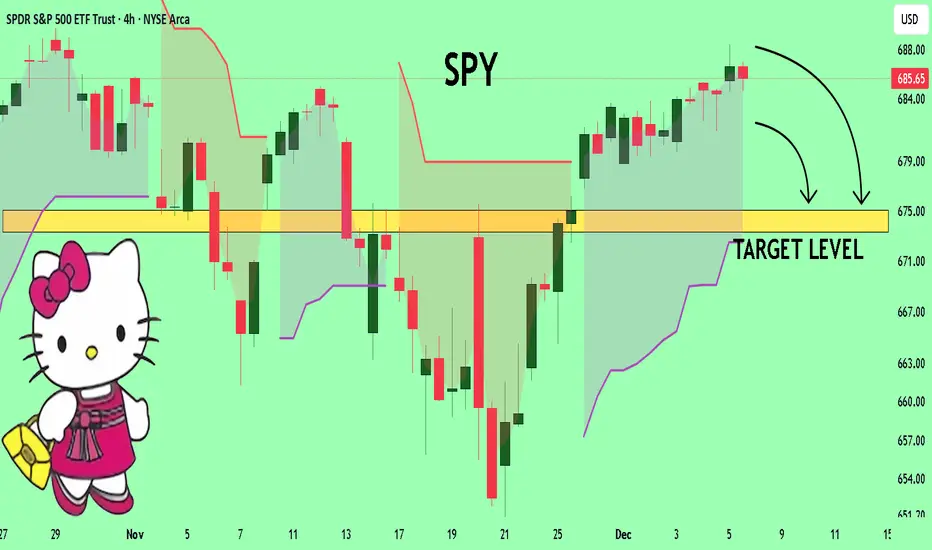
SPY Free Signal! Sell!
Hello, Traders!
SPY is tapping into a premium supply zone after a sharp displacement, with liquidity resting below the recent swing structure. Price is expected to retest the rejection block before delivering a move into downside objectives. Time Frame 6H.
Sell!
Comment and subscribe to help us

KOLD BUY ZONESimple Reasons Why I Think KOLD is a buy
1️⃣ Price is sitting at a proven demand zone
That green boxed area has already stopped price multiple times.
Each time price touched that zone, buyers stepped in fast.
This tells us big money is defending this level, not retail guessing.
👉 Marke

VOO. How are profits fueling the S&P 500 bull rally?The S&P 500 has risen approximately 17.8% year-to-date (including dividends). November was the seventh consecutive month of growth, and we're only about 1% away from all-time highs.
Profits are the main driver.
All the dynamics in 2025 are explained not by speculation, but by fundamentals:
+12.2

SPY Set To Fall! SELL!
My dear followers,
I analysed this chart on SPY and concluded the following:
The market is trading on 685.65 pivot level.
Bias - Bearish
Technical Indicators: Both Super Trend & Pivot HL indicate a highly probable Bearish continuation.
Target - 675.10
About Used Indicators:
A super-trend indi
QQQ: Price Action & Swing Analysis
Balance of buyers and sellers on the QQQ pair, that is best felt when all the timeframes are analyzed properly is shifting in favor of the sellers, therefore is it only natural that we go short on the pair.
Disclosure: I am part of Trade Nation's Influencer program and receive a monthly fee for u
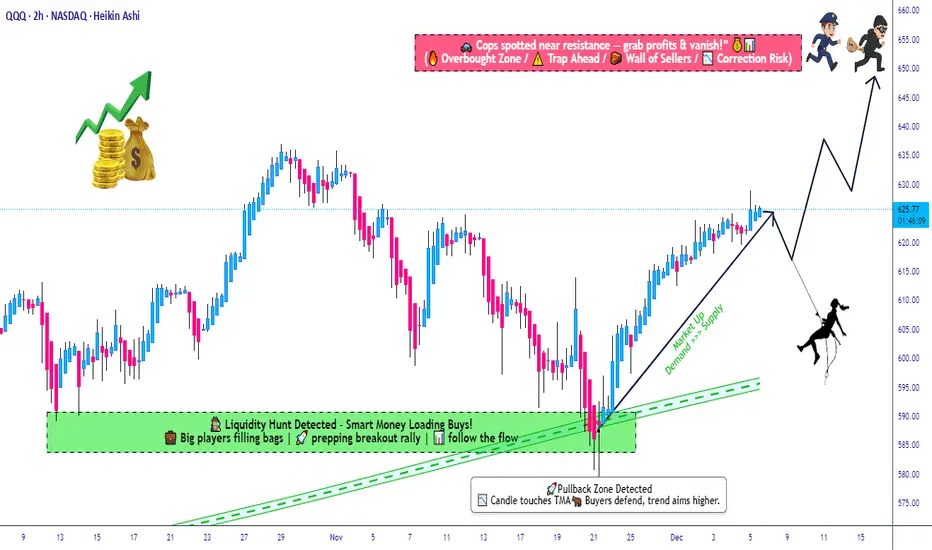
QQQ Structured Bullish Scenario • Compression Into MA Support📌 Asset: QQQ — Invesco QQQ Trust Series 1 (NASDAQ ETF)
🔎 Style: Swing / Day-Trade Profit Playbook
🎨 Theme: Bullish Pullback Setup using Triangular Moving Average + Layered Entry Strategy
📈 Bullish Pullback Plan — “Thief Layering Strategy” Edition 🕵️♂️💰
QQQ is pulling back into a Triangular Moving
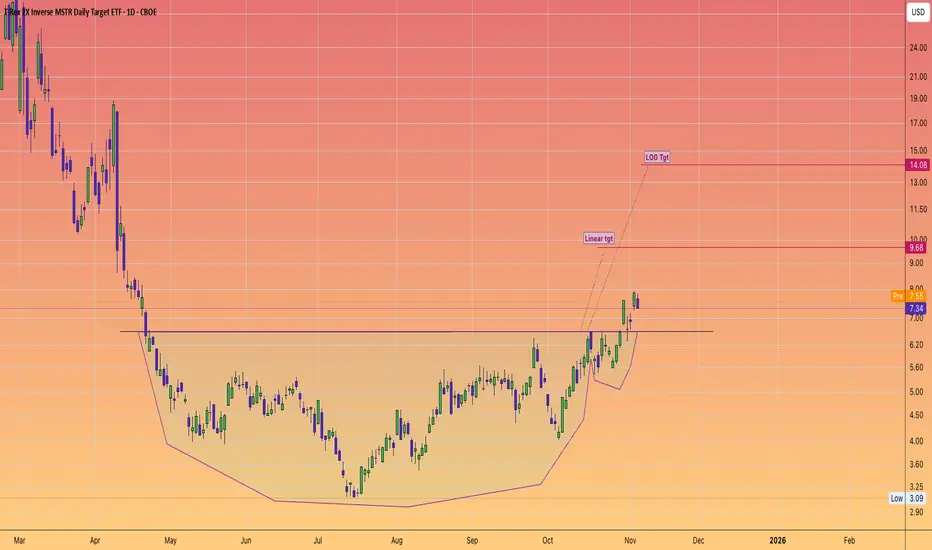
Trade idea: $MSTZ 2X inverse #MSTRThese measured moves are determined from the #cupandhandle pattern.
There is also a inverse head and shoulders pattern within the CUP section, giving further credence that we shall this pattern perform to target.
And thus see further weakness with #Saylor's #Bitcoin investment vehicle.
What goe
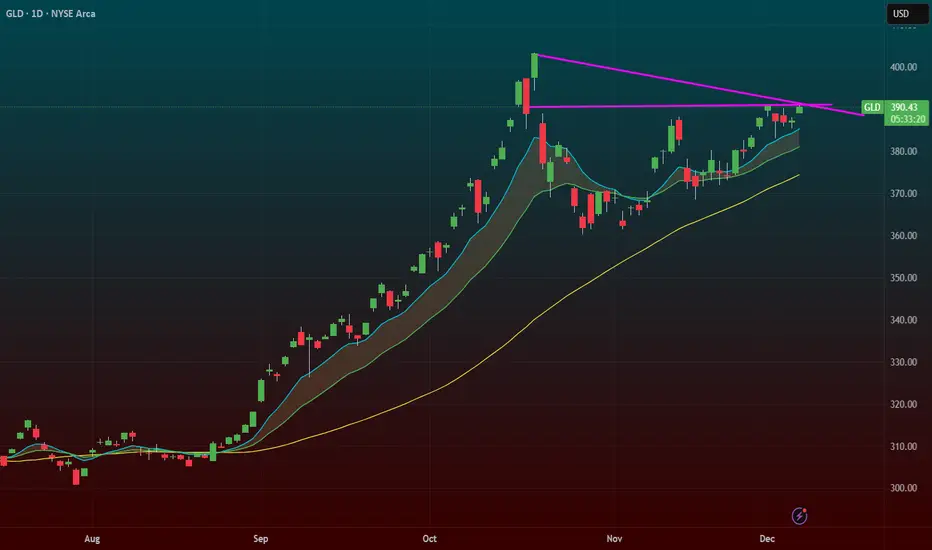
$GLD – Multiple Breakouts Converging: Flag + Trendline + Gap FilGold ( AMEX:GLD ) is triggering one of the cleanest breakout setups on the entire market right now. We're getting a flag breakout, a longer-term trendline break, and we’re pushing straight into a gap fill from October 20th — all at the same time.
This is the kind of confluence I dream about.
🔹 The
See all popular ideas
Community trends
SymbolPrice & chgNAV total return 1Y
SymbolNAV total return 1Y / Price
SymbolPrice & chgDividend yield FWD
SymbolDividend yield FWD / Price
ETF collections
LargestHighest AUM growthHighest returnsBiggest losersEquityBitcoinEthereumGoldFixed incomeReal estateTotal marketCommoditiesAsset allocationInverseLeveragedMost tradedLargest inflowsLargest outflowsHighest discount to NAVHighest premium to NAVHighest yieldDividendMonthly distributionsHighest diversificationActively managedSectorHighest betaLowest betaNegative betaHighest expense ratioAll-time highAll-time low52-week high52-week lowETFs of the USAETFs of CanadaETFs of the United KingdomETFs of GermanyETFs of JapanETFs of AustraliaSee all